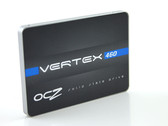
Intel Core i7-2600K
Intel Core i7-2600K - мощный четырехъядерный процессор семейства Sandy Bridge для настольных ПК. На момент выхода в продажу в начале 2011 года он являлся самым быстрым процессором его поколения. Тем не менее, некоторые технологии, присутствующие в других процессорах Sandy Bridge, в нем были отключены, а именно vPro, VT-d и Trusted Execution. Благодаря технологии Hyper-Threading, четыре ядра способны одновременно обрабатывать до восьми потоков данных. Процессор работает на частоте в 3.4 ГГц, но может ускориться до 3.8 ГГц при достаточном охлаждении: 3.8 ГГц - 1 нагруженное ядро 3.7 ГГц - 2 нагруженных ядра 3.6 ГГц - 3 нагруженных ядра 3.5 ГГц - 4 нагруженных ядра Как и все процессоры K-серии, i7-2600K легко разогнать благодаря разблокированному множителю. Встроенная видеокарта Intel HD Graphics 3000 работает на частоте от 850 до 1350 МГц (с использованием Turbo Boost). В процессор также встроен двухканальный контроллер памяти, поддерживающий до 32 ГБ памяти DDR3-1333.
Серия Intel Core i7 (Desktop) Кодовое имя Sandy Bridge Серия: Core i7 (Desktop) Sandy Bridge Intel Core i7-2700K 3.5 - 3.9 ГГц 4 / 8 8 MB » Intel Core i7-2600K 3.4 - 3.8 ГГц 4 / 8 8 MB
Частота 3400 - 3800 MHz Кэш L2 1 MB Кэш L3 8 MB Количество ядер 4 / 8 Теплопакет (TDP) 95 Вт Число транзисторов 995 млн Техпроцесс 32 нм Размер кристалла 216 mm2 Макс. температура 72.6 °C Разъём (сокет) LGA1155 Особенности SSE4.1, SSE4.2, AVX, Turbo Boost (3.80GHz), Hyper-Threading, VT-x, AES-NI, Intel 64, Idle States, EIST, Thermal Monitoring Technologies, Intel Fast Memory Access, Intel Flex Memory Access, XD bit, open Multiplicator Встроенная графика Intel HD Graphics 3000 (850 - 1350 MHz)64 бита + Architecture x86 Цена на начало продаж $317 U.S. Дата анонса 03/01/2011 Сайт производителя Intel Core i7 (Desktop) 2600K
Тесты на производительность Cinebench R15 - Cinebench R15 CPU Multi 64 Bit
min: 613 сред.: 614 медиана: 613.5 (14%) макс.: 614 Points
...
Intel Core i5-10310U 2%
Intel Core i7-10610U 2%
Intel Core i3-9100F 3%
...
AMD Ryzen Threadripper 2970WX 613%
Cinebench R15 - Cinebench R15 CPU Single 64 Bit
129 Points (47%)
...
Intel Core i5-6500T -1%
Intel Core i7-8500Y 1%
Intel Core i3-7100H 1%
Intel Core i5-6267U 2%
...
AMD Ryzen 9 5900X 110%
Cinebench R11.5 - Cinebench R11.5 CPU Multi 64 Bit
6.8 Points (14%)
...
Intel Core i7-4760HQ -3%
AMD Ryzen 3 2200G -1%
Intel Core i7-3820QM 1%
Intel Core i5-7500 2%
...
AMD Ryzen 9 5950X 607%
Cinebench R11.5 - Cinebench R11.5 CPU Single 64 Bit
1.5 Points (48%)
...
Intel Core i5-6400 0%
Intel Core i7-6650U 0%
Intel Core i7-6560U 1%
Intel Core i5-7Y57 1%
Intel Core i7-5960X 1%
...
AMD Ryzen 9 5900X 108%
Cinebench R10 - Cinebench R10 Rend. Single (32bit)
4809 баллов (43%)
...
AMD Ryzen 5 2600 -2%
Intel Core i5-2500K -1%
Intel Core i7-3520M 0%
Intel Pentium G4500T 0%
Intel Core i5-6360U 1%
Intel Core i3-7100H 1%
Intel Core i5-6500T 1%
...
Cinebench R10 - Cinebench R10 Rend. Multi (32bit)
18608 баллов (31%)
...
Intel Core i5-6400 -2%
Intel Core i7-2960XM -2%
...
Cinebench R10 - Cinebench R10 Rend. Multi (64bit)
22897 Points (22%)
...
Intel Core i7-2960XM -3%
...
AMD Ryzen 9 5900X 335%
Cinebench R10 - Cinebench R10 Rend. Single (64bit)
6001 Points (45%)
...
Intel Core i5-3360M -2%
Intel Core i5-2500K -1%
Intel Core i5-6300U 1%
Intel Core i7-3520M 2%
Intel Core i7-2960XM 3%
...
AMD Ryzen 7 5800X 117%
wPrime 2.10 - wPrime 2.0 1024m *
328 s (4%)
AMD Ryzen Threadripper 2970WX -88%
...
Intel Core i7-7820HQ -3%
Intel Core i7-2670QM -2%
Intel Core i7-6920HQ -1%
Intel Core i5-6400 0%
Intel Xeon E3-1505M v6 0%
Intel Core i7-2630QM 1%
AMD Ryzen 3 2200G 2%
Intel Core i7-3612QM 3%
Intel Core i3-9100F 5%
...
VIA C3-M C3-M-1200 2479%
wPrime 2.10 - wPrime 2.0 32m *
10.5 s (2%)
Intel Core i9-9980XE -74%
...
Intel Core i7-6920HQ -3%
AMD FX-9830P -2%
Intel Core i7-2670QM -2%
Intel Core i7-2630QM -2%
Intel Core i7-2820QM 2%
AMD Ryzen 3 2200G 3%
Intel Xeon E3-1505M v6 5%
...
Transmeta Crusoe TM-5800 4633%
wPrime 1.55 - wPrime 1.55 1024m *
234 s (1%)
Intel Core i7-2700K -8%
AMD Ryzen 5 PRO 4650U 1%
Intel Core i9-10910 4%
AMD Ryzen 7 PRO 4750U 12%
...
Intel Celeron M 373 10871%
wPrime 1.55 - wPrime 1.55 32m *
7.1 s (4%)
Intel Core i7-2700K 2%
AMD Ryzen 5 PRO 4650U 8%
Intel Core i9-10910 9%
AMD Ryzen 7 PRO 4750U 12%
...
Intel Pentium M 713 2561%
3486 баллов (22%)
AMD Athlon Neo MV-40 -90%
...
Intel Core i5-7267U -7%
Intel Core i5-7360U -2%
Intel Core i7-2700K 1%
Intel Core i5-7600K 2%
Intel Core i7-6820HQ 4%
AMD Ryzen 7 1700X 7%
...
AMD Ryzen 7 5800X 348%
X264 HD Benchmark 4.0 - x264 Pass 2
36.5 fps (17%)
Intel Pentium 4 2.4 GHz -95%
...
Intel Core i7-3820QM 2%
Intel Core i7-2700K 3%
...
AMD Ryzen 9 5950X 481%
X264 HD Benchmark 4.0 - x264 Pass 1
145 fps (43%)
...
Intel Core i5-6400T -4%
Intel Core i3-1115G4 -2%
Intel Core i7-2700K 1%
Intel Core i7-3820QM 3%
Intel Core i5-6400 3%
...
AMD Ryzen 7 5800X 134%
TrueCrypt - TrueCrypt Serpent
0.3 GB/s (13%)
Intel Pentium Gold 4415Y -97%
...
AMD Ryzen 3 2200G -3%
Intel Core i5-7500 0%
Intel Core i3-9100F 2%
Intel Core i7-2700K 3%
AMD A8-7650K 5%
...
AMD Ryzen 9 5950X 646%
TrueCrypt - TrueCrypt Twofish
0.6 GB/s (15%)
Intel Pentium Gold 4415Y -97%
...
Intel Core i5-7500 -6%
Intel Core i5-7600K 2%
Intel Core i7-2700K 3%
...
AMD Ryzen 9 3950X 542%
TrueCrypt - TrueCrypt AES
3.3 GB/s (12%)
...
AMD Ryzen 3 2200G -6%
Intel Core i5-7500 -3%
Intel Core i5-7600K 0%
Intel Core i5-8500T 3%
Intel Core i7-3820QM 6%
Intel Core i7-2700K 6%
...
AMD Ryzen 9 5950X 688%
3DMark 06 - CPU - 3DMark 06 - CPU
min: 6358 сред.: 6649 медиана: 6669 (37%) макс.: 6791 Points
HD Graphics 3000 4096 МБ 850-1350 / МГц 6358
Desktop GTX 680 GeForce GTX 680 8192 МБ 1059 / МГц 2048МБ 6505
Radeon HD 4350 4096 МБ 500 / МГц 512МБ 6550
Radeon HD 5670 4096 МБ 775 / МГц 1024МБ 6614
Radeon HD 5570 4096 МБ 650 / МГц 1024МБ 6642
Radeon HD 6450 GDDR5 4096 МБ 750 / МГц 512МБ 6655
GeForce GTS 450 4096 МБ 783 / МГц 6665
Radeon HD 5770 4096 МБ 850 / МГц 1024МБ 6669
Radeon HD 4850 4096 МБ 6671
Radeon HD 6790 4096 МБ 840 / МГц 1024МБ 6672
Desktop 2600K GTX 580 GeForce GTX 590 8192 МБ 607 / МГц 1536МБ 6713
Radeon HD 6870 4096 МБ 900 / МГц 1024МБ 6730
Sapphire Tri-X R9 290X Desktop Radeon R9 290X 8192 МБ 1040 / МГц 4096МБ 6743
Desktop 2600K GTX 580 GeForce GTX 580 8192 МБ 783 / МГц 1536МБ 6754
Radeon HD 6870 4096 МБ 900 / МГц 1024МБ 6791
...
AMD Ryzen 3 2200G 0%
Intel Core i7-2960XM 3%
Intel Core i7-3820QM 3%
Intel Core i7-2700K 3%
...
AMD Ryzen 9 5950X 166%
Super Pi mod 1.5 XS 1M - Super Pi mod 1.5 XS 1M *
10.2 s (2%)
...
Intel Xeon E3-1505M v5 -1%
Intel Core i7-3820QM -1%
AMD Ryzen Threadripper 2920X 0%
Intel Core i7-7700 0%
Intel Core i7-6920HQ 0%
AMD Ryzen Threadripper 2970WX 0%
AMD Ryzen Threadripper 2950X 1%
Intel Core i7-3520M 1%
Intel Core i7-5960X 2%
...
VIA C3-M C3-M-1200 4439%
Super Pi mod 1.5 XS 2M - Super Pi mod 1.5 XS 2M *
22.4 s (1%)
...
Intel Core i7-6820HK 0%
Intel Core i7-6700 0%
Intel Core i7-8500Y 0%
AMD Ryzen Threadripper 2920X 0%
AMD Ryzen Threadripper 2970WX 0%
Intel Xeon E3-1505M v5 0%
Intel Core i7-3820QM 1%
Intel Core i7-7700 2%
Intel Core i7-5960X 2%
Intel Core i7-6920HQ 2%
...
Intel Celeron Dual-Core T1400 10346%
Super Pi Mod 1.5 XS 32M - Super Pi mod 1.5 XS 32M *
560 s (2%)
...
Intel Core i7-2700K -1%
Intel Core i7-3820QM -1%
Intel Core i7-7700 -1%
Intel Core i7-6920HQ 0%
Intel Core i5-7300U 1%
Intel Core i5-8305G 1%
...
VIA C3-M C3-M-1200 3920%
SiSoft Sandra Dhrystone (MIPS) - SiSoft Sandra Dhrystone (MIPS)
118000 MIPS (56%)
...
Intel Core i7-2670QM -16%
Intel Core i7-2720QM -7%
Intel Core i7-2960XM 2%
...
Intel Xeon E3-1535M v5 46%
SiSoft Sandra Whetstone (MFLOPS) - SiSoft Sandra Whetstone (MFLOPS)
82400 MFLOPS (63%)
...
Intel Core i7-2960XM -2%
Intel Xeon E3-1505M v5 -2%
Intel Core i7-6700 2%
Intel Core i7-3820QM 4%
Intel Core i7-2700K 5%
Intel Xeon E3-1535M v5 6%
...
Windows 7 Experience Index - Win7 CPU
7.6 Points (97%)
...
Intel Core i7-3820QM 0%
Intel Core i7-2960XM 0%
Intel Core i7-2700K 0%
Intel Xeon X5670 1%
...
3DMark Vantage - 3DM Vant. Perf. CPU no Physx
min: 22530 сред.: 23608 медиана: 23731 (27%) макс.: 24019 Points
HD Graphics 3000 4096 МБ 850-1350 / МГц 22530
Desktop GTX 680 GeForce GTX 680 8192 МБ 1059 / МГц 2048МБ 22816
GeForce GTS 450 4096 МБ 783 / МГц 23490
Radeon HD 4850 4096 МБ 23576
Desktop 6870 at 6990M clocks Radeon HD 6990M 4096 МБ 715 / МГц 23592
Desktop 2600K GTX 580 GeForce GTX 590 8192 МБ 607 / МГц 1536МБ 23621
Radeon HD 6790 4096 МБ 840 / МГц 1024МБ 23707
Radeon HD 6450 GDDR5 4096 МБ 750 / МГц 512МБ 23731
Radeon HD 5670 4096 МБ 775 / МГц 1024МБ 23735
Radeon HD 6870 4096 МБ 900 / МГц 1024МБ 23750
Radeon HD 6870 4096 МБ 900 / МГц 1024МБ 23809
Radeon HD 5570 4096 МБ 650 / МГц 1024МБ 23826
Sapphire Tri-X R9 290X Desktop Radeon R9 290X 8192 МБ 1040 / МГц 4096МБ 23920
Radeon HD 5770 4096 МБ 850 / МГц 1024МБ 24002
Desktop 2600K GTX 580 GeForce GTX 580 8192 МБ 783 / МГц 1536МБ 24019
...
Intel Core i7-2960XM -2%
Intel Core i7-3820QM 2%
Intel Core i7-2700K 4%
...
AMD Ryzen 7 5800X 264%
3DMark 11 - 3DM11 Performance Physics
min: 7865 сред.: 8579 медиана: 8527 (35%) макс.: 9487 Points
...
Intel Core i5-8305G -5%
Intel Xeon X5670 -3%
Intel Core i5-7600K -2%
Intel Core i7-2700K 0%
Intel Core i3-9100F 2%
AMD Ryzen 5 PRO 4650U 2%
Intel Core i7-6920HQ 2%
Intel Core i5-8500T 3%
...
AMD Ryzen 9 5950X 184%
3DMark - 3DMark Ice Storm Physics
min: 40698 сред.: 43628 медиана: 44325 (29%) макс.: 44752 Points
Samsung Hummingbird S5PC110 / Exynos 3110 -99%
...
Intel Core i5-6400T -3%
Intel Xeon E5-2680 v4 -1%
Intel Core i5-7300U -1%
AMD Ryzen 3 2200U 0%
Intel Core i7-6650U 1%
Intel Xeon E3-1505M v6 2%
...
3DMark - 3DMark Ice Storm Extreme Physics
min: 42348 сред.: 44674 медиана: 44674 (47%) макс.: 47000 Points
Sapphire Tri-X R9 290X Desktop Radeon R9 290X 8192 МБ 1040 / МГц 4096МБ 42348
Desktop GTX 680, Intel Core i7-2600K GeForce GTX 680 8192 МБ 1059 / МГц 2048МБ 47000
...
Intel Xeon E5-2680 v4 -3%
AMD Ryzen 3 2200U -3%
Intel Core i7-6650U -2%
Intel Xeon E3-1535M v5 -2%
AMD Ryzen Threadripper 2970WX 2%
Intel Core i7-6770HQ 2%
Intel Xeon E3-1505M v5 4%
AMD Ryzen 3 3300U 6%
...
AMD Ryzen 7 5800X 111%
3DMark - 3DMark Ice Storm Unlimited Physics
min: 44250 сред.: 44554 медиана: 44553.5 (46%) макс.: 44857 Points
Desktop GTX 680, Intel Core i7-2600K GeForce GTX 680 8192 МБ 1059 / МГц 2048МБ 44250
Sapphire Tri-X R9 290X Desktop Radeon R9 290X 8192 МБ 1040 / МГц 4096МБ 44857
Qualcomm Snapdragon S4 Play MSM8625Q -93%
...
HiSilicon Kirin 820 -7%
Intel Core i3-8121U -6%
Intel Xeon E5-2680 v4 -5%
AMD Ryzen 3 2200U -5%
Intel Core i7-6600U -3%
Intel Core i7-6560U -1%
Intel Core i5-7267U 0%
Intel Core i7-6650U 1%
AMD Athlon 300U 2%
...
AMD Ryzen 7 5800X 117%
3DMark - 3DMark Cloud Gate Physics
min: 6298 сред.: 6359 медиана: 6360.5 (16%) макс.: 6434 Points
...
Intel Core i3-9100F -1%
Intel Core i7-6770HQ 0%
Intel Core i7-8705G 4%
...
AMD Ryzen 7 5800X 262%
3DMark - 3DMark Fire Strike Standard Physics
min: 8740 сред.: 8789 медиана: 8798 (22%) макс.: 8832 Points
...
Intel Core i3-9100F 2%
Intel Core i5-7600K 3%
...
AMD Ryzen 9 5950X 334%
Geekbench 2 - 32 Bit - Geekbench Stream
2537 Points (20%)
...
AMD Phenom II X4 905e -6%
AMD A4 Micro-6400T -5%
Intel Celeron N3050 -2%
Qualcomm Snapdragon 690 5G -2%
Mediatek Helio P65 1%
HiSilicon Kirin 955 4%
AMD A4-6210 5%
...
Intel Core i7-7740X 389%
Geekbench 2 - 32 Bit - Geekbench Memory
5074 Points (46%)
...
Intel Pentium B950 -3%
Intel Core i3-6100U 0%
Intel Core i5-3317U 1%
Intel Pentium Gold 5405U 2%
Intel Core i5-3210M 3%
HiSilicon Kirin 820 3%
...
Intel Core i7-7740X 117%
Geekbench 2 - 32 Bit - Geekbench Floating Point
9088 Points (18%)
...
Intel Core i5-6360U -9%
AMD Ryzen 3 2200U -4%
AMD Athlon 300U 2%
Qualcomm Snapdragon 460 2%
...
Geekbench 2 - 32 Bit - Geekbench Integer
9443 Points (19%)
...
AMD Ryzen 3 3300U -7%
...
Geekbench 2 - 32 Bit - Geekbench Total Score
7754 Points (20%)
...
Qualcomm Snapdragon 690 5G -6%
AMD Ryzen 3 2200U -4%
Intel Core i5-6360U -4%
Intel Core i7-6500U -2%
HiSilicon Kirin 955 6%
...
Geekbench 3 - Geekbench 3 32 Bit Multi-Core
min: 11506 сред.: 11547 медиана: 11546.5 (20%) макс.: 11587 баллов
Samsung Hummingbird S5PC110 / Exynos 3110 -98%
...
...
Geekbench 3 - Geekbench 3 32 Bit Single-Core
min: 2975 сред.: 3015 медиана: 3015 (62%) макс.: 3055 баллов
Samsung Hummingbird S5PC110 / Exynos 3110 -92%
...
Intel Core i5-6400T 0%
Intel Core i5-6198DU 0%
Intel Core i7-6500U 0%
Intel Pentium G4500T 4%
...
Geekbench 3 - Geekbench 3 64 Bit Multi-Core
12009 баллов (19%)
Qualcomm Snapdragon 215 -91%
...
AMD Ryzen 3 3300U -5%
...
Geekbench 3 - Geekbench 3 64 Bit Single-Core
3189 баллов (65%)
Qualcomm Snapdragon 215 -90%
...
Intel Core i3-7130U -7%
Intel Core i5-6400T -2%
Intel Core i7-6500U -1%
Intel Core i5-6198DU -1%
AMD Ryzen 3 2200U 0%
Intel Core i5-6260U 0%
AMD Athlon 300U 0%
Intel Core i5-6300U 1%
Intel Pentium G4500T 2%
...
Intel Core i7-8700K 54%
Mozilla Kraken 1.1 - Kraken 1.1 Total Score *
1297 ms (2%)
...
AMD Ryzen 3 3300U -5%
Intel Core i5-6198DU -1%
Intel Core m5-6Y57 0%
Intel Core i5-L16G7 0%
Intel Core i5-6300U 0%
Intel Core m5-6Y54 2%
Intel Core i5-6267U 3%
Intel Core i5-7500 3%
...
Sunspider - Sunspider 1.0 Total Score *
min: 150.6 сред.: 157 медиана: 157.3 (2%) макс.: 164 ms
Desktop GTX 680 GeForce GTX 680 8192 МБ 1059 / МГц 2048МБ Chrome 29 150.6
Desktop GTX 680, Intel Core i7-2600K GeForce GTX 680 8192 МБ 1059 / МГц 2048МБ Chrome 33 164
...
AMD A9-9420 -6%
AMD A9-9410 -6%
Apple A11 Bionic -5%
Intel Core m5-6Y57 1%
AMD A6-9220 3%
AMD A12-9700P 5%
AMD A12-9700P 5%
AMD Pro A12-8800B 5%
...
Octane V2 - Octane V2 Total Score
min: 7883 сред.: 15417 медиана: 15416.5 (24%) макс.: 22950 Points
Desktop GTX 680, Intel Core i7-2600K GeForce GTX 680 8192 МБ 1059 / МГц 2048МБ IE 10 7883
Desktop GTX 680, Intel Core i7-2600K GeForce GTX 680 8192 МБ 1059 / МГц 2048МБ Chrome 33 22950
...
MediaTek Dimensity 800 -4%
MediaTek Dimensity 720 -3%
AMD PRO A8-9600B -2%
Mediatek Helio G95 3%
AMD A8-7650K 3%
...
- Разброс результатов видеопроцессора
- Средний результат видеопроцессора
* Меньше = лучше
v1.16
log 22. 21:25:11
#0 no ids found in url (should be separated by "_") +0s ... 0s
#1 not redirecting to Ajax server +0s ... 0s
#2 did not recreate cache, as it is less than 5 days old! Created at Thu, 21 Jan 2021 11:08:23 +0100 +0.001s ... 0.001s
#3 no comparison url found in template nbc.compare_page_2 needed +0.004s ... 0.005s
#4 composed specs +0s ... 0.005s
#5 did output specs +0s ... 0.005s
#6 getting avg benchmarks for device 1574 +0.001s ... 0.006s
#7 got single benchmarks 1574 +0.039s ... 0.045s
#8 got avg benchmarks for devices +0s ... 0.045s
#9 min, max, avg, median took s +0.451s ... 0.496s
#10 no comparison url found in template nbc.compare_page_2 needed +0s ... 0.496s
#11 return log +0s ... 0.496s
:: Не найдено обзоров для этого процессора.
Другие процессоры из серии Core i7 (Desktop) » Intel Core i7-6950X 10x 3 GHz - 3.5 GHz
» Intel Core i7-5960X 8x 3 GHz - 3.5 GHz
» Intel Core i7-6700K 4x 4 GHz - 4.2 GHz
» Intel Core i7-6700 4x 3.4 GHz - 4 GHz
» Intel Core i7-2700K 4x 3.5 GHz - 3.9 GHz
» Intel Core i7-975 4x 3.33 GHz - 3.6 GHz
» Intel Core i7-960 4x 3.2 GHz - 3.47 GHz
» Intel Core i7-950 4x 3.06 GHz - 3.33 GHz
» Intel Core i7-940 4x 2.93 GHz - 3.2 GHz
» Intel Core i7-920 4x 2.66 GHz - 2.93 GHz
Похожие процессоры + Intel Core i7-2700K 4x 3.5 GHz - 3.9 GHz
- Intel Xeon X5670 6x 2.93 GHz - 3.33 GHz
Please share our article, every link counts!
Klaus Hinum (Update: 2013-10-14)