AMD A10-5800K
AMD A10-5800K - процессор для настольных ПК, основанный на архитектуре Trinity. Он производится на 32-нм техпроцессе и состоит из 2 модулей с 4 вычислительными ядрами в общей сложности, работающими на частоте от 3.8 до 4.2 ГГц. Кроме этого, 5800K оснащен встроенной видеокартой Radeon HD 7660D и контроллером памяти DDR3-1866. Благодаря разблокированному множителю, процессор легко разогнать. 
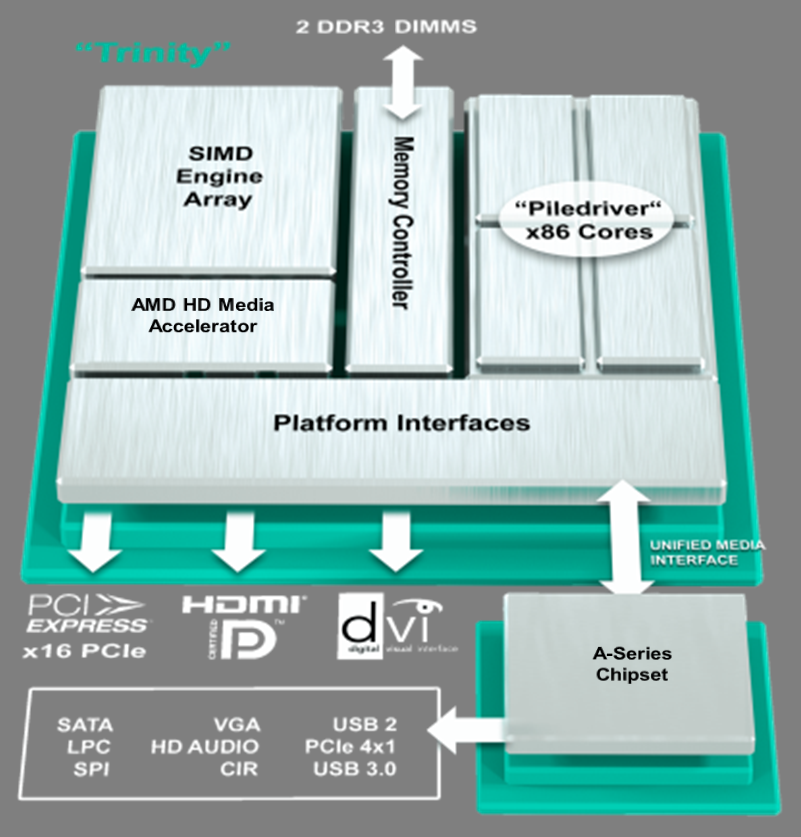
Ядра процессора основаны на улучшенной архитектуре Bulldozer, названной Piledriver. Несмотря на то, что он позиционируется как четырехъядерный процессор, A10-5800K оснащен всего лишь двумя модулями с четыремя вычислительными ядрами и двумя математическими сопроцессорами в общей сложности. Поэтому A10-5800K не является настоящим четырехъядерным процессором. В зависимости от бенчмарка, производительность A10-5800K более или менее сопоставима с Intel Core i3-3220. Процессор выдает хорошую производительность в приложениях с хорошо реализованной многопоточностью, но производительность отдельных потоков не так впечатляет. 5800K подходит для любых ежедневных задач, будь то офисные и мультимедийные приложения или работа с Интернетом, а если добавить дискретную видеокарту, то получится и поиграть в требовательные 3D-игры. Встроенная DirectX 11-совместимая видеокарта Radeon HD 7660D использует все 384 потоковых процессора чипа Trinity на частоте в 800 МГц без поддержки турбо-режима. В среднем, ее производительность сравнима с дискретной Radeon HD 7670M для ноутбуков и заметно выше, чем Intel HD Graphics 4000 в процессорах семейства Ivy Bridge. Расчетное энергопотребление процессора составляет 100 Вт.
Серия AMD A-Series (Desktop) Кодовое имя Trinity Серия: A-Series (Desktop) Trinity Частота 3800 - 4200 MHz Кэш L2 4 MB Количество ядер 4 / 4 Теплопакет (TDP) 100 Вт Число транзисторов 1303 млн Техпроцесс 32 нм Размер кристалла 246 mm2 Встроенная графика AMD Radeon HD 7660D (800 MHz)64 бита + Architecture x86 Цена на начало продаж $122 U.S. Дата анонса 26/09/2012
Тесты на производительность Cinebench R11.5 - Cinebench R11.5 CPU Multi 64 Bit
min: 3.3 сред.: 3.3 медиана: 3.3 (7%) макс.: 3.33 Points
...
Intel Core i5-6198DU -3%
Intel Core i3-6100H -3%
Intel Core i5-3360M -2%
Intel Core i5-6260U -2%
Intel Core i7-840QM 0%
Intel Core i7-3520M 0%
AMD A8-7650K 1%
Intel Core i7-6500U 2%
Intel Core i5-6360U 2%
Intel Core 2 Extreme (Desktop) QX6850 2%
...
AMD Ryzen 9 5950X 1340%
Cinebench R11.5 - Cinebench R11.5 CPU Single 64 Bit
min: 1.02 сред.: 1 медиана: 1 (33%) макс.: 1.04 Points
...
AMD A9-9420 -5%
Intel Core m5-6Y54 -2%
Intel Core i5-3317U -2%
Intel Pentium Gold 4415U -2%
AMD A10-7850K -2%
Intel Pentium Gold 5405U -1%
Intel Pentium Silver N5030 -1%
Intel Core i3-7100U 0%
Intel Core i5-3427U 1%
Intel Core i7-640M 3%
Intel Core i7-2637M 6%
...
AMD Ryzen 9 5900X 205%
Cinebench R10 - Cinebench R10 Rend. Single (32bit)
min: 3056 сред.: 3094 медиана: 3093.5 (28%) макс.: 3131 баллов
...
Intel Core 2 Extreme (Desktop) X6800 -3%
AMD A10-7700K -3%
Intel Core i5-520M -2%
Intel Core 2 Extreme X7900 -2%
AMD FX-9830P -2%
Intel Core i7-640LM -1%
Intel Core 2 Duo (Desktop) E6850 -1%
AMD A6-6400K -1%
Intel Core i7-740QM 0%
Intel Core 2 Extreme (Desktop) QX6850 0%
Intel Core 2 Quad (Desktop) Q9550 0%
Intel Core i5-460M 0%
Intel Core i7-720QM 0%
Intel Core i3-3110M 1%
Intel Core 2 Extreme QX9300 1%
...
Intel Core i9-11900K 241%
Cinebench R10 - Cinebench R10 Rend. Multi (32bit)
min: 9266 сред.: 9276 медиана: 9275.5 (15%) макс.: 9285 баллов
...
Intel Core i5-4310U -3%
Intel Core i5-2540M -3%
Intel Core i5-L16G7 -3%
Intel Core i7-2620M -2%
Intel Pentium G4500T -1%
Intel Core i7-840QM 0%
AMD A8-7650K 2%
Intel Core i5-6200U 2%
Intel Core 2 Extreme (Desktop) QX6700 3%
AMD A8-3850 3%
...
Intel Core i9-11900K 569%
Cinebench R10 - Cinebench R10 Rend. Multi (64bit)
min: 12959 сред.: 12973 медиана: 12973 (12%) макс.: 12987 Points
...
Intel Core i5-7Y57 -5%
Intel Core i5-3360M -4%
Intel Core i5-6200U -3%
Intel Core i7-920XM -2%
Intel Core i7-3520M -2%
AMD A8-7650K 2%
Intel Core i7-940XM 3%
Intel Core i7-6500U 4%
Intel Core i5-6300U 4%
AMD A10-7700K 5%
...
AMD Ryzen 9 5900X 668%
Cinebench R10 - Cinebench R10 Rend. Single (64bit)
min: 4139 сред.: 4180 медиана: 4180 (30%) макс.: 4221 Points
...
Intel Core i3-3110M -3%
AMD A10-7700K -2%
Intel Core i5-580M -2%
Intel Core i5-560M -2%
Intel Core i7-620M -2%
AMD A6-6400K -1%
Intel Core i7-2617M -1%
Intel Core i7-840QM 0%
Intel Core i5-2557M 1%
Intel Core m3-6Y30 2%
Intel Core i5-3317U 3%
AMD A10-7850K 3%
Intel Core i5-3427U 4%
Intel Core i7-2657M 5%
...
Intel Core i9-11900K 238%
wPrime 2.10 - wPrime 2.0 1024m *
min: 500.7 сред.: 502 медиана: 501.8 (6%) макс.: 502.9 s
AMD Ryzen Threadripper 2970WX -92%
...
Intel Core i5-7267U -2%
Intel Core i7-3520M -2%
Intel Core i7-7500U -2%
Intel Core i5-3360M -1%
Intel Core i5-7360U 0%
Intel Core i3-7100H 0%
Intel Core i7-6600U 0%
Intel Core i7-6500U 1%
AMD Athlon 300U 2%
Intel Core i5-6300U 2%
AMD A10-6800K 2%
AMD Pro A12-8800B 3%
...
VIA C3-M C3-M-1200 1585%
wPrime 2.10 - wPrime 2.0 32m *
15.9 s (3%)
Intel Core i9-10850K -83%
...
Intel Core i5-7267U -2%
Intel Core i7-6500U -1%
Intel Core 2 Extreme QX9300 -1%
Intel Core i3-7100H 0%
Intel Core i7-740QM 1%
Intel Core i5-6300U 1%
AMD A10-6800K 1%
Intel Core i7-2620M 3%
AMD Pro A12-8800B 4%
...
Transmeta Crusoe TM-5800 3026%
min: 2472 сред.: 2501 медиана: 2501 (16%) макс.: 2530 баллов
AMD Athlon Neo MV-40 -87%
...
Intel Core i7-8500Y -1%
Intel Core i3-2370M 1%
Intel Core i7-7500U 2%
Intel Core i7-6500U 2%
...
AMD Ryzen 7 5800X 524%
X264 HD Benchmark 4.0 - x264 Pass 2
min: 21.8 сред.: 21.9 медиана: 21.9 (10%) макс.: 21.9 fps
Intel Pentium 4 2.4 GHz -91%
...
Intel Core i7-6600U -5%
AMD FX-8800P -4%
Intel Core i3-7100H -3%
Intel Core i5-7267U 0%
Intel Core i7-7500U 0%
Intel Core i5-7360U 1%
Intel Core i5-6267U 1%
AMD Athlon Gold 3150U 3%
AMD A8-7650K 4%
...
AMD Ryzen 9 5950X 868%
X264 HD Benchmark 4.0 - x264 Pass 1
min: 105.6 сред.: 107 медиана: 106.6 (31%) макс.: 107.6 fps
...
Intel Core i5-6198DU -5%
Intel Core i5-6260U -2%
Intel Core i7-6500U -2%
AMD A8-7650K 1%
Intel Core i5-6360U 2%
AMD A10-7700K 3%
Intel Core i7-6560U 3%
Intel Core i7-6600U 4%
AMD A10-6800K 4%
...
AMD Ryzen 7 5800X 217%
TrueCrypt - TrueCrypt Serpent
min: 0.208 сред.: 0.2 медиана: 0.2 (9%) макс.: 0.209 GB/s
Intel Pentium Gold 4415Y -95%
...
Intel Core i7-6600U -5%
AMD Pro A12-8800B -4%
AMD PRO A8-9600B -4%
Intel Core i7-6650U -4%
AMD Athlon 300U -1%
Intel Core i7-6567U -1%
AMD Ryzen 3 2200U 1%
AMD A10-9600P 1%
Intel Core i7-7500U 2%
Intel Core i5-7300U 3%
Intel Core i5-2400 3%
AMD Athlon Gold 3150U 5%
...
AMD Ryzen 9 5950X 1027%
TrueCrypt - TrueCrypt Twofish
min: 0.379 сред.: 0.4 медиана: 0.4 (10%) макс.: 0.38 GB/s
Intel Pentium Gold 4415Y -95%
...
Intel Core i7-7500U -6%
Intel Core i7-8500Y -5%
Intel Core i5-7300U -4%
AMD A12-9720P -3%
Intel Core i5-6400T -1%
Intel Core i5-2400 0%
Intel Core i5-7360U 1%
...
AMD Ryzen 9 3950X 849%
TrueCrypt - TrueCrypt AES
1.9 GB/s (7%)
...
Intel Core i5-6267U 0%
Intel Core i7-6560U 0%
AMD Athlon 300U 0%
Intel Core i7-6600U 2%
Intel Core i7-6650U 5%
AMD A8-7650K 5%
AMD FX-9830P 5%
...
AMD Ryzen 9 5950X 1268%
3DMark 06 - CPU - 3DMark 06 - CPU
min: 4311 сред.: 4437 медиана: 4464 (25%) макс.: 4536 Points
...
AMD Ryzen 3 3300U -2%
Intel Core i7-6600U -2%
Intel Core i5-7267U -1%
AMD A8-7650K -1%
Intel Core i7-7500U 0%
Intel Core i5-6267U 0%
Intel Core 2 Extreme (Desktop) QX6850 1%
Intel Core i5-7300U 1%
AMD A10-7700K 1%
...
AMD Ryzen 9 5950X 298%
Super Pi mod 1.5 XS 1M - Super Pi mod 1.5 XS 1M *
min: 23.9 сред.: 24.2 медиана: 24.2 (5%) макс.: 24.5 s
Intel Core i9-11900K -74%
...
Intel Core 2 Duo P7450 -3%
Intel Pentium P6000 -3%
Intel Core 2 Duo T8100 -3%
Intel Core 2 Duo T7300 -2%
Intel Core 2 Duo T7400 -1%
Intel Celeron M P4500 -1%
Intel Core 2 Duo T6500 0%
Intel Celeron N4020 0%
Intel Celeron J4125 2%
AMD Phenom II X2 X640 BE 2%
Intel Pentium Silver N5030 3%
...
VIA C3-M C3-M-1200 1813%
Super Pi mod 1.5 XS 2M - Super Pi mod 1.5 XS 2M *
min: 54.5 сред.: 55.1 медиана: 55.1 (2%) макс.: 55.7 s
Intel Core i9-11900K -75%
...
AMD Athlon II M320 -2%
Intel Celeron M 575 -2%
Intel Core 2 Duo P8700 -2%
Intel Pentium P6000 -2%
Intel Core 2 Duo T7500 -1%
Intel Core 2 Duo T7600 0%
Intel Core 2 Quad Q9000 0%
Intel Core 2 Duo T8100 0%
Intel Core 2 Duo P7450 1%
Intel Pentium Silver N5030 1%
Intel Celeron J4125 1%
Intel Celeron B815 1%
Intel Celeron M P4500 2%
Intel Core i5-470UM 2%
...
Intel Celeron Dual-Core T1400 4147%
Super Pi Mod 1.5 XS 32M - Super Pi mod 1.5 XS 32M *
min: 1430 сред.: 1439 медиана: 1438.5 (6%) макс.: 1447 s
Intel Core i9-11900K -77%
...
Intel Core 2 Duo (Desktop) E6600 -4%
Intel Pentium 977 -3%
Intel Core i3-2365M -1%
AMD A6-7310 -1%
Intel Core 2 Duo P7350 0%
Intel Pentium N4200 1%
Intel Core 2 Duo T7600 1%
Intel Pentium Dual Core T4300 2%
Intel Core 2 Duo T7300 3%
Intel Pentium Dual Core T4400 3%
Intel Core 2 Duo T5870 4%
...
VIA C3-M C3-M-1200 1465%
SiSoft Sandra Dhrystone (MIPS) - SiSoft Sandra Dhrystone (MIPS)
52180 MIPS (25%)
...
Intel Core i7-740QM -9%
Intel Core i7-920XM -8%
Intel Core 2 Extreme (Desktop) QX6700 -6%
Intel Core i5-2520M -5%
Intel Core i5-3427U -5%
Intel Core 2 Extreme (Desktop) QX6850 -4%
Intel Core i5-2430M -2%
Intel Core i5-2410M 2%
Intel Core i5-2450M 2%
Intel Core i5-4310U 3%
Intel Core i5-2540M 3%
...
Intel Xeon E3-1535M v5 231%
SiSoft Sandra Whetstone (MFLOPS) - SiSoft Sandra Whetstone (MFLOPS)
36300 MFLOPS (28%)
...
Intel Core 2 Extreme QX9300 -5%
Intel Core i5-2450M -4%
Intel Core i5-2520M -4%
Intel Core i5-4310U -1%
Intel Core i5-2540M 0%
Intel Core 2 Extreme (Desktop) QX6850 0%
Intel Core i7-2620M 4%
Intel Core i7-840QM 5%
Intel Core 2 Quad (Desktop) Q9550 6%
...
3DMark Vantage - 3DM Vant. Perf. CPU no Physx
min: 9592 сред.: 10038 медиана: 10037.5 (12%) макс.: 10483 Points
...
Intel Core i5-4310U -6%
Intel Core i5-2430M -6%
Intel Core i5-2540M -3%
AMD Ryzen 3 2200U -1%
Intel Core i5-6200U 0%
AMD FX-8800P 1%
AMD A8-7650K 3%
Intel Core i5-6300U 3%
Intel Core 2 Extreme QX9300 3%
Intel Core i7-720QM 4%
...
AMD Ryzen 7 5800X 757%
3DMark 11 - 3DM11 Performance Physics
min: 3823 сред.: 3925 медиана: 3904 (14%) макс.: 4049 Points
...
Intel Core i3-6100H -4%
Intel Core i5-6200U -4%
AMD A10-7700K -2%
Intel Core i5-3360M -1%
Intel Core i3-7130U 0%
Intel Core i7-720QM 0%
Intel Core i7-2620M 1%
AMD A10-7850K 1%
...
AMD Ryzen 9 5950X 550%
3DMark - 3DMark Ice Storm Physics
min: 34097 сред.: 36209 медиана: 36835 (24%) макс.: 37694 Points
Samsung Hummingbird S5PC110 / Exynos 3110 -99%
...
Intel Core i5-6198DU -3%
Intel Core i7-6500U -2%
Intel Core i3-6100H -2%
Intel Core i5-7Y57 -1%
AMD A10-7850K -1%
Intel Core i7-2720QM 0%
Intel Core i5-6300U 2%
...
3DMark - 3DMark Cloud Gate Physics
min: 2959 сред.: 3009 медиана: 3009 (8%) макс.: 3059 Points
...
AMD FX-9830P -2%
AMD A10-7700K -1%
Intel Core i5-7Y57 -1%
Intel Core i5-6198DU -1%
Intel Core i5-3360M 0%
Intel Core i5-6200U 1%
AMD A10-7850K 2%
Intel Core i5-6360U 3%
Intel Core i3-7130U 3%
...
AMD Ryzen 7 5800X 664%
3DMark - 3DMark Fire Strike Standard Physics
min: 4242 сред.: 4324 медиана: 4324 (11%) макс.: 4406 Points
...
Intel Core i5-7Y57 -4%
AMD A10-7700K -2%
Intel Core i5-6198DU -1%
Intel Core i5-L16G7 0%
Intel Core i5-3360M 0%
Intel Core i5-6200U 1%
Intel Core i3-7130U 1%
AMD Ryzen 3 2200U 2%
AMD A10-7850K 2%
...
AMD Ryzen 9 5950X 776%
Geekbench 2 - 32 Bit - Geekbench Stream
min: 4648 сред.: 4650 медиана: 4650 (38%) макс.: 4652 Points
...
AMD PRO A8-9600B -5%
Intel Core i3-6006U 4%
AMD Athlon 300U 4%
...
Intel Core i7-7740X 167%
Geekbench 2 - 32 Bit - Geekbench Memory
min: 4313 сред.: 4319 медиана: 4318.5 (39%) макс.: 4324 Points
...
AMD A8-7650K -4%
Mediatek Helio G70 -3%
AMD A10-7850K -1%
Qualcomm Snapdragon 690 5G 1%
Mediatek Helio P65 1%
AMD Athlon 300U 3%
HiSilicon Kirin 955 5%
...
Intel Core i7-7740X 155%
Geekbench 2 - 32 Bit - Geekbench Floating Point
min: 9161 сред.: 9183 медиана: 9182.5 (18%) макс.: 9204 Points
...
Intel Core i5-6360U -10%
AMD Ryzen 3 2200U -5%
AMD Athlon 300U 1%
Qualcomm Snapdragon 460 1%
Mediatek Helio P65 9%
...
Geekbench 2 - 32 Bit - Geekbench Integer
min: 6890 сред.: 6900 медиана: 6900 (14%) макс.: 6910 Points
...
AMD PRO A12-9800B -6%
AMD A8-7650K 5%
HiSilicon Kirin 820 5%
AMD A10-7700K 6%
AMD Ryzen 3 2200U 6%
...
Geekbench 2 - 32 Bit - Geekbench Total Score
min: 6945 сред.: 6957 медиана: 6957 (18%) макс.: 6969 Points
...
Mediatek Helio G70 -3%
AMD Athlon 300U -1%
Intel Core i5-6198DU 0%
Intel Core i5-6260U 1%
Qualcomm Snapdragon 690 5G 5%
...
- Разброс результатов видеопроцессора
- Средний результат видеопроцессора
* Меньше = лучше
v1.16
log 15. 09:44:17
#0 no ids found in url (should be separated by "_") +0s ... 0s
#1 not redirecting to Ajax server +0s ... 0s
#2 did not recreate cache, as it is less than 5 days old! Created at Sat, 10 Apr 2021 10:58:17 +0200 +0.001s ... 0.001s
#3 no comparison url found in template nbc.compare_page_2 needed +0.007s ... 0.008s
#4 no comparison url found in template nbc.compare_page_2 needed +0s ... 0.008s
#5 composed specs +0s ... 0.008s
#6 did output specs +0s ... 0.008s
#7 getting avg benchmarks for device 3788 +0s ... 0.009s
#8 got single benchmarks 3788 +0.037s ... 0.046s
#9 got avg benchmarks for devices +0s ... 0.046s
#10 min, max, avg, median took s +0.402s ... 0.447s
#11 no comparison url found in template nbc.compare_page_2 needed +0s ... 0.447s
#12 return log +0s ... 0.447s
:: Не найдено обзоров для этого процессора.
Другие процессоры из серии A-Series (Desktop) » AMD A10-6800K 4x 4.1 GHz - 4.4 GHz
» AMD A10-7850K 4x 3.7 GHz - 4 GHz
» AMD A10-7700K 4x 3.4 GHz - 3.8 GHz
» AMD A8-7650K 4x 3.3 GHz - 3.8 GHz
» AMD A8-3850 4x 2.9 GHz
» AMD A6-6400K 2x 3.9 GHz - 4.1 GHz
Похожие процессоры + AMD A10-7850K 4x 3.7 GHz - 4 GHz
+ AMD A10-7700K 4x 3.4 GHz - 3.8 GHz
+ AMD A8-7650K 4x 3.3 GHz - 3.8 GHz
- AMD A8-3850 4x 2.9 GHz
- Intel Core 2 Extreme (Desktop) QX6700 4x 2.67 GHz
- Intel Pentium G4500T 2x 3 GHz
- Intel Celeron J4105 4x 1.5 GHz - 2.5 GHz
Этот важный материал точно понравится твоим друзьям в социальных сетях!
Klaus Hinum (Update: 2013-10- 2)