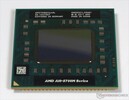
AMD A10-5750M
AMD A10-5750M - четырехъядерный процессор для ноутбуков, основанный на архитектуре Richland. По сравнению с его предшественником A10-4600M, в новом флагмане A-серии повысилась производительность самого процессора и встроенной видеокарты. По сравнению c семейством Trinity, в Richland мало что нового. Новых возможностей нет, производительность на мегагерц все та же. Дизайн чипа по-прежнему основан на архитектуре Bulldozer, состоящей из так называемых модулей. Каждый модуль включает два вычислительных ядра и всего один математический сопроцессор (FPU). Как и Trinity, Richland имеет почти все современные возможности - набор инструкций AVX (включая FMA), аппаратную поддержку AES-шифрования и технологию Turbo Core. Бенчмарк PCMark 7 показывает 10-процентный прирост производительности по сравнению с A10-4600M (5750M: 2175 очков, 4600M: 1965 очков). Поэтому производительность A10-5750M находится примерно на одном уровне с Core i3-2330M (Sandy Bridge). Встроенная видеокарта Radeon HD 8650G оснащена 384 потоковыми процессорами (архитектура VLIW4) и работает на частоте 533-720 МГц (чуть выше, чем HD 7660G). При использовании быстрой двухканальной памяти, производительность должна быть на уровне дискретной HD 7670M. Расчетное энергопотребление процессора составляет 35 Вт, что сравнимо с конкурирующими процессорами среднего класса. Поэтому A10-5750M лучше всего подходит для ноутбуков от 14 дюймов.
Серия AMD A-Series Кодовое имя Richland Серия: A-Series Richland Частота 2500 - 3500 MHz Кэш L2 4 MB Количество ядер 4 / 4 Теплопакет (TDP) 35 Вт Техпроцесс 32 нм Разъём (сокет) FS1r2 Особенности SSE (1, 2, 3, 3S, 4.1, 4.2, 4A), x86-64, AES, AVX, FMA, DDR3-1866 Controller Встроенная графика AMD Radeon HD 8650G (533 - 720 MHz)64 бита + Architecture x86 Дата анонса 12/03/2013
Тесты на производительность Performance Rating - CB R15 + R20 + 7-Zip + X265 + Blender + 3DM11 CPU
19.8 pt (22%)
...
Intel Celeron N6211 -11%
Intel Celeron N4500 -8%
Intel Celeron N4120 -5%
Intel Pentium Silver N5030 -5%
Intel Celeron 6305 -3%
Intel Celeron J4125 -2%
AMD 3020e 3%
Intel Pentium Gold 4415U 4%
Intel Pentium Gold 5405U 6%
Intel Core i5-L16G7 16%
Intel Pentium Silver N6000 20%
...
Cinebench R20 - Cinebench R20 CPU (Single Core)
min: 154 сред.: 162.5 медиана: 162.5 (19%) макс.: 171 Points
...
Intel Celeron J3355 -35%
Qualcomm Snapdragon 7c -30%
Qualcomm Snapdragon 7c Gen 2 -28%
Intel Celeron N4020 0%
Intel Celeron N4120 0%
Intel Celeron J4125 4%
Intel Celeron N6211 7%
Intel Pentium Gold 4415U 12%
AMD A6-9225 12%
Intel Pentium Silver N5030 12%
Intel Celeron N4500 16%
...
Cinebench R20 - Cinebench R20 CPU (Multi Core)
min: 428 сред.: 434.5 медиана: 434.5 (2%) макс.: 441 Points
...
Intel Celeron N4500 -24%
Qualcomm Snapdragon 7c Gen 2 -20%
Intel Pentium Gold 4415U -18%
AMD 3020e -15%
Intel Core m3-6Y30 -15%
Intel Celeron 6305 -4%
Intel Pentium Silver N5030 -2%
Intel Celeron N4120 6%
Intel Celeron J4125 9%
...
Cinebench R15 - Cinebench R15 CPU Multi 64 Bit
min: 198 сред.: 207.2 медиана: 209 (2%) макс.: 212 Points
...
Intel Core m3-6Y30 -7%
AMD 3020e -5%
Intel Core i3-2350M -5%
Intel Core i7-2637M -3%
AMD PRO A8-9600B -2%
AMD Pro A12-8800B 0%
Intel Core i3-3110M 1%
AMD A10-9600P 2%
Intel Core i3-6006U 3%
Intel Core m7-6Y75 3%
Intel Core i3-5015U 3%
Intel Core m5-6Y54 4%
...
0 15 30 45 60 75 90 105 120 135 150 165 180 195 210 Tooltip Pumori Test Platform (A10-5750M): Ø208 (206.6-212.11)
Cinebench R15 - Cinebench R15 CPU Single 64 Bit
min: 72 сред.: 75.5 медиана: 76 (23%) макс.: 78.6 Points
...
AMD A6-9225 -3%
AMD Pro A12-8800B -3%
Intel Celeron J4125 -3%
Intel Celeron N4120 -3%
Intel Celeron N4020 -2%
AMD FX-9800P -2%
AMD A10-9600P -1%
AMD PRO A12-9800B 0%
AMD A9-9425 1%
Intel Celeron N6211 1%
Intel Pentium 3825U 2%
Intel Core i3-2350M 5%
...
Cinebench R11.5 - Cinebench R11.5 CPU Multi 64 Bit
min: 2.19 сред.: 2.3 медиана: 2.3 (3%) макс.: 2.32 Points
...
Intel Core i5-540M -3%
Intel Core i5-2557M -3%
Intel Core i7-2637M -2%
AMD A10-5757M -2%
Intel Core i3-2370M -2%
Intel Core i5-460M -2%
AMD A12-9700P 0%
AMD A12-9700P 0%
Intel Core m5-6Y54 0%
AMD Phenom II X4 N930 0%
Intel Core i5-3317U 0%
Intel Core i5-480M 1%
AMD Pro A10-8700B 1%
AMD A10-8700P 1%
Intel Core i3-5015U 3%
Intel Core i5-3427U 3%
...
Cinebench R11.5 - Cinebench R11.5 CPU Single 64 Bit
min: 0.81 сред.: 0.8 медиана: 0.9 (3%) макс.: 0.88 Points
...
AMD Pro A10-8700B -3%
AMD A10-8700P -2%
AMD PRO A8-9600B -1%
Intel Core i3-2310M -1%
Intel Pentium B970 -1%
Intel Core M-5Y10c 0%
AMD A6-9225 0%
AMD A12-9700P 0%
AMD A12-9700P 0%
Intel Celeron 3865U 2%
Intel Pentium B960 2%
AMD PRO A12-9800B 4%
Intel Celeron J4125 4%
...
Intel Core i7-12650H 3623%
Cinebench R10 - Cinebench R10 Rend. Single (32bit)
min: 2451 сред.: 2549 медиана: 2579 (21%) макс.: 2672 баллов
AMD Ryzen 5 PRO 5650U -100%
...
Intel Pentium Gold 4415Y -1%
Intel Core 2 Duo SP9300 -1%
Intel Core 2 Duo P8400 -1%
AMD A6-9225 -1%
Intel Celeron M P4500 -1%
Intel Core 2 Duo T7700 0%
AMD PRO A12-9800B 2%
AMD FX-8800P 2%
Intel Pentium B940 2%
Intel Core 2 Duo T8300 2%
Intel Core 2 Duo P8600 4%
...
Intel Core i7-1360P 312%
Cinebench R10 - Cinebench R10 Rend. Multi (32bit)
min: 6114 сред.: 6418 медиана: 6451 (7%) макс.: 6633 баллов
AMD Ryzen 5 PRO 5650U -100%
...
Intel Core i7-2657M -3%
Intel Celeron 2970M -3%
Intel Core i5-430M -2%
Intel Core i3-390M 0%
Intel Core m5-6Y57 0%
Intel Celeron N4120 0%
Intel Core i3-2330M 1%
AMD A10-9600P 1%
AMD Phenom II X4 N930 1%
Intel Core i5-2557M 2%
Intel Pentium 3825U 2%
...
Cinebench R10 - Cinebench R10 Rend. Multi (64bit)
min: 8603 сред.: 8977 медиана: 9015 (6%) макс.: 9342 Points
...
Intel Core i5-3317U -4%
Intel Core i7-2637M -4%
Intel Core i7-620M -3%
Intel Core i5-580M -3%
AMD A10-8700P -2%
Intel Core i5-560M -1%
Intel Core i5-3427U -1%
Intel Core i3-3110M 1%
Intel Core i5-2415M 2%
Intel Core i5-2410M 5%
Intel Core i7-640M 6%
...
Cinebench R10 - Cinebench R10 Rend. Single (64bit)
min: 3203 сред.: 3447 медиана: 3483 (19%) макс.: 3617 Points
...
Intel Pentium B960 -3%
Intel Core i5-430M -3%
Intel Pentium B950 -2%
AMD A9-9420 -1%
Intel Core i3-2310M -1%
Intel Core i3-380M 0%
Intel Core i3-2350M 0%
AMD PRO A12-9800B 2%
Intel Core i3-390M 3%
Intel Core i5-2467M 3%
Intel Core i5-450M 3%
Intel Pentium B970 4%
Intel Core i5-2537M 5%
...
wPrime 2.10 - wPrime 2.0 1024m *
min: 780 сред.: 784 медиана: 784 (9%) макс.: 788 s
...
AMD A8-3500M -3%
AMD Phenom II X4 P920 -2%
Intel Core i3-6006U -2%
Intel Core i5-2557M -2%
Intel Atom x7-Z8750 -2%
Intel Core i3-2330M 0%
Intel Core i7-2617M 0%
AMD Phenom II X3 N830 1%
Intel Core i7-940XM 2%
Intel Core 2 Duo T9900 2%
AMD A9-9425 2%
Intel Core i7-720QM 3%
Intel Pentium 3825U 3%
...
VIA C3-M C3-M-1200 979%
wPrime 2.10 - wPrime 2.0 32m *
min: 22.1 сред.: 22.5 медиана: 22.5 (5%) макс.: 22.9 s
...
Intel Core i3-2370M -2%
AMD A6-3410MX -2%
Intel Core i7-640M -2%
Intel Celeron N3450 -1%
AMD A8-3520M 0%
Intel Core i7-620M 0%
Intel Pentium Gold 5405U 0%
Intel Pentium N4200 0%
Intel Core i5-3317U 1%
Intel Core i7-920XM 1%
Intel Pentium N3700 3%
Intel Core i3-3110M 3%
Intel Pentium N3710 3%
...
Transmeta Crusoe TM-5800 2109%
min: 1992 сред.: 2035 медиана: 2035 (12%) макс.: 2078 баллов
Qualcomm Snapdragon 8cx Gen 3 -100%
...
Intel Core i3-6100H -2%
Intel Pentium Gold 4415U -2%
Intel Core i3-5015U 0%
Intel Core i5-7Y57 3%
Intel Core m5-6Y54 4%
Intel Core i3-2350M 5%
...
7-Zip 18.03 - 7-Zip 18.03 Multli Thread 4 runs
min: 7475 сред.: 7608 медиана: 7608 (5%) макс.: 7741 MIPS
...
AMD A10-4600M -9%
AMD Ryzen Embedded R1505G -9%
Intel Core i3-6157U -5%
Intel Pentium Silver N5030 -5%
Intel Celeron J4125 -3%
Qualcomm Snapdragon 7c -2%
Intel Core i5-L16G7 0%
Qualcomm Snapdragon 7c Gen 2 1%
Intel Core i3-10100Y 9%
Intel Core i3-1110G4 15%
...
7-Zip 18.03 - 7-Zip 18.03 Single Thread 4 runs
min: 2948 сред.: 2956 медиана: 2955.5 (35%) макс.: 2963 MIPS
...
Intel Celeron N6211 -12%
AMD 3020e -12%
Intel Pentium Silver N5030 -11%
AMD A10-4600M -9%
Intel Core i3-6157U -6%
Intel Pentium Silver N6000 -4%
Intel Celeron N4500 -3%
AMD Athlon Gold 3150U 4%
Intel Core i5-L16G7 9%
AMD Ryzen 3 3300U 13%
...
X264 HD Benchmark 4.0 - x264 Pass 2
min: 15 сред.: 15.1 медиана: 15 (5%) макс.: 15.37 fps
AMD Athlon Neo MV-40 -87%
...
Intel Core i7-8500Y -7%
Intel Core i3-6006U -7%
Intel Core i5-2410M -5%
Intel Core i5-2450M -3%
Intel Core i5-2430M -3%
Intel Core i5-3427U -1%
AMD A10-8700P 0%
Intel Core m7-6Y75 1%
Intel Core m3-7Y30 3%
...
X264 HD Benchmark 4.0 - x264 Pass 1
min: 75.5 сред.: 77.6 медиана: 76 (18%) макс.: 81.2 fps
...
Intel Core i3-6006U -4%
AMD Pro A12-8800B -2%
Intel Core i5-2410M -2%
Intel Core i5-2430M -1%
AMD A10-9620P -1%
AMD PRO A12-9800B -1%
Intel Core i5-2450M 1%
Intel Core i3-7020U 3%
Intel Core i5-3427U 4%
...
HWBOT x265 Benchmark v2.2 - HWBOT x265 4k Preset
min: 1.26 сред.: 1.7 медиана: 1.7 (4%) макс.: 2.08 fps
...
Intel Pentium Gold 5405U -18%
Intel Celeron J4125 -13%
Intel Core i5-L16G7 -13%
Qualcomm Snapdragon 8cx Gen 3 -10%
Intel Pentium Gold 4415U -7%
Intel Pentium Silver N6000 0%
Intel Core i7-6770HQ 2%
Intel Celeron 6305 2%
AMD Athlon 300U 6%
Intel Core i5-8260U 8%
Intel Core i3-6157U 16%
...
0 0.1 0.3 0.4 0.6 0.7 0.8 1 1.1 1.3 1.4 1.6 1.7 1.8 2 2.1 2.3 2.4 2.5 2.7 Tooltip Pumori Test Platform (A10-5750M): Ø1.486 (0.28-2.78)
Pumori Test Platform (A10-5750M): Ø1.679 (0.3-2.82)
TrueCrypt - TrueCrypt Serpent
min: 0.164 сред.: 0.2 медиана: 0.2 (0%) макс.: 0.171 GB/s
Intel Pentium Gold 4415Y -94%
...
Intel Core m7-6Y75 -3%
Intel Core i5-3360M -1%
AMD A6-7310 -1%
Intel Core i5-6260U 0%
AMD Pro A8-8600B 0%
Intel Core i5-6198DU 1%
Intel Core i3-7130U 2%
Intel Core i5-6200U 2%
Intel Core i3-6100H 3%
...
TrueCrypt - TrueCrypt Twofish
min: 0.297 сред.: 0.3 медиана: 0.3 (0%) макс.: 0.306 GB/s
Intel Pentium Gold 4415Y -94%
...
Intel Core i7-3520M -4%
AMD Athlon 300U -4%
Intel Core i5-6198DU -4%
Intel Core i3-7130U -4%
Intel Core i3-6100H -4%
Intel Core i5-6200U -4%
AMD A10-8700P -2%
Intel Core i5-6360U 0%
Intel Core i5-6300U 2%
AMD PRO A8-9600B 2%
Intel Core i5-7Y57 3%
...
TrueCrypt - TrueCrypt AES
1.5 GB/s (0%)
...
Intel Core i5-2430M -7%
Intel Pentium Gold 4415U -7%
Intel Pentium N4200 -7%
AMD A10-8700P -1%
Intel Core i5-3360M 3%
AMD Pro A12-8800B 3%
Intel Core m7-6Y75 5%
Intel Core i5-4310U 7%
...
Blender - Blender 2.79 BMW27 CPU *
2754 Seconds (19%)
...
Intel Pentium Silver N6000 -22%
Intel Pentium Gold 5405U -21%
Intel Pentium Gold 4415U -21%
Intel Celeron J4125 -9%
Intel Celeron N4120 -7%
Intel Celeron 6305 3%
AMD 3020e 8%
AMD A10-4600M 9%
Intel Celeron 2970M 23%
Intel Pentium Silver N5030 25%
Qualcomm Snapdragon 7c Gen 2 31%
...
R Benchmark 2.5 - R Benchmark 2.5 *
1.5 sec (33%)
...
Intel Core i5-8260U -17%
Intel Core m3-6Y30 -16%
Intel Celeron N6211 -10%
Intel Celeron 6305 -8%
Intel Pentium Silver N5030 -6%
Intel Celeron N4020 -1%
Intel Celeron J4125 2%
AMD 3020e 4%
AMD A10-4600M 7%
Intel Celeron N4120 8%
...
3DMark 06 - CPU - 3DMark 06 - CPU
min: 2464 сред.: 3070 медиана: 3238 (7%) макс.: 3273 Points
...
AMD A10-8700P -3%
AMD A10-5757M -3%
Intel Core i5-3427U -2%
Intel Core i7-620M -2%
AMD Phenom II X4 N970 -1%
Intel Core i7-8500Y 0%
Intel Core i7-720QM 1%
Intel Core i5-560M 1%
Intel Core i5-580M 3%
Intel Core i5-2410M 4%
...
Super Pi mod 1.5 XS 1M - Super Pi mod 1.5 XS 1M *
min: 27.97 сред.: 28.5 медиана: 28.1 (6%) макс.: 29.67 s
AMD Ryzen 7 PRO 6850H -97%
...
Intel Core 2 Duo T6570 -3%
AMD A6-7310 -3%
AMD Phenom II X2 N620 -3%
AMD E2-9010 -2%
Intel Core Duo T2600 -2%
Intel Core 2 Duo T5750 -2%
Intel Core 2 Duo T5800 0%
Intel Celeron Dual-Core T3300 0%
Intel Core 2 Duo T6400 1%
Intel Celeron M 575 2%
Intel Core 2 Duo T7250 4%
Intel Core i3-2357M 4%
...
VIA C3-M C3-M-1200 1527%
Super Pi mod 1.5 XS 2M - Super Pi mod 1.5 XS 2M *
min: 63.6 сред.: 65 медиана: 63.9 (3%) макс.: 68.8 s
Intel Core i7-11390H -78%
...
AMD A6-7310 -2%
Intel Core 2 Duo T7200 -2%
Intel Core 2 Duo T5870 -2%
Intel Core 2 Duo T6400 -2%
AMD Phenom II X2 N620 0%
Intel Core 2 Duo T5850 2%
Intel Core i3-2357M 2%
Intel Core 2 Duo T6570 2%
Intel Pentium 967 3%
Intel Celeron N3450 4%
...
Intel Celeron Dual-Core T1400 3500%
Super Pi Mod 1.5 XS 32M - Super Pi mod 1.5 XS 32M *
min: 1651 сред.: 1693 медиана: 1666.5 (7%) макс.: 1788 s
...
Intel Core 2 Duo T7100 -5%
Intel Core m3-6Y30 -4%
Intel Core Duo T2600 -4%
Intel Pentium N3710 -2%
AMD A6 Pro-7050B -1%
AMD Turion II N530 0%
Intel Core i3-380UM 2%
Intel Atom x7-Z8750 2%
Intel Core Duo T2500 4%
AMD A4-3310MX 4%
...
VIA C3-M C3-M-1200 1230%
SiSoft Sandra Dhrystone (MIPS) - SiSoft Sandra Dhrystone (MIPS)
min: 32320 сред.: 33980 медиана: 33980 (16%) макс.: 35640 MIPS
...
AMD Phenom II X4 N970 -5%
Intel Core i3-370M -5%
Intel Core 2 Extreme X9100 -4%
Intel Core i5-450M -4%
Intel Core i5-2467M -2%
AMD A10-5757M -2%
AMD A10-4600M -1%
Intel Core i5-520M 2%
Intel Core i5-540M 3%
Intel Core i3-2330M 3%
Intel Core i3-2370M 4%
Intel Core 2 Quad Q9000 8%
Intel Core i5-480M 12%
Intel Core i5-460M 13%
...
Intel Xeon E3-1535M v5 408%
SiSoft Sandra Whetstone (MFLOPS) - SiSoft Sandra Whetstone (MFLOPS)
min: 24800 сред.: 24955 медиана: 24955 (19%) макс.: 25110 MFLOPS
...
Intel Core i5-2537M -6%
Intel Core i5-430M -5%
Intel Core i3-2330M -3%
AMD Phenom II X4 N950 -3%
Intel Core 2 Extreme X9100 -2%
Intel Core i7-620LM -1%
AMD Phenom II X4 N970 2%
Intel Core i3-370M 2%
Intel Core i3-2370M 3%
Intel Core i7-2657M 4%
Intel Core i3-380M 5%
Intel Core 2 Quad Q9000 8%
Intel Core i3-390M 10%
Intel Core i5-540M 10%
...
3DMark Vantage - 3DM Vant. Perf. CPU no Physx
min: 5544 сред.: 7097 медиана: 7250 (7%) макс.: 7803 Points
...
AMD Phenom II X4 N930 -5%
Intel Core 2 Quad Q9100 -4%
Intel Core i3-370M -3%
Intel Core i7-2677M -3%
Intel Core m3-6Y30 -3%
Intel Core i3-2330M -1%
Intel Pentium 3825U -1%
Intel Core i5-430M 1%
Intel Core i7-2617M 2%
Intel Core i3-380M 2%
Intel Core 2 Quad Q9000 2%
AMD Phenom II X4 N970 3%
Intel Core i3-2350M 3%
Intel Celeron J4125 3%
Intel Core i5-2557M 5%
...
3DMark 11 - 3DM11 Performance Physics
min: 1445 сред.: 2482 медиана: 2658 (7%) макс.: 2790 Points
...
AMD A6-3410MX -4%
AMD Pro A12-8800B -4%
Intel Pentium Silver N5030 -4%
AMD FX-9800P -4%
AMD A10-9620P -3%
AMD A10-9600P -3%
Intel Pentium 3825U -2%
AMD A12-9700P 2%
AMD A12-9700P 2%
Intel Core m5-6Y54 2%
AMD A10-4600M 4%
Intel Core i5-460M 4%
...
3DMark - 3DMark Ice Storm Physics
min: 13311 сред.: 23944 медиана: 25232 (16%) макс.: 28306 Points
...
AMD A10-9620P -6%
Intel Core i3-6100U -6%
AMD A10-4600M -5%
AMD A10-9600P -3%
Intel Core i5-3317U -2%
Intel Pentium Silver N5030 -1%
Intel Core m3-6Y30 1%
Intel Core i3-3110M 1%
Intel Core m5-6Y57 2%
AMD Pro A12-8800B 2%
AMD 3020e 3%
...
3DMark - 3DMark Ice Storm Extreme Physics
24996 Points (21%)
...
AMD Pro A12-8800B -5%
AMD A10-9620P -4%
Intel Core m3-6Y30 -3%
Intel Core m5-6Y57 -3%
AMD 3020e -2%
AMD A12-9720P -1%
AMD A12-9700P 3%
AMD A12-9700P 3%
AMD PRO A12-9800B 4%
Intel Core i5-L16G7 7%
...
3DMark - 3DMark Ice Storm Unlimited Physics
29277 Points (25%)
...
AMD Ryzen 5 3450U -5%
Intel Core i3-6006U -4%
Intel Core M-5Y10c -3%
Qualcomm Snapdragon 7c -2%
Intel Core i7-2637M -1%
Intel Core m5-6Y54 0%
Intel Core m7-6Y75 7%
Intel Pentium Silver N5030 7%
...
3DMark - 3DMark Cloud Gate Physics
min: 1008 сред.: 1952 медиана: 2070 (5%) макс.: 2326 Points
...
AMD Pro A10-8700B -4%
AMD A10-4600M -4%
AMD A10-8700P -3%
AMD A4-7210 -2%
AMD Pro A12-8800B -2%
AMD A10-9600P 2%
Intel Core m5-6Y54 4%
AMD PRO A12-9800B 4%
...
3DMark - 3DMark Fire Strike Standard Physics
min: 1488 сред.: 2785 медиана: 2946 (5%) макс.: 3230 Points
...
Intel Core i5-3427U -7%
Intel Pentium N4200 -6%
AMD Pro A12-8800B -5%
AMD A10-8700P -4%
Intel Core m5-6Y57 1%
Intel Core i5-3317U 2%
AMD A10-9600P 5%
Intel Core m3-6Y30 6%
...
Geekbench 5.4 - Geekbench 5.1 - 5.4 64 Bit Single-Core
493 баллов (21%)
...
Intel Celeron N4120 -10%
AMD A10-4600M -10%
Intel Celeron J4125 -8%
AMD 3015e -6%
Intel Celeron 5205U -3%
Intel Pentium Silver N5030 0%
Intel Celeron N4500 1%
Intel Core i7-2675QM 9%
Intel Celeron N6211 13%
AMD 3015Ce 14%
Intel Pentium Gold 5405U 19%
Intel Pentium Gold 6405U 21%
Intel Pentium Gold 4415U 22%
...
Apple M2 Max 300%
Geekbench 5.4 - Geekbench 5.1 - 5.4 64 Bit Multi-Core
1326 баллов (5%)
...
AMD A10-4600M -12%
AMD 3020e -10%
Intel Celeron 6305 -10%
Intel Pentium Silver N5030 -5%
AMD Ryzen 3 2200U -4%
Intel Pentium Gold 6405U 0%
Intel Pentium Gold 5405U 0%
Intel Core i3-L13G4 2%
AMD Ryzen Embedded R1505G 2%
Intel Pentium Gold 4415U 4%
Intel Celeron J4125 6%
AMD Athlon Silver 3050U 8%
...
Apple M2 Max 1058%
Geekbench 5.0 - Geekbench 5.0 64 Bit Single-Core
495 баллов (2%)
...
Intel Pentium Silver N5030 -28%
AMD A10-4600M -24%
Intel Celeron N4120 -12%
Intel Celeron J4125 -7%
Intel Core i5-8260U 12%
Intel Celeron N6211 13%
Intel Pentium Gold 5405U 19%
AMD Ryzen Embedded R1505G 24%
Intel Celeron 6305 27%
AMD 3020e 31%
Qualcomm Snapdragon 8cx Gen 3 34%
...
Geekbench 5.0 - Geekbench 5.0 64 Bit Multi-Core
1320 баллов (4%)
...
Qualcomm Snapdragon 7c -36%
Intel Celeron N6211 -35%
AMD A10-4600M -17%
Intel Pentium Silver N5030 -11%
Intel Celeron 6305 -10%
AMD 3020e -9%
Intel Pentium Gold 5405U 0%
AMD Ryzen Embedded R1505G 4%
Intel Core i5-8260U 11%
Intel Celeron J4125 14%
Intel Celeron N4120 14%
Intel Core i7-8500Y 14%
Intel Core i3-6157U 14%
...
Geekbench 4.1 - 4.4 - Geekbench 4.1 - 4.4 64 Bit Single-Core
2260 баллов (23%)
...
Intel Celeron N4020 -11%
Intel Core i3-2350M -6%
AMD PRO A8-9600B -5%
Intel Pentium Gold 4425Y -4%
Intel Pentium Silver N5030 -4%
Intel Celeron 3865U -1%
AMD A9-9425 -1%
Intel Celeron 3867U 1%
Qualcomm Snapdragon 8cx Gen 2 5G 4%
Intel Celeron 2970M 11%
Intel Celeron N6211 14%
Intel Core i3-6006U 15%
Intel Core i7-6770HQ 17%
AMD Ryzen Embedded R1505G 18%
...
Intel Core i9-13900HX 294%
Geekbench 4.1 - 4.4 - Geekbench 4.1 - 4.4 64 Bit Multi-Core
5292 баллов (6%)
...
Intel Celeron 6305 -6%
Intel Core i3-6006U -5%
Intel Core i7-2637M -5%
Intel Core i7-6770HQ -4%
Intel Core m3-6Y30 -4%
Intel Pentium Gold 5405U 2%
AMD Ryzen Embedded R1505G 4%
Intel Celeron N4120 6%
Intel Celeron J4125 6%
Intel Pentium Gold 4415U 6%
Intel Pentium Silver N5030 7%
Intel Core i3-7100U 11%
...
Intel Core i9-13900HX 1244%
Geekbench 4.0 - Geekbench 4.0 64 Bit Single-Core
2175 баллов (34%)
...
AMD A6-9225 -12%
AMD PRO A8-9600B -8%
AMD A10-9600P -6%
AMD PRO A12-9800B -5%
AMD A9-9410 -2%
AMD A12-9700P -1%
AMD A12-9700P -1%
Intel Celeron 3865U 0%
Intel Celeron 2970M 8%
Intel Core i3-6006U 16%
Intel Core i7-2637M 24%
Intel Core m3-6Y30 27%
Intel Pentium Gold 4415U 29%
Intel Core i3-6100U 32%
Intel Core i3-7100U 35%
...
Geekbench 4.0 - Geekbench 4.0 64 Bit Multi-Core
4963 баллов (12%)
...
Intel Celeron N3450 -20%
Intel Pentium N4200 -12%
AMD PRO A8-9600B -12%
AMD PRO A12-9800B -10%
AMD A10-9600P -5%
Intel Core i7-2637M -3%
Intel Core i3-6006U -3%
AMD A12-9700P -1%
AMD A12-9700P -1%
Intel Core m3-6Y30 4%
Intel Core i3-6100U 7%
Intel Pentium Gold 4415U 10%
Intel Core i3-7100U 14%
AMD Athlon 300U 16%
...
Geekbench 3 - Geekbench 3 32 Bit Multi-Core
min: 4776 сред.: 4787 медиана: 4787 (8%) макс.: 4798 баллов
...
Intel Core m3-6Y30 -6%
Intel Core i7-2637M -5%
Intel Pentium N4200 -4%
AMD A10-8700P -2%
AMD Pro A12-8800B -2%
AMD PRO A8-9600B 0%
Intel Core i3-7020U 1%
Intel Core i3-6100U 1%
Intel Core i3-6100H 2%
Intel Core m3-7Y30 5%
...
Geekbench 3 - Geekbench 3 32 Bit Single-Core
min: 1800 сред.: 1816 медиана: 1816 (35%) макс.: 1832 баллов
...
AMD A6-9220 -1%
Intel Celeron 3865U 1%
AMD A6-9225 2%
AMD Pro A8-8600B 2%
AMD PRO A8-9600B 8%
...
Intel Core i5-1230U 182%
Geekbench 2 - 32 Bit - Geekbench Stream
min: 3865 сред.: 4282 медиана: 4281.5 (35%) макс.: 4698 Points
AMD Athlon Neo MV-40 -73%
...
AMD A6-9225 -9%
AMD A9-9425 -3%
Intel Pentium 3825U -3%
AMD A8-4500M -2%
AMD PRO A8-9600B 4%
...
Intel Xeon E3-1535M v5 160%
Geekbench 2 - 32 Bit - Geekbench Memory
min: 3251 сред.: 3354 медиана: 3354 (30%) макс.: 3457 Points
...
AMD PRO A12-9800B -11%
AMD A9-9425 -8%
AMD A8-4500M -7%
AMD A10-4600M -7%
AMD Pro A8-8600B -6%
AMD PRO A8-9600B 1%
AMD A9-9410 3%
...
Geekbench 2 - 32 Bit - Geekbench Floating Point
min: 4907 сред.: 4926 медиана: 4925.5 (10%) макс.: 4944 Points
...
AMD E2-7110 -6%
AMD A9-9410 -2%
Intel Pentium Gold 5405U -2%
Intel Core 2 Duo P8600 0%
Intel Core i3-6100U 3%
Intel Pentium Gold 4415U 4%
AMD A9-9425 5%
Intel Core i5-3317U 7%
...
Geekbench 2 - 32 Bit - Geekbench Integer
min: 5469 сред.: 5484 медиана: 5483.5 (11%) макс.: 5498 Points
AMD Athlon Neo MV-40 -79%
...
Intel Pentium Gold 4415U -7%
Intel Core i3-6100U -7%
Intel Core i5-3427U -5%
Intel Core m5-6Y54 0%
AMD PRO A8-9600B 3%
...
Geekbench 2 - 32 Bit - Geekbench Total Score
min: 4691 сред.: 4742 медиана: 4741.5 (12%) макс.: 4792 Points
...
Intel Core i3-6006U -5%
AMD A9-9425 -5%
AMD Pro A8-8600B 0%
AMD A10-4600M 0%
Intel Core i5-3317U 7%
Intel Core i3-6100U 7%
Intel Pentium Gold 5405U 7%
AMD PRO A8-9600B 8%
...
Mozilla Kraken 1.1 - Kraken 1.1 Total Score *
2402 ms (3%)
...
Intel Celeron J4125 -6%
AMD A10-9600P -6%
Intel Core i3-6100U -4%
Intel Celeron N4120 -4%
Intel Pentium 3825U -3%
Intel Pentium Silver N5030 0%
AMD A6-9220 1%
AMD A12-9720P 1%
Intel Celeron 3865U 2%
AMD A9-9425 3%
...
WebXPRT 3 - WebXPRT 3 Score
80.1 Points (20%)
...
Intel Celeron N4500 -40%
AMD A6-9220e -20%
AMD A9-9425 -5%
Intel Celeron N4020 0%
AMD A6-9225 1%
Qualcomm Snapdragon 7c 4%
Intel Celeron J4125 11%
Intel Celeron N6211 11%
Intel Celeron N4120 13%
...
Apple M2 Max 408%
- Разброс результатов видеопроцессора
- Средний результат видеопроцессора
* Меньше = лучше
v1.22
log 06. 18:34:28
#0 no ids found in url (should be separated by "_") +0s ... 0s
#1 not redirecting to Ajax server +0s ... 0s
#2 did not recreate cache, as it is less than 5 days old! Created at Sat, 04 Feb 2023 08:57:17 +0100 +0.001s ... 0.001s
#3 no comparison url found in template nbc.compare_page_2 needed +0.006s ... 0.008s
#4 no comparison url found in template nbc.compare_page_2 needed +0s ... 0.008s
#5 no comparison url found in template nbc.compare_page_2 needed +0s ... 0.008s
#6 no comparison url found in template nbc.compare_page_2 needed +0s ... 0.009s
#7 no comparison url found in template nbc.compare_page_2 needed +0s ... 0.009s
#8 no comparison url found in template nbc.compare_page_2 needed +0s ... 0.009s
#9 no comparison url found in template nbc.compare_page_2 needed +0s ... 0.009s
#10 no comparison url found in template nbc.compare_page_2 needed +0s ... 0.01s
#11 no comparison url found in template nbc.compare_page_2 needed +0s ... 0.01s
#12 no comparison url found in template nbc.compare_page_2 needed +0s ... 0.01s
#13 composed specs +0s ... 0.01s
#14 did output specs +0s ... 0.01s
#15 getting avg benchmarks for device 4154 +0.012s ... 0.022s
#16 got single benchmarks 4154 +0.027s ... 0.049s
#17 got avg benchmarks for devices +0s ... 0.049s
#18 min, max, avg, median took s +0.606s ... 0.654s
#19 no comparison url found in template nbc.compare_page_2 needed +0s ... 0.655s
#20 return log +0s ... 0.655s
Обзоры электроники с AMD A10-5750M :
Обзор ноутбука Lenovo G505s-20255 Растраченный потенциал. Доступный по цене мультимедиа-ноутбук с четырехъядерным процессором, 16 ГБ оперативной памяти и Crossfire-графикой - да быть такого не м...
AMD A10-5750M | AMD Radeon HD 8650G + HD 8570M Dual Graphics | 15.60" | 2.5 килогр.
Краткий обзор ноутбука MSI GX70H-A108972811B Не процессор, а сплошные проблемы. Может ли производительность мощной видеокарты упасть из-за слабого процессора? Многим геймерам, посматривающим на MSI GX70, п...
AMD A10-5750M | AMD Radeon HD 8970M | 17.30" | 3.7 килогр.
MSI GX70 3CC-222XPL : AMD Radeon R9 M290X, 17.30", 3.9 kg
Обзор со стороннего сайта » MSI GX70 3CC-222XPL
MSI GX60-3CC87FD : AMD Radeon R9 M290X, 15.60", 3.5 kg
Обзор со стороннего сайта » MSI GX60-3CC87FD
HP Envy 15z : AMD Radeon HD 8650G, 15.60", 2.5 kg
Обзор со стороннего сайта » HP Envy 15z
HP Pavilion 17-e054sg : AMD Radeon HD 8650G + HD 8670M Dual Graphics, 17.30", 2.9 kg
Обзор со стороннего сайта » HP Pavilion 17-e054sg
Lenovo G505s-20255 : AMD Radeon HD 8650G + HD 8570M Dual Graphics, 15.60", 2.5 kg
Обзор со стороннего сайта » Lenovo G505s-20255
MSI GX70-3BE-007US : AMD Radeon HD 8970M, 17.30", 3.9 kg
Обзор со стороннего сайта » MSI GX70-3BE-007US
HP Envy 15-J012LA : AMD Radeon HD 8730M, 15.60", 2.1 kg
Обзор со стороннего сайта » HP Envy 15-J012LA
MSI GX70H-A108972811B : AMD Radeon HD 8970M, 17.30", 3.7 kg
Обзор со стороннего сайта » MSI GX70H-A108972811B
Этот важный материал точно понравится твоим друзьям в социальных сетях!
.170
Другие процессоры из серии A-Series » AMD A10-5757M 4x 2.5 GHz - 3.5 GHz
» AMD A10-4600M 4x 2.3 GHz - 3.2 GHz
» AMD A8-7410 4x 2.2 GHz - 2.5 GHz
» AMD A8-3550MX 4x 2 GHz - 2.7 GHz
» AMD A6-7310 4x 2 GHz - 2.4 GHz
» AMD A8-3530MX 4x 1.9 GHz - 2.6 GHz
» AMD A8-3510MX 4x 1.8 GHz - 2.5 GHz
» AMD A4-7210 4x 1.8 GHz - 2.2 GHz
» AMD A6-3430MX 4x 1.7 GHz - 2.4 GHz
» AMD A8-3520M 4x 1.6 GHz - 2.5 GHz
» AMD A10-4655M 4x 2 GHz - 2.8 GHz
» AMD A8-4500M 4x 1.9 GHz - 2.8 GHz
» AMD A6-3410MX 4x 1.6 GHz - 2.3 GHz
» AMD A8-3500M 4x 1.5 GHz - 2.4 GHz
» AMD A6-3420M 4x 1.5 GHz - 2.4 GHz
» AMD A6-3400M 4x 1.4 GHz - 2.3 GHz
» AMD A4-3330MX 2x 2.2 GHz - 2.6 GHz
» AMD A6-4400M 2x 2.7 GHz - 3.2 GHz
» AMD A4-6210 4x 1.8 GHz
» AMD A4-5050 4x 1.55 GHz
» AMD A4-3310MX 2x 2.1 GHz - 2.5 GHz
» AMD A4-3320M 2x 2 GHz - 2.6 GHz
» AMD A4-3300M 2x 1.9 GHz - 2.5 GHz
» AMD A4-3305M 2x 1.9 GHz - 2.5 GHz
» AMD A4 Micro-6400T 4x 1 GHz - 1.6 GHz
» AMD A6-4455M 2x 2.1 GHz - 2.6 GHz
Процессоры, близкие по произв-ти + Intel Core 2 Duo T9550 2x 2.66 GHz
+ Intel Celeron J4125 4x 2 GHz - 2.7 GHz
+ Intel Core 2 Duo T9500 2x 2.6 GHz
+ Intel Core i5-430M 2x 2.26 GHz - 2.53 GHz
- AMD A10-5757M 4x 2.5 GHz - 3.5 GHz
- Intel Core i7-2637M 2x 1.7 GHz - 2.8 GHz
- AMD Phenom II X2 X640 BE 2x 3.2 GHz
- AMD Phenom II X4 X940 BE 4x 2.4 GHz
Klaus Hinum (Update: 2013-10- 2)