Краткий обзор ноутбука Dell XPS 13 9310 - Нужна ли старшая конфигурация с Core i7-1185G7?

Это сокращенная версия обзора, которая содержит только результаты тестов и вердикт. Полный обзор на английском языке вы найдете здесь.
Соперники
Рейтинг | Дата | Модель | Вес | Height | Размер | Разрешение | Цена |
|---|---|---|---|---|---|---|---|
| 87.4 % v7 (old) | December 2020 | Dell XPS 13 9310 Core i7 4K i7-1185G7, Iris Xe G7 96EUs | 1.3 килог. | 14.8 мм | 13.40" | 3840x2400 | |
| 85.1 % v7 (old) | October 2020 | Asus Zenbook S UX393JA i7-1065G7, Iris Plus Graphics G7 (Ice Lake 64 EU) | 1.4 килог. | 15.7 мм | 13.90" | 3300x2200 | |
| 87.4 % v7 (old) | June 2020 | Huawei MateBook X Pro 2020 i7 i7-10510U, GeForce MX250 | 1.3 килог. | 14.6 мм | 13.90" | 3000x2000 | |
| 88.9 % v7 (old) | March 2020 | Dell XPS 13 9300 Core i7-1065G7 i7-1065G7, Iris Plus Graphics G7 (Ice Lake 64 EU) | 1.2 килог. | 14.8 мм | 13.40" | 1920x1200 | |
| 85.3 % v7 (old) | August 2020 | Lenovo Yoga Slim 7-14ARE R7 4800U, Vega 8 | 1.4 килог. | 14.9 мм | 14.00" | 1920x1080 | |
| 88.4 % v7 (old) | January 2020 | HP Spectre x360 13-aw0013dx i7-1065G7, Iris Plus Graphics G7 (Ice Lake 64 EU) | 1.2 килог. | 16.9 мм | 13.30" | 1920x1080 |
| SD Card Reader | |
| average JPG Copy Test (av. of 3 runs) | |
| Dell XPS 13 9310 Core i7 4K (Toshiba Exceria Pro M501 32 GB UHS-II) | |
| HP Spectre x360 13-aw0013dx (Toshiba Exceria Pro M501 microSDXC 64GB) | |
| Dell XPS 13 9300 Core i7-1065G7 (Toshiba Exceria Pro M501 64 GB UHS-II) | |
| Asus Zenbook S UX393JA (Toshiba Exceria Pro M501 64 GB UHS-II) | |
| Lenovo Yoga Slim 7-14ARE (Toshiba Exceria Pro M501 64 GB UHS-II) | |
| maximum AS SSD Seq Read Test (1GB) | |
| Dell XPS 13 9310 Core i7 4K (Toshiba Exceria Pro M501 32 GB UHS-II) | |
| Dell XPS 13 9300 Core i7-1065G7 (Toshiba Exceria Pro M501 64 GB UHS-II) | |
| HP Spectre x360 13-aw0013dx (Toshiba Exceria Pro M501 microSDXC 64GB) | |
| Lenovo Yoga Slim 7-14ARE (Toshiba Exceria Pro M501 64 GB UHS-II) | |
| Asus Zenbook S UX393JA (Toshiba Exceria Pro M501 64 GB UHS-II) | |


| |||||||||||||||||||||||||
Равномерность подсветки: 84 %
От батареи: 508.7 cd/m²
Контрастность: 1696:1 (Уровень чёрного: 0.3 cd/m²)
ΔE ColorChecker Calman: 2.72 | ∀{0.5-29.43 Ø4.71}
calibrated: 1.92
ΔE Greyscale Calman: 3.4 | ∀{0.09-98 Ø4.96}
100% sRGB (Argyll 1.6.3 3D)
70.7% AdobeRGB 1998 (Argyll 1.6.3 3D)
78.9% AdobeRGB 1998 (Argyll 3D)
100% sRGB (Argyll 3D)
80.2% Display P3 (Argyll 3D)
Gamma: 2.11
CCT: 6245 K
| Dell XPS 13 9310 Core i7 4K Sharp LQ134R1, IPS, 13.4", 3840x2400 | Asus Zenbook S UX393JA AU Optronics B139KAN01.0, IPS, 13.9", 3300x2200 | Huawei MateBook X Pro 2020 i7 JDI LPM139M422A, LTPS, 13.9", 3000x2000 | Dell XPS 13 9300 Core i7-1065G7 Sharp LQ134N1, IPS, 13.4", 1920x1200 | Lenovo Yoga Slim 7-14ARE AU Optronics B140HAN06.8, IPS, 14", 1920x1080 | HP Spectre x360 13-aw0013dx AU Optronics AUO5E2D, IPS, 13.3", 1920x1080 | |
|---|---|---|---|---|---|---|
| Display | 11% | -10% | -11% | -7% | -8% | |
| Display P3 Coverage (%) | 80.2 | 97.7 22% | 66.6 -17% | 66.3 -17% | 71.7 -11% | 69.6 -13% |
| sRGB Coverage (%) | 100 | 99.8 0% | 99.4 -1% | 97.3 -3% | 99.3 -1% | 98.9 -1% |
| AdobeRGB 1998 Coverage (%) | 78.9 | 87.9 11% | 68.6 -13% | 68.5 -13% | 72.9 -8% | 71.5 -9% |
| Response Times | 5% | 20% | 17% | 25% | 3% | |
| Response Time Grey 50% / Grey 80% * (ms) | 59.2 ? | 56.4 ? 5% | 49.6 ? 16% | 50 ? 16% | 45.6 ? 23% | 60.8 ? -3% |
| Response Time Black / White * (ms) | 40.4 ? | 38.8 ? 4% | 30.8 ? 24% | 33.2 ? 18% | 29.6 ? 27% | 36.8 ? 9% |
| PWM Frequency (Hz) | 2137 ? | 29070 ? | 2500 ? | |||
| Параметры экрана | -15% | 18% | -11% | -17% | -23% | |
| Яркость в центре (cd/m²) | 508.7 | 444.1 -13% | 557 9% | 607.6 19% | 399.6 -21% | 447.4 -12% |
| Brightness (cd/m²) | 479 | 423 -12% | 532 11% | 595 24% | 385 -20% | 420 -12% |
| Brightness Distribution (%) | 84 | 89 6% | 87 4% | 96 14% | 89 6% | 85 1% |
| Уровень чёрного * (cd/m²) | 0.3 | 0.37 -23% | 0.33 -10% | 0.4 -33% | 0.37 -23% | 0.31 -3% |
| Контрастность (:1) | 1696 | 1200 -29% | 1688 0% | 1519 -10% | 1080 -36% | 1443 -15% |
| Colorchecker Delta E * | 2.72 | 2.94 -8% | 1.4 49% | 3.23 -19% | 3.2 -18% | 4.23 -56% |
| Colorchecker dE 2000 max. * | 4.7 | 7.37 -57% | 2.5 47% | 8.67 -84% | 6.44 -37% | 9.34 -99% |
| Colorchecker dE 2000 calibrated * | 1.92 | 3.05 -59% | 0.7 64% | 1.01 47% | 1.73 10% | 1.32 31% |
| Delta E для серого * | 3.4 | 2.9 15% | 2 41% | 5.5 -62% | 4.7 -38% | 6.1 -79% |
| Гамма | 2.11 104% | 2.1 105% | 2.14 103% | 2.12 104% | 2.21 100% | 2.11 104% |
| CCT | 6245 104% | 6766 96% | 6689 97% | 6413 101% | 7184 90% | 6136 106% |
| Покрытие спектра AdobeRGB, % (%) | 70.7 | 78.2 11% | 62.5 -12% | 63 -11% | 66.3 -6% | 64.8 -8% |
| Color Space (Percent of sRGB) (%) | 100 | 99.8 0% | 99.5 0% | 97.5 -2% | 99.5 0% | 98.9 -1% |
| Среднее значение | 0% /
-8% | 9% /
13% | -2% /
-7% | 0% /
-10% | -9% /
-17% |
* ... меньше = лучше
Дисплей: тест на время отклика
| ↔ Перемена цвета пикселей, чёрный - белый (1) и белый - чёрный (2) | ||
|---|---|---|
| 40.4 ms ... стадия 1 ↗ и стадия 2 ↘ в сумме | ↗ 22.4 ms стадия 1 | 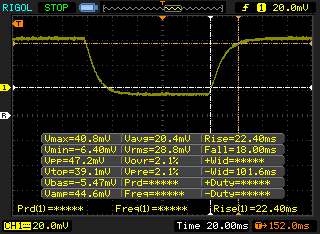 |
| ↘ 18 ms стадия 2 | ||
| Это очень большое время отклика. Экран явно не ориентирован на игры и подобные применения. Для сравнения, самый лучший результат среди всех известных нам устройств равен 0.1 миллисек., самый худший - 240 миллисек. » 98% экранов из нашей базы данных показали более хороший результат. Таким образом, тестируемое устройство находится в нижней половине рейтинга (оно отстаёт от среднего результата, равного 19.8 миллисек.) | ||
| ↔ Перемена цвета пикселей, серый 50% - серый 80% (1) и серый 80% - серый 50% (2) | ||
| 59.2 ms ... стадия 1 ↗ и стадия 2 ↘ в сумме | ↗ 30 ms стадия 1 | 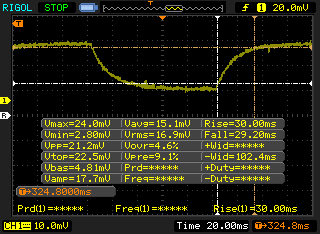 |
| ↘ 29.2 ms стадия 2 | ||
| Это очень большое время отклика. Экран явно не ориентирован на игры и подобные применения. Для сравнения, самый лучший результат среди всех известных нам устройств равен 0.165 миллисек., самый худший - 636 миллисек. » 95% экранов из нашей базы данных показали более хороший результат. Таким образом, тестируемое устройство находится в нижней половине рейтинга (оно отстаёт от среднего результата, равного 30.9 миллисек.) | ||
Тест на мерцание
| Модуляция на частоте | 2137 Hz | ≤ 31 % яркости | 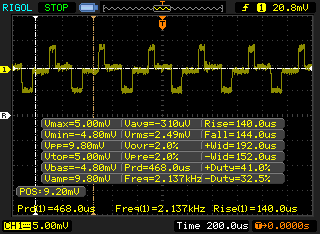 |
Подсветка дисплея мигает с частотой 2137 Гц (худший случай, например, при использовании ШИМ) Этот эффект присутствует при яркости 31 % и ниже. Стоит заметить, что частота 2137 Гц настолько велика, что мерцание будет практически незаметно для глаз. Поэтому можно не бояться негативного влияния PWM на самочувствие. Для сравнения, 52 % известных нам устройств не применяют PWM для изменения яркости, а среди тех, где PWM используется, типичная частота модуляции составляет 7744 Гц (мин. 5 Гц, макс. 343500 Гц). | |||
Cinebench R15: CPU Multi 64Bit | CPU Single 64Bit
Blender: v2.79 BMW27 CPU
7-Zip 18.03: 7z b 4 -mmt1 | 7z b 4
Geekbench 5.5: Single-Core | Multi-Core
HWBOT x265 Benchmark v2.2: 4k Preset
LibreOffice : 20 Documents To PDF
R Benchmark 2.5: Overall mean
| Cinebench R20 / CPU (Multi Core) | |
| Lenovo Yoga Slim 7-14ARE | |
| Lenovo Yoga Slim 7 14ARE05 82A20008GE | |
| Dell XPS 13 7390 Core i7-10710U | |
| Razer Book 13 FHD | |
| HP Envy x360 13-ay0010nr | |
| Усредн. модель с Intel Core i7-1185G7 (1425 - 2493, n=28) | |
| Dell XPS 13 9310 Core i7 4K | |
| Dell XPS 13 9310 Core i7 FHD | |
| Dell XPS 13 9300 Core i7-1065G7 | |
| HP Spectre x360 13-aw0013dx | |
| Asus Zenbook S UX393JA | |
| Dell XPS 13 9300 4K UHD | |
| Huawei MateBook X Pro 2020 i7 | |
| Lenovo ThinkPad P43s-20RH001FGE | |
| Cinebench R20 / CPU (Single Core) | |
| Razer Book 13 FHD | |
| Dell XPS 13 9310 Core i7 4K | |
| Dell XPS 13 9310 Core i7 FHD | |
| Усредн. модель с Intel Core i7-1185G7 (489 - 593, n=28) | |
| Lenovo Yoga Slim 7-14ARE | |
| Lenovo Yoga Slim 7 14ARE05 82A20008GE | |
| Dell XPS 13 7390 Core i7-10710U | |
| Dell XPS 13 9300 Core i7-1065G7 | |
| Dell XPS 13 9300 4K UHD | |
| Asus Zenbook S UX393JA | |
| HP Envy x360 13-ay0010nr | |
| Huawei MateBook X Pro 2020 i7 | |
| HP Spectre x360 13-aw0013dx | |
| Lenovo ThinkPad P43s-20RH001FGE | |
| Cinebench R15 / CPU Multi 64Bit | |
| Lenovo Yoga Slim 7-14ARE | |
| Lenovo Yoga Slim 7 14ARE05 82A20008GE | |
| Dell XPS 13 7390 Core i7-10710U | |
| Razer Book 13 FHD | |
| Dell XPS 13 9310 Core i7 FHD | |
| Dell XPS 13 9310 Core i7 4K | |
| Усредн. модель с Intel Core i7-1185G7 (617 - 1066, n=32) | |
| HP Envy x360 13-ay0010nr | |
| Dell XPS 13 9300 4K UHD | |
| Dell XPS 13 9300 Core i7-1065G7 | |
| Dell XPS 13 9380 2019 | |
| HP Spectre x360 13-aw0013dx | |
| Asus Zenbook S UX393JA | |
| Huawei MateBook X Pro 2020 i7 | |
| Lenovo ThinkPad P43s-20RH001FGE | |
| Cinebench R15 / CPU Single 64Bit | |
| Razer Book 13 FHD | |
| Dell XPS 13 9310 Core i7 FHD | |
| Dell XPS 13 9310 Core i7 4K | |
| Усредн. модель с Intel Core i7-1185G7 (168 - 230, n=27) | |
| Lenovo Yoga Slim 7-14ARE | |
| Dell XPS 13 9300 4K UHD | |
| Dell XPS 13 7390 Core i7-10710U | |
| Dell XPS 13 9300 Core i7-1065G7 | |
| Asus Zenbook S UX393JA | |
| HP Spectre x360 13-aw0013dx | |
| Lenovo Yoga Slim 7 14ARE05 82A20008GE | |
| HP Envy x360 13-ay0010nr | |
| Huawei MateBook X Pro 2020 i7 | |
| Lenovo ThinkPad P43s-20RH001FGE | |
| Dell XPS 13 9380 2019 | |
| Blender / v2.79 BMW27 CPU | |
| Huawei MateBook X Pro 2020 i7 | |
| Asus Zenbook S UX393JA | |
| Lenovo ThinkPad P43s-20RH001FGE | |
| Dell XPS 13 9300 4K UHD | |
| Dell XPS 13 9310 Core i7 4K | |
| Dell XPS 13 9310 Core i7 FHD | |
| HP Envy x360 13-ay0010nr | |
| Усредн. модель с Intel Core i7-1185G7 (478 - 745, n=28) | |
| Dell XPS 13 7390 Core i7-10710U | |
| Razer Book 13 FHD | |
| Lenovo Yoga Slim 7 14ARE05 82A20008GE | |
| Lenovo Yoga Slim 7-14ARE | |
| 7-Zip 18.03 / 7z b 4 -mmt1 | |
| Razer Book 13 FHD | |
| Dell XPS 13 9310 Core i7 FHD | |
| Усредн. модель с Intel Core i7-1185G7 (3678 - 5507, n=27) | |
| Dell XPS 13 9310 Core i7 4K | |
| Lenovo ThinkPad P43s-20RH001FGE | |
| Huawei MateBook X Pro 2020 i7 | |
| Dell XPS 13 9300 4K UHD | |
| Lenovo Yoga Slim 7-14ARE | |
| Asus Zenbook S UX393JA | |
| Dell XPS 13 7390 Core i7-10710U | |
| Lenovo Yoga Slim 7 14ARE05 82A20008GE | |
| HP Envy x360 13-ay0010nr | |
| 7-Zip 18.03 / 7z b 4 | |
| Lenovo Yoga Slim 7-14ARE | |
| Lenovo Yoga Slim 7 14ARE05 82A20008GE | |
| Razer Book 13 FHD | |
| Dell XPS 13 7390 Core i7-10710U | |
| Усредн. модель с Intel Core i7-1185G7 (18812 - 27693, n=27) | |
| HP Envy x360 13-ay0010nr | |
| Dell XPS 13 9300 4K UHD | |
| Dell XPS 13 9310 Core i7 FHD | |
| Dell XPS 13 9310 Core i7 4K | |
| Lenovo ThinkPad P43s-20RH001FGE | |
| Asus Zenbook S UX393JA | |
| Huawei MateBook X Pro 2020 i7 | |
| Geekbench 5.5 / Single-Core | |
| Razer Book 13 FHD | |
| Dell XPS 13 9310 Core i7 FHD | |
| Dell XPS 13 9310 Core i7 4K | |
| Усредн. модель с Intel Core i7-1185G7 (1398 - 1626, n=21) | |
| Asus Zenbook S UX393JA | |
| Dell XPS 13 9300 4K UHD | |
| Lenovo Yoga Slim 7-14ARE | |
| Lenovo Yoga Slim 7-14ARE | |
| Lenovo Yoga Slim 7 14ARE05 82A20008GE | |
| HP Envy x360 13-ay0010nr | |
| Huawei MateBook X Pro 2020 i7 | |
| HWBOT x265 Benchmark v2.2 / 4k Preset | |
| Lenovo Yoga Slim 7-14ARE | |
| Lenovo Yoga Slim 7 14ARE05 82A20008GE | |
| Razer Book 13 FHD | |
| HP Envy x360 13-ay0010nr | |
| Усредн. модель с Intel Core i7-1185G7 (5.02 - 8.13, n=27) | |
| Dell XPS 13 9300 4K UHD | |
| Dell XPS 13 7390 Core i7-10710U | |
| Dell XPS 13 9310 Core i7 FHD | |
| Dell XPS 13 9310 Core i7 4K | |
| Lenovo ThinkPad P43s-20RH001FGE | |
| Asus Zenbook S UX393JA | |
| Huawei MateBook X Pro 2020 i7 | |
| LibreOffice / 20 Documents To PDF | |
| Dell XPS 13 9300 4K UHD | |
| Lenovo Yoga Slim 7 14ARE05 82A20008GE | |
| HP Envy x360 13-ay0010nr | |
| Lenovo Yoga Slim 7-14ARE | |
| Huawei MateBook X Pro 2020 i7 | |
| Усредн. модель с Intel Core i7-1185G7 (41.3 - 61.7, n=26) | |
| Razer Book 13 FHD | |
| Asus Zenbook S UX393JA | |
| Dell XPS 13 9310 Core i7 4K | |
| Dell XPS 13 9310 Core i7 FHD | |
| R Benchmark 2.5 / Overall mean | |
| Dell XPS 13 9300 4K UHD | |
| Asus Zenbook S UX393JA | |
| Huawei MateBook X Pro 2020 i7 | |
| HP Envy x360 13-ay0010nr | |
| Lenovo Yoga Slim 7 14ARE05 82A20008GE | |
| Lenovo Yoga Slim 7-14ARE | |
| Dell XPS 13 9310 Core i7 4K | |
| Dell XPS 13 9310 Core i7 FHD | |
| Усредн. модель с Intel Core i7-1185G7 (0.55 - 0.615, n=27) | |
| Razer Book 13 FHD | |
Cinebench R15: CPU Multi 64Bit | CPU Single 64Bit
Blender: v2.79 BMW27 CPU
7-Zip 18.03: 7z b 4 -mmt1 | 7z b 4
Geekbench 5.5: Single-Core | Multi-Core
HWBOT x265 Benchmark v2.2: 4k Preset
LibreOffice : 20 Documents To PDF
R Benchmark 2.5: Overall mean
* ... меньше = лучше
| PCMark 8 Home Score Accelerated v2 | 3765 баллов | |
| PCMark 8 Work Score Accelerated v2 | 2493 баллов | |
| PCMark 10 Score | 4872 баллов | |
? | ||
| DPC Latencies / LatencyMon - interrupt to process latency (max), Web, Youtube, Prime95 | |
| Dell XPS 13 9300 Core i7-1065G7 | |
| Asus Zenbook S UX393JA | |
| Lenovo Yoga Slim 7-14ARE | |
| Dell XPS 13 9310 Core i7 4K | |
| Dell XPS 13 9310 Core i7 FHD | |
* ... меньше = лучше
| Dell XPS 13 9310 Core i7 4K Micron 2300 512GB MTFDHBA512TDV | Asus Zenbook S UX393JA Intel SSD 660p 1TB SSDPEKNW010T8 | Huawei MateBook X Pro 2020 i7 Samsung PM981a MZVLB1T0HBLR | Dell XPS 13 9300 Core i7-1065G7 Intel SSDPEMKF512G8 NVMe SSD | Lenovo Yoga Slim 7-14ARE Samsung SSD PM981a MZVLB512HBJQ | HP Spectre x360 13-aw0013dx Intel Optane Memory H10 with Solid State Storage 32GB + 512GB HBRPEKNX0202A(L/H) | |
|---|---|---|---|---|---|---|
| AS SSD | -16% | 45% | -21% | 23% | -36% | |
| Seq Read (MB/s) | 2144 | 1405 -34% | 2737 28% | 1956 -9% | 1658 -23% | 1039 -52% |
| Seq Write (MB/s) | 1389 | 1062 -24% | 2530 82% | 1227 -12% | 2464 77% | 310.1 -78% |
| 4K Read (MB/s) | 49.77 | 50.8 2% | 54 8% | 63 27% | 59.5 20% | 76 53% |
| 4K Write (MB/s) | 105 | 124.9 19% | 152.5 45% | 156.6 49% | 128.6 22% | 118 12% |
| 4K-64 Read (MB/s) | 855 | 590 -31% | 2011 135% | 475.6 -44% | 1576 84% | 371.8 -57% |
| 4K-64 Write (MB/s) | 1660 | 840 -49% | 1260 -24% | 539 -68% | 1986 20% | 469.5 -72% |
| Access Time Read * (ms) | 0.058 | 0.041 29% | 0.066 -14% | 0.042 28% | 0.049 16% | 0.067 -16% |
| Access Time Write * (ms) | 0.272 | 0.118 57% | 0.024 91% | 0.105 61% | 0.087 68% | 0.138 49% |
| Score Read (Points) | 1119 | 781 -30% | 2339 109% | 734 -34% | 1802 61% | 552 -51% |
| Score Write (Points) | 1904 | 1071 -44% | 1666 -12% | 818 -57% | 2361 24% | 618 -68% |
| Score Total (Points) | 3570 | 2251 -37% | 5191 45% | 1915 -46% | 5133 44% | 1448 -59% |
| Copy ISO MB/s (MB/s) | 1929 | 1459 -24% | 1022 -47% | 1588 -18% | 764 -60% | |
| Copy Program MB/s (MB/s) | 1012 | 600 -41% | 302.8 -70% | 550 -46% | 465.8 -54% | |
| Copy Game MB/s (MB/s) | 1737 | 1411 -19% | 491.4 -72% | 1329 -23% | 764 -56% | |
| CrystalDiskMark 5.2 / 6 | -6% | 24% | 27% | 35% | 6% | |
| Write 4K (MB/s) | 86 | 129.5 51% | 165.6 93% | 186.8 117% | 146.1 70% | 112.6 31% |
| Read 4K (MB/s) | 40.11 | 54 35% | 50.2 25% | 71.4 78% | 47.18 18% | 131 227% |
| Write Seq (MB/s) | 1738 | 1265 -27% | 1905 10% | 1203 -31% | 2896 67% | 458.9 -74% |
| Read Seq (MB/s) | 1553 | 1410 -9% | 1669 7% | 2600 67% | 2754 77% | 1355 -13% |
| Write 4K Q32T1 (MB/s) | 454.9 | 420.3 -8% | 474.6 4% | 514 13% | 425.8 -6% | 341.3 -25% |
| Read 4K Q32T1 (MB/s) | 385.4 | 357.7 -7% | 508 32% | 570 48% | 514 33% | 320.6 -17% |
| Write Seq Q32T1 (MB/s) | 2784 | 1799 -35% | 3007 8% | 786 -72% | 2989 7% | 1219 -56% |
| Read Seq Q32T1 (MB/s) | 3217 | 1616 -50% | 3556 11% | 2947 -8% | 3568 11% | 2462 -23% |
| Среднее значение | -11% /
-13% | 35% /
36% | 3% /
-4% | 29% /
27% | -15% /
-21% |
* ... меньше = лучше

Disk Throttling: DiskSpd Read Loop, Queue Depth 8
| 3DMark 11 Performance | 5461 баллов | |
| 3DMark Cloud Gate Standard Score | 15779 баллов | |
| 3DMark Fire Strike Score | 4821 баллов | |
| 3DMark Time Spy Score | 1749 баллов | |
? | ||
| мин. | сред. | выс. | макс. | QHD | 4K | |
|---|---|---|---|---|---|---|
| GTA V (2015) | 80.8 | 64.6 | 20.5 | 9.75 | ||
| The Witcher 3 (2015) | 107 | 61.9 | 34.5 | 15.3 | ||
| Dota 2 Reborn (2015) | 80.7 | 51.4 | 38.2 | 38.6 | 20 | |
| Final Fantasy XV Benchmark (2018) | 31.3 | 18.8 | 14.6 | 11.4 | 7.54 | |
| X-Plane 11.11 (2018) | 26 | 27.8 | 31.8 | 14.9 |
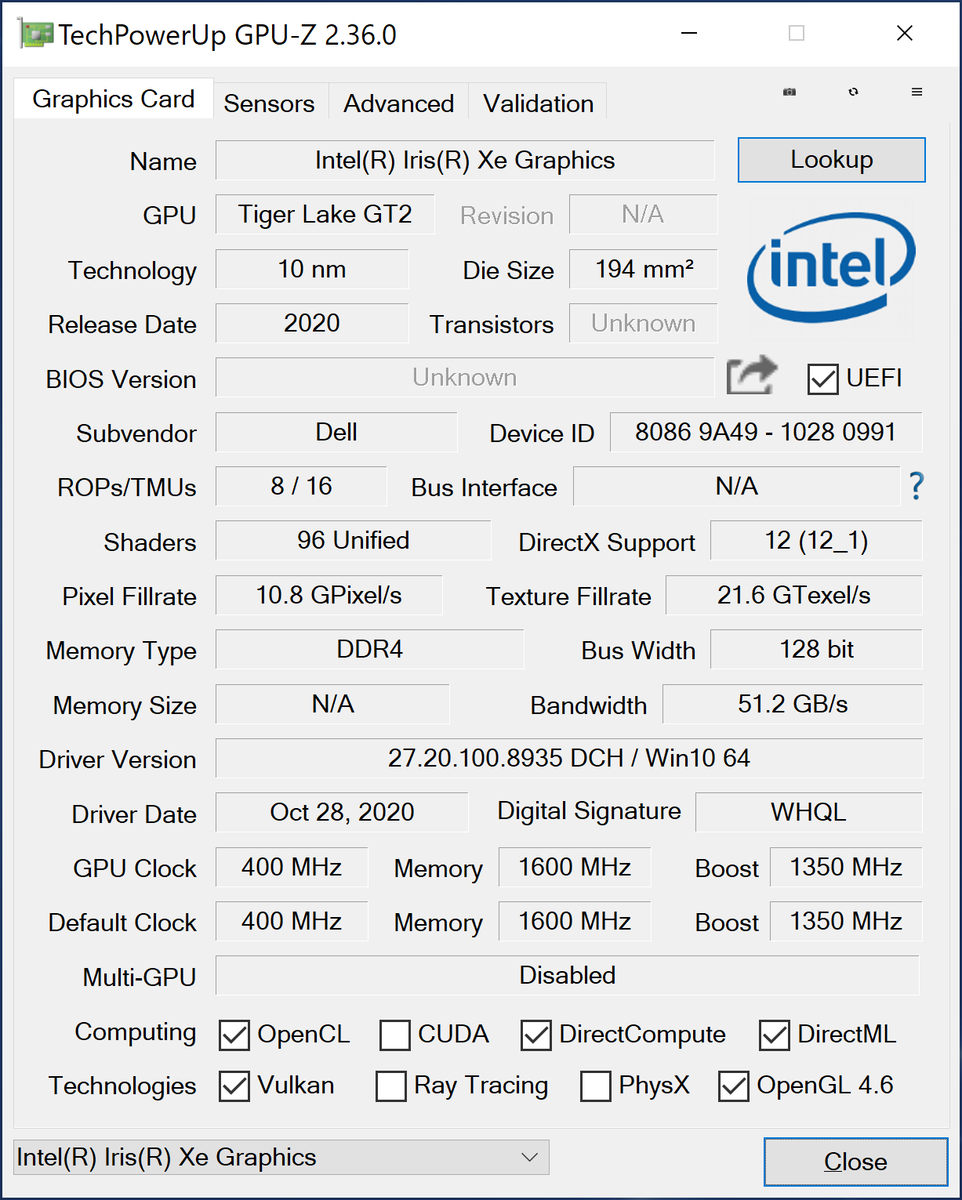
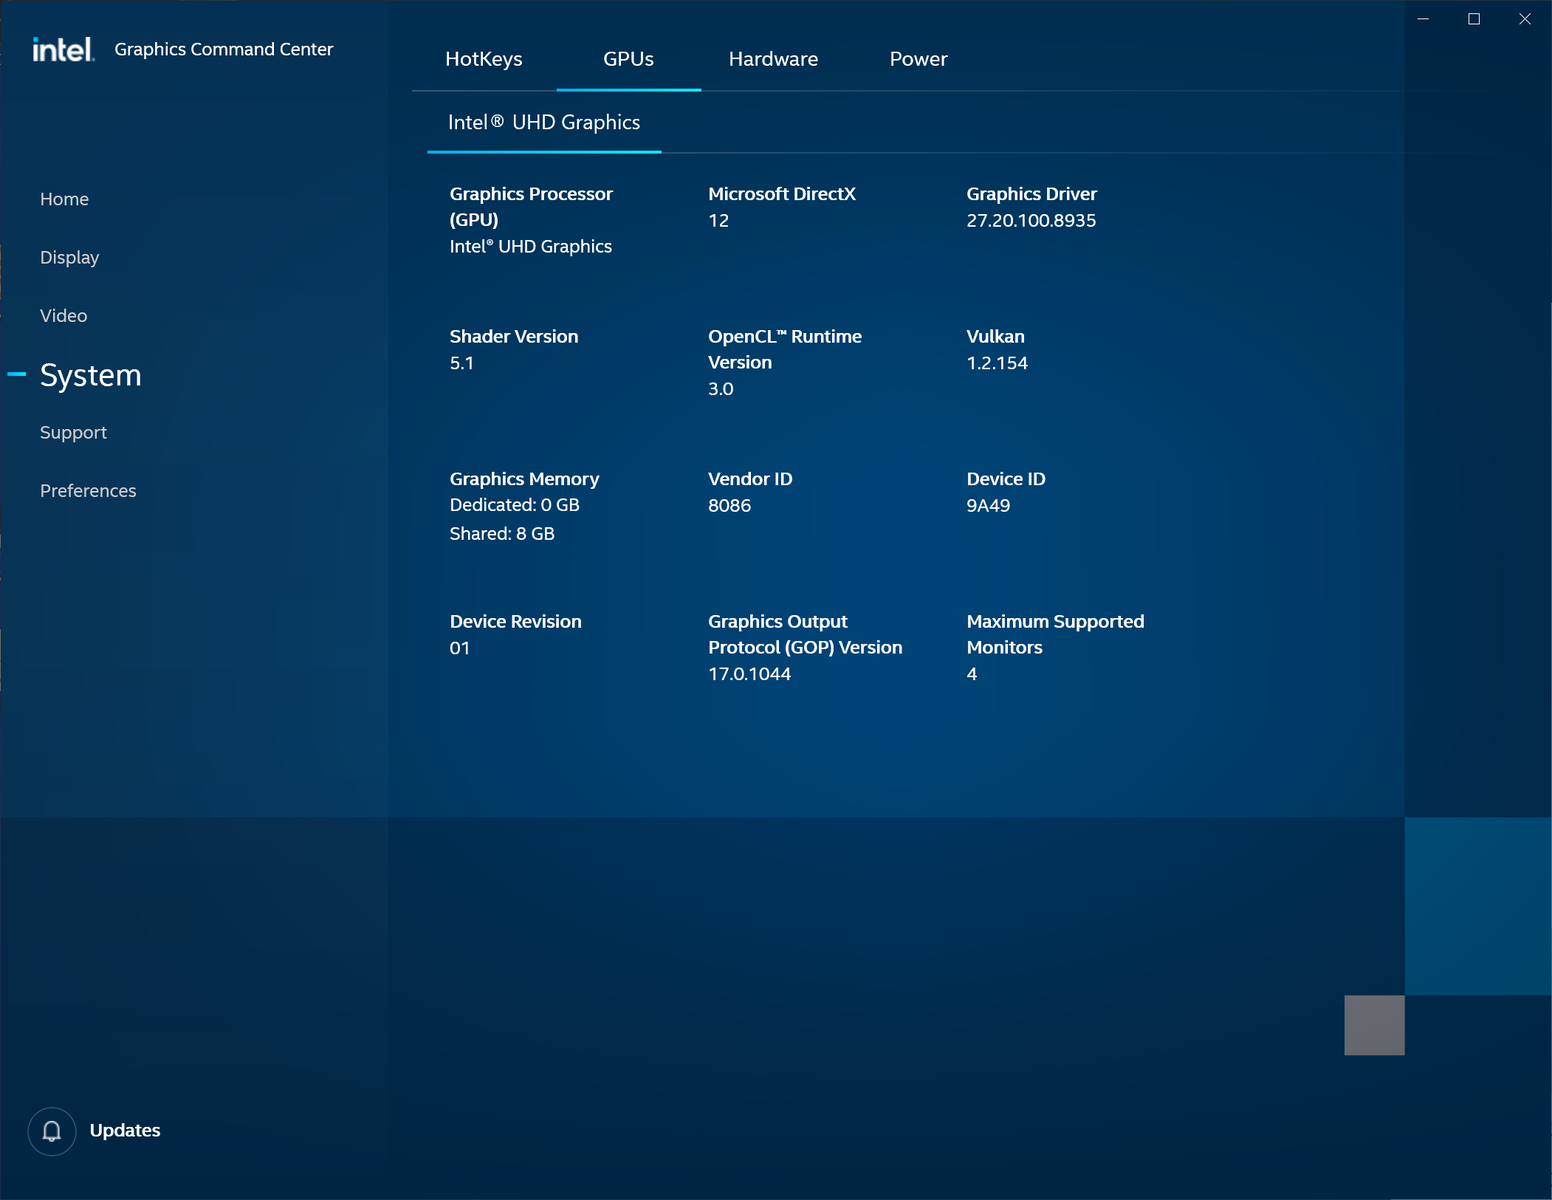
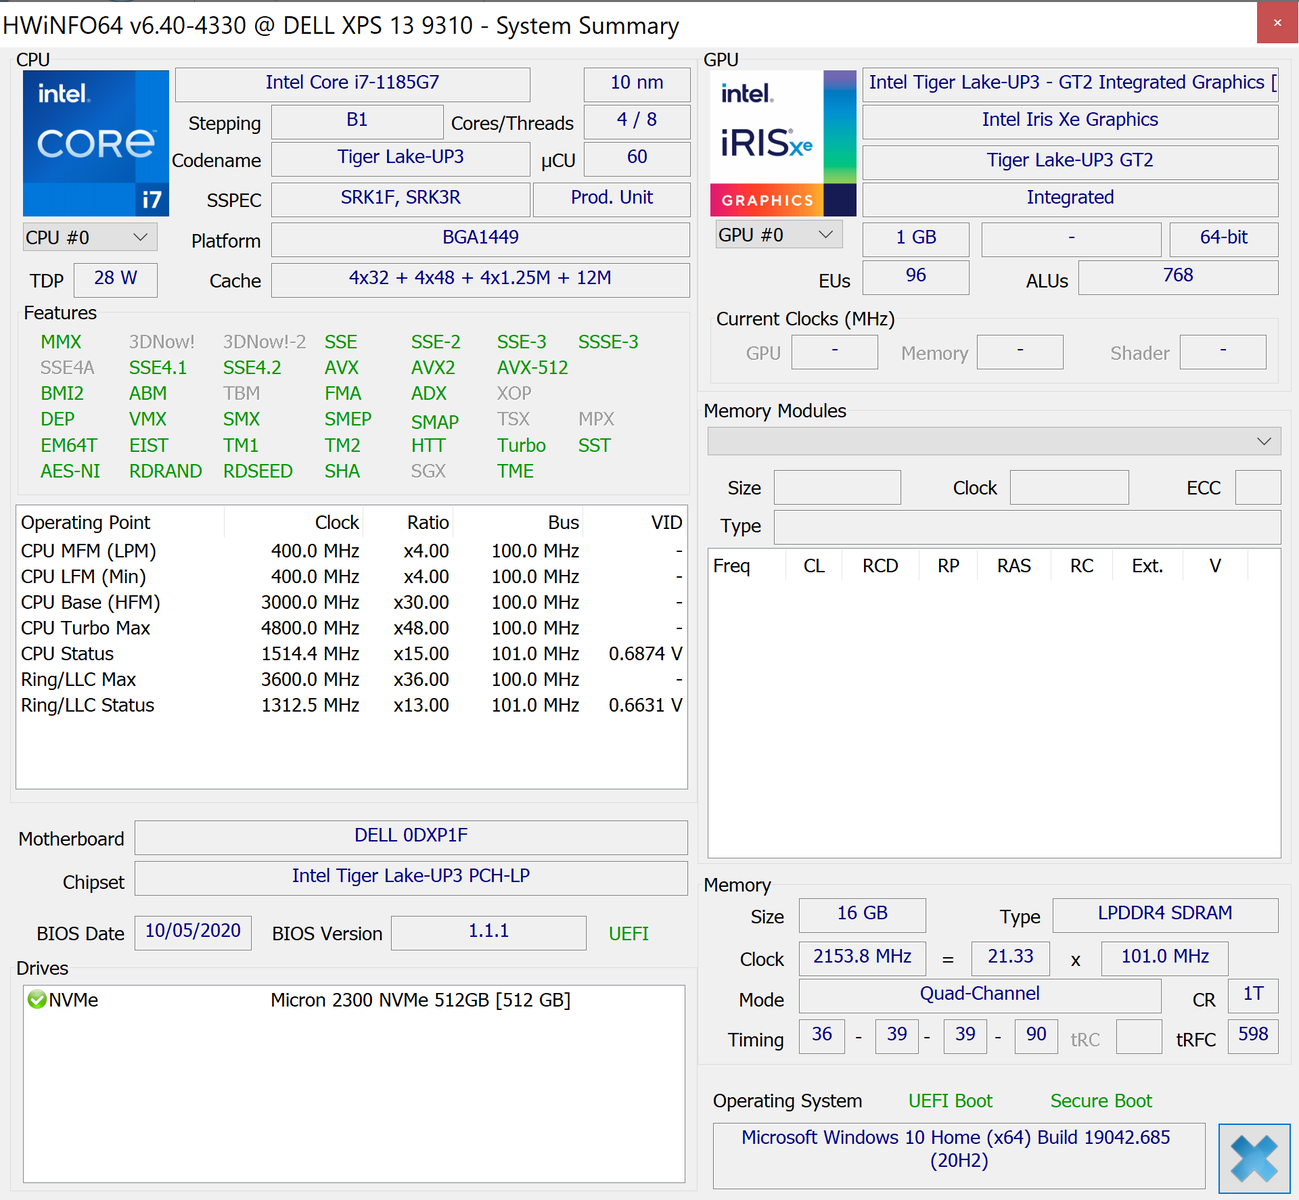
| Dell XPS 13 9310 Core i7 4K Iris Xe G7 96EUs, i7-1185G7, Micron 2300 512GB MTFDHBA512TDV | Asus Zenbook S UX393JA Iris Plus Graphics G7 (Ice Lake 64 EU), i7-1065G7, Intel SSD 660p 1TB SSDPEKNW010T8 | Huawei MateBook X Pro 2020 i7 GeForce MX250, i7-10510U, Samsung PM981a MZVLB1T0HBLR | Dell XPS 13 9300 Core i7-1065G7 Iris Plus Graphics G7 (Ice Lake 64 EU), i7-1065G7, Intel SSDPEMKF512G8 NVMe SSD | Lenovo Yoga Slim 7-14ARE Vega 8, R7 4800U, Samsung SSD PM981a MZVLB512HBJQ | HP Spectre x360 13-aw0013dx Iris Plus Graphics G7 (Ice Lake 64 EU), i7-1065G7, Intel Optane Memory H10 with Solid State Storage 32GB + 512GB HBRPEKNX0202A(L/H) | |
|---|---|---|---|---|---|---|
| Уровень шума | -10% | -12% | -7% | 0% | -2% | |
| в выкл. виде (фон) * (dB) | 27.7 | 26.9 3% | 29.6 -7% | 28.3 -2% | 26.3 5% | 28.5 -3% |
| Мин. в простое * (dB) | 27.8 | 26.9 3% | 29.6 -6% | 28.3 -2% | 26.5 5% | 28.5 -3% |
| В простое, сред. * (dB) | 27.8 | 29 -4% | 29.6 -6% | 28.3 -2% | 26.5 5% | 28.5 -3% |
| В простое, макс. * (dB) | 27.8 | 31.1 -12% | 30.3 -9% | 28.3 -2% | 26.5 5% | 28.5 -3% |
| Нагрузка, сред. * (dB) | 27.9 | 37.7 -35% | 38 -36% | 32.5 -16% | 31.8 -14% | 28.5 -2% |
| Witcher 3 ultra * (dB) | 32.8 | 40.2 -23% | 38 -16% | 39.3 -20% | 35.9 -9% | 35.3 -8% |
| Нагрузка, макс. * (dB) | 37 | 38.1 -3% | 38 -3% | 39.3 -6% | 35.9 3% | 35.3 5% |
* ... меньше = лучше
Уровень шума
| Ожидание |
| 27.8 / 27.8 / 27.8 дБ |
| Нагрузка |
| 27.9 / 37 дБ |
 | ||
30 dB бесшумно 40 dB(A) различимо 50 dB(A) громко |
||
min: | ||
(-) Макс. температура верха корпуса составила 47 град. Цельсия. Типичное значение для устройств этого же класса (Subnotebook) = 35.9 градуса (-ов) при минимуме в 21.4 град. и максимуме в 59 град.
(±) Макс. температура дна составила 45 град. Цельсия. Типичное значение для устройств этого же класса = 39.2 градуса (-ов).
(+) При отсутствии вычислительной нагрузки верх корпуса нагревается в среднем до 26.1 град. Типичное значение для устройств этого же класса = 30.8 градуса (-ов).
(±) При игре в Ведьмак 3 верх корпуса нагревается в среднем до 34.4 град. Типичное значение для устройств этого же класса = 30.8 градуса (-ов).
(+) Палуба на ощупь: Прохладно (28.8 град. Цельсия).
(±) Средняя температура палубы у похожих моделей составила 28.2 град. Цельсия, это -0.6 градуса (-ов) разницы.
Анализ АЧХ аудиосистемы Dell XPS 13 9310 Core i7 4K
(+) | отличный уровень макс. громкости (84.6 дБА)
Низкие частоты (100 Гц - 315 Гц)
(±) | баса мало (на 13.1% меньше медианы)
(±) | он умеренно сбалансирован
Средние частоты (400 Гц - 2000 Гц)
(+) | диапазон не провален и не выпячен (отклонение лишь 4.3% от медианы)
(+) | он ровный, без "горбов" или провалов
Высокие частоты (2 кГц - 16 кГц)
(+) | диапазон отлично сбалансирован (отклонение лишь 1.5% от медианы)
(+) | он ровный, без "горбов" или провалов
Весь диапазон (100 - 16000 Гц)
(+) | звук в целом сбалансирован (10.9% отличия от медианы)
в сравнении с устройствами того же класса
» 10% прямо сравнимых устройств показал(и) себя лучше, 3% примерно так же, 87% значительно хуже
» Δ наилучшего устройства из прямо сравнимых: 5%, средняя Δ: 18%, худший результат: 53%
в сравнении со всеми тестированными устройствами
» 6% известных нам устройств показал(и) себя лучше, 2% примерно так же, 92% значительно хуже
» Δ наилучшего устройства среди известных нам: 4%, средняя Δ: 23%, худший результат: 134%
Анализ АЧХ аудиосистемы Apple MacBook 12 (Early 2016) 1.1 GHz
(+) | отличный уровень макс. громкости (83.6 дБА)
Низкие частоты (100 Гц - 315 Гц)
(±) | баса мало (на 11.3% меньше медианы)
(±) | он умеренно сбалансирован
Средние частоты (400 Гц - 2000 Гц)
(+) | диапазон не провален и не выпячен (отклонение лишь 2.4% от медианы)
(+) | он ровный, без "горбов" или провалов
Высокие частоты (2 кГц - 16 кГц)
(+) | диапазон отлично сбалансирован (отклонение лишь 2% от медианы)
(+) | он ровный, без "горбов" или провалов
Весь диапазон (100 - 16000 Гц)
(+) | звук в целом сбалансирован (10.2% отличия от медианы)
в сравнении с устройствами того же класса
» 7% прямо сравнимых устройств показал(и) себя лучше, 2% примерно так же, 90% значительно хуже
» Δ наилучшего устройства из прямо сравнимых: 5%, средняя Δ: 18%, худший результат: 53%
в сравнении со всеми тестированными устройствами
» 5% известных нам устройств показал(и) себя лучше, 1% примерно так же, 94% значительно хуже
» Δ наилучшего устройства среди известных нам: 4%, средняя Δ: 23%, худший результат: 134%
| Выкл. | |
| Ожидание | |
| Нагрузка |
|
Легенда:
min: | |
| Dell XPS 13 9310 Core i7 4K i7-1185G7, Iris Xe G7 96EUs, Micron 2300 512GB MTFDHBA512TDV, IPS, 3840x2400, 13.4" | Asus Zenbook S UX393JA i7-1065G7, Iris Plus Graphics G7 (Ice Lake 64 EU), Intel SSD 660p 1TB SSDPEKNW010T8, IPS, 3300x2200, 13.9" | Huawei MateBook X Pro 2020 i7 i7-10510U, GeForce MX250, Samsung PM981a MZVLB1T0HBLR, LTPS, 3000x2000, 13.9" | Dell XPS 13 9300 Core i7-1065G7 i7-1065G7, Iris Plus Graphics G7 (Ice Lake 64 EU), Intel SSDPEMKF512G8 NVMe SSD, IPS, 1920x1200, 13.4" | Lenovo Yoga Slim 7-14ARE R7 4800U, Vega 8, Samsung SSD PM981a MZVLB512HBJQ, IPS, 1920x1080, 14" | HP Spectre x360 13-aw0013dx i7-1065G7, Iris Plus Graphics G7 (Ice Lake 64 EU), Intel Optane Memory H10 with Solid State Storage 32GB + 512GB HBRPEKNX0202A(L/H), IPS, 1920x1080, 13.3" | |
|---|---|---|---|---|---|---|
| Энергопотребление | 3% | -17% | 12% | 0% | 17% | |
| В простое, мин. * (Watt) | 4.3 | 4.1 5% | 4.3 -0% | 4.2 2% | 4 7% | 3.9 9% |
| В простое, сред. * (Watt) | 8.3 | 7.5 10% | 8.5 -2% | 6.9 17% | 6.3 24% | 6.3 24% |
| В простое, макс. * (Watt) | 8.8 | 8.5 3% | 12 -36% | 7.5 15% | 7.7 12% | 6.8 23% |
| Нагрузка, сред. * (Watt) | 46.2 | 36.8 20% | 54.8 -19% | 33.3 28% | 48.3 -5% | 32.6 29% |
| Witcher 3 ultra * (Watt) | 42.2 | 39.2 7% | 47.1 -12% | 37.1 12% | 49 -16% | 25.6 39% |
| Нагрузка, макс. * (Watt) | 47.3 | 61.6 -30% | 61.5 -30% | 48.4 -2% | 57.6 -22% | 59 -25% |
* ... меньше = лучше
| Dell XPS 13 9310 Core i7 4K i7-1185G7, Iris Xe G7 96EUs, 52 Вт⋅ч | Asus Zenbook S UX393JA i7-1065G7, Iris Plus Graphics G7 (Ice Lake 64 EU), 67 Вт⋅ч | Huawei MateBook X Pro 2020 i7 i7-10510U, GeForce MX250, 57.4 Вт⋅ч | Dell XPS 13 9300 Core i7-1065G7 i7-1065G7, Iris Plus Graphics G7 (Ice Lake 64 EU), 52 Вт⋅ч | Lenovo Yoga Slim 7-14ARE R7 4800U, Vega 8, 61 Вт⋅ч | HP Spectre x360 13-aw0013dx i7-1065G7, Iris Plus Graphics G7 (Ice Lake 64 EU), 60 Вт⋅ч | |
|---|---|---|---|---|---|---|
| Время работы | 15% | 44% | 76% | 43% | 38% | |
| Чтение сайтов по Wi-Fi v.2 (h) | 7.2 | 8.3 15% | 10.4 44% | 12.7 76% | 10.3 43% | 9.9 38% |
| В простое (h) | 38.4 | 27.1 | 37.1 | |||
| Нагрузка и 100% яркости (h) | 2.7 | 2.4 | 1.3 | 2.7 |
За
Против

С точки зрения производительности, Core i7-1185G7 не представляет практически никакого интереса на фоне Core i7-1165G7, потому мы сразу скажем: сэкономьте деньги и возьмите конфигурацию на Core i7-1165G7. Кроме того, сэкономленные на более дешевом процессоре деньги можно доплатить за больший объем ОЗУ или 4K дисплей, если вам это необходимо. Автономность у старшей конфигурации хуже (на 2 часа меньше в тестах), чем у FHD версии - такова цена 4K разрешения.
Если бы мы могли что-то улучшить в XPS 13 9310, то попытались бы стабилизировать поведение процессора в режиме высокой производительности. Дело в том, что при длительной высокой нагрузке частота процессора начинает сильно колебаться - мы понимаем, что таким образом производитель достиг более высокой усредненной частоты, но на производительности в реальных приложениях такое поведение чипа отразилось негативно.
Вместо топового варианта на старшем Core i7-1185G7, лучше выбрать конфигурацию с большим объемом памяти или доплатить за 4K дисплей, так как разница в производительности по сравнению с Core i7-1165G7 совершенно несущественная.
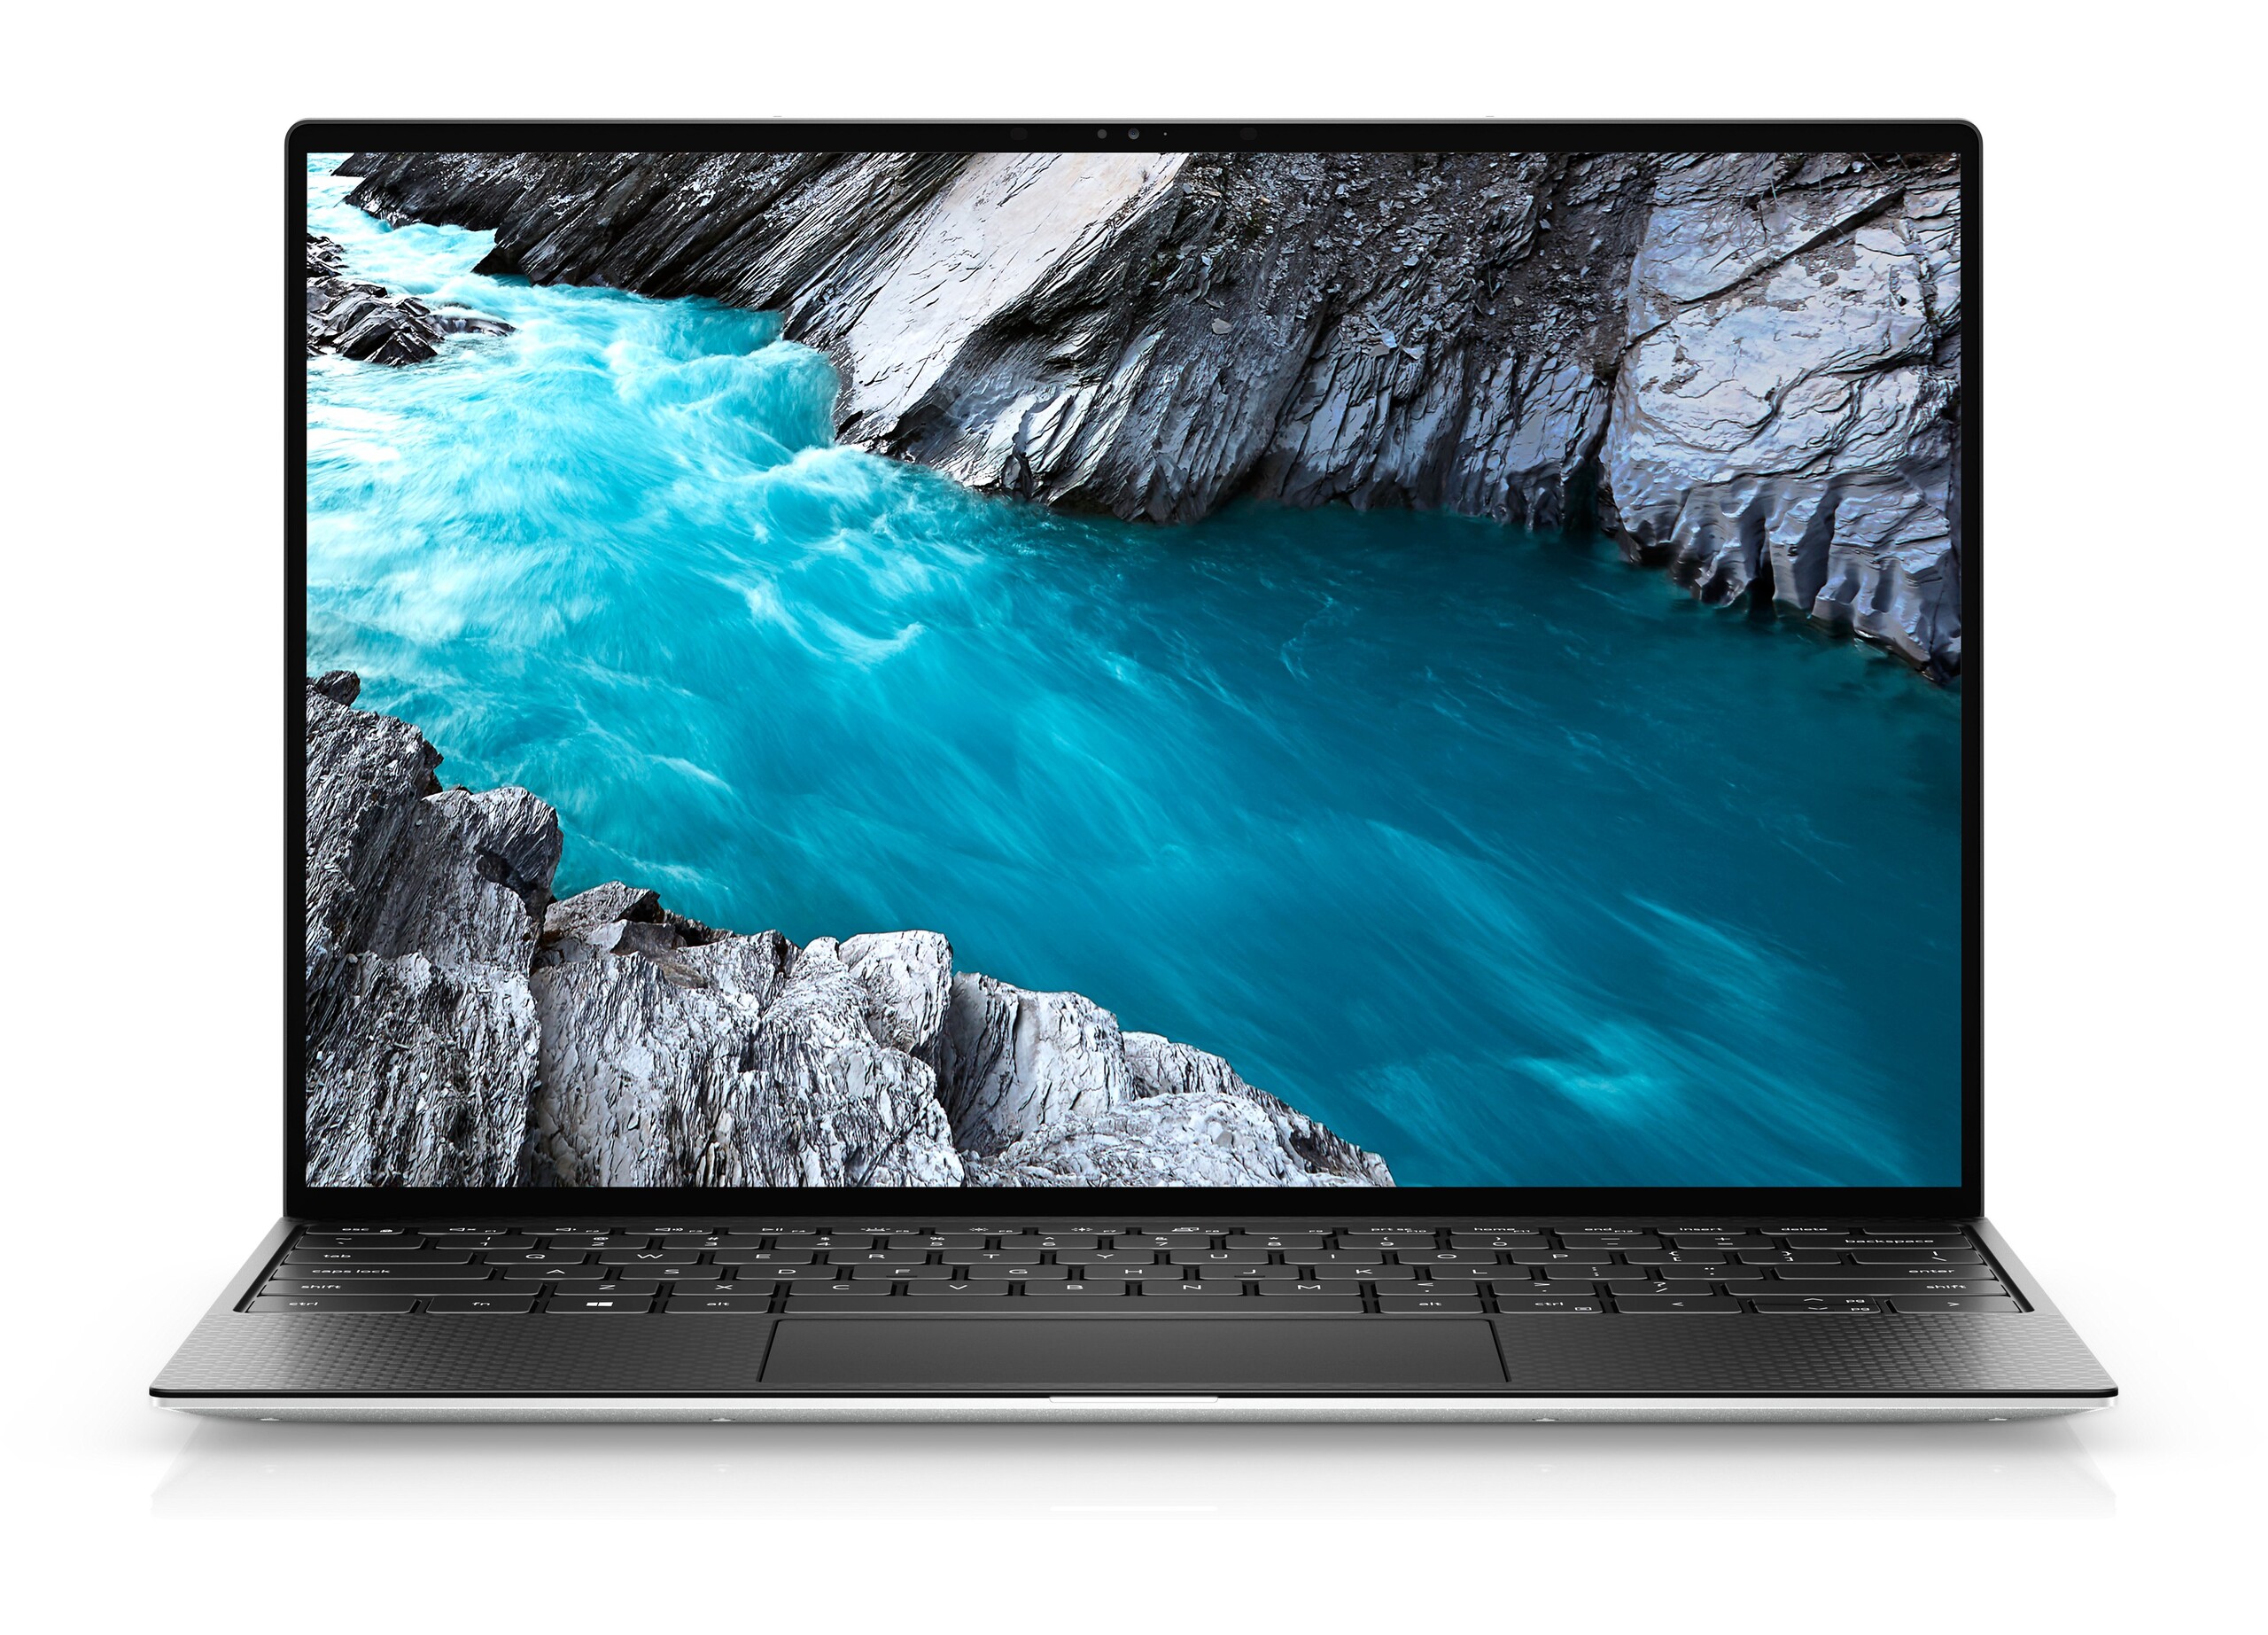
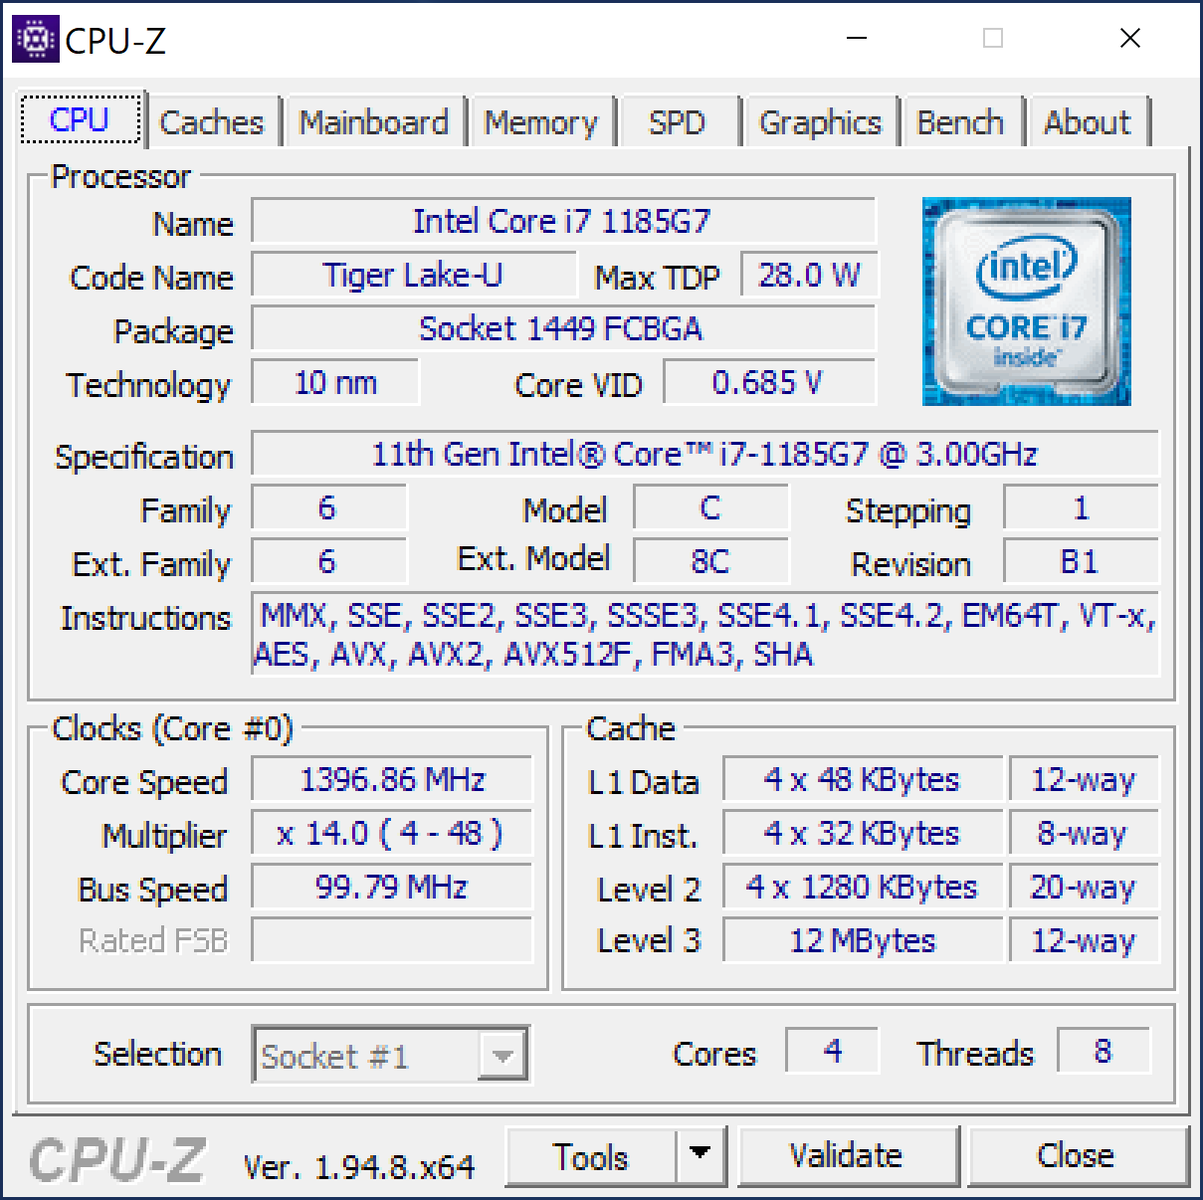
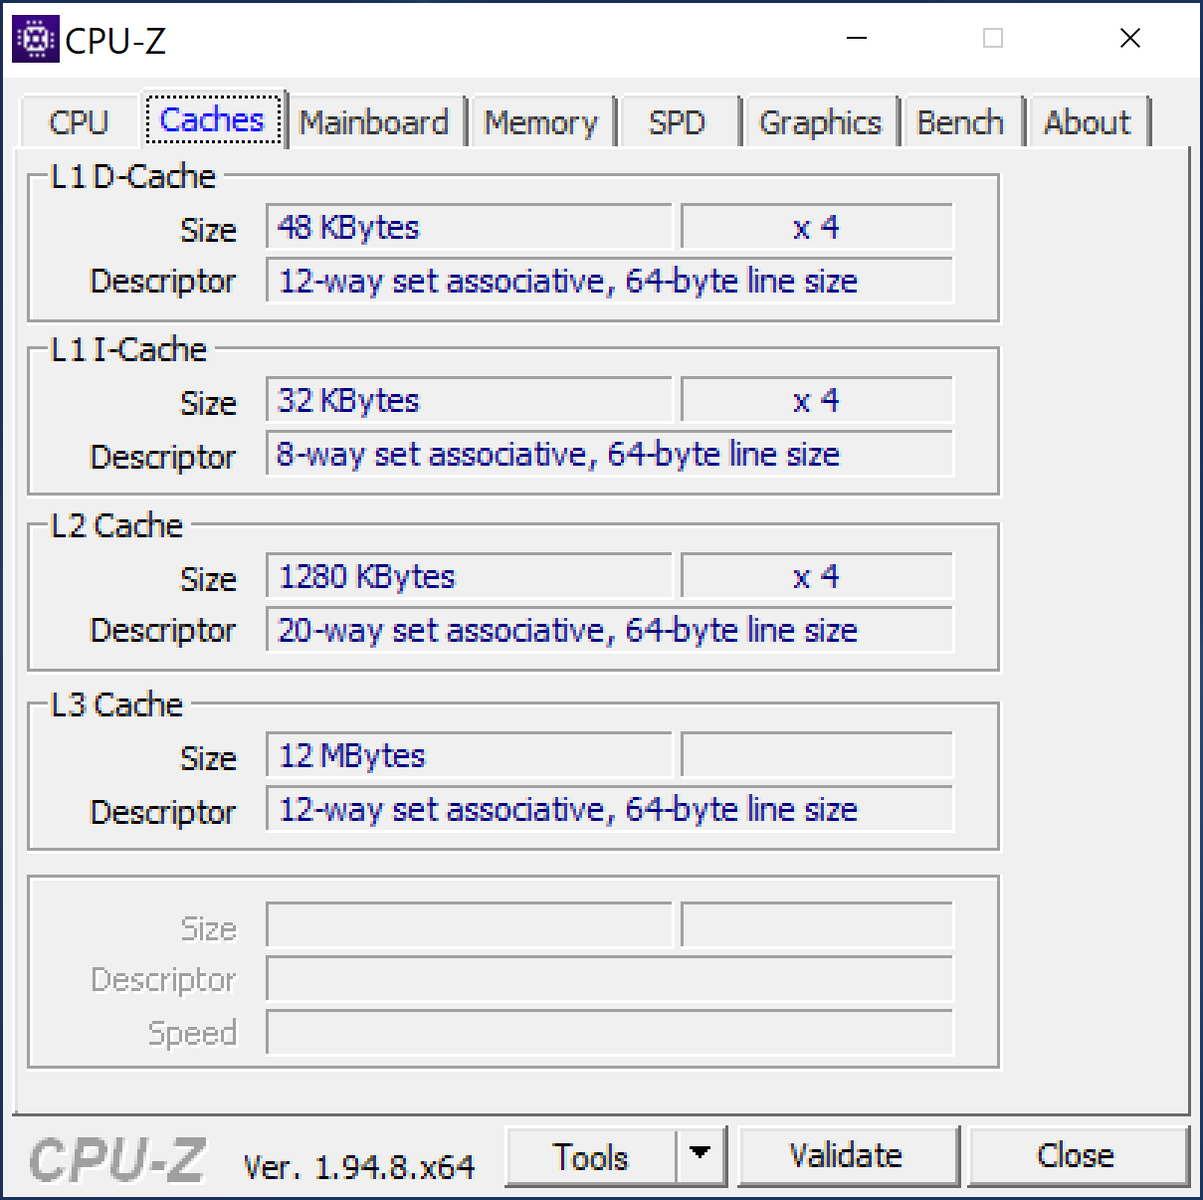
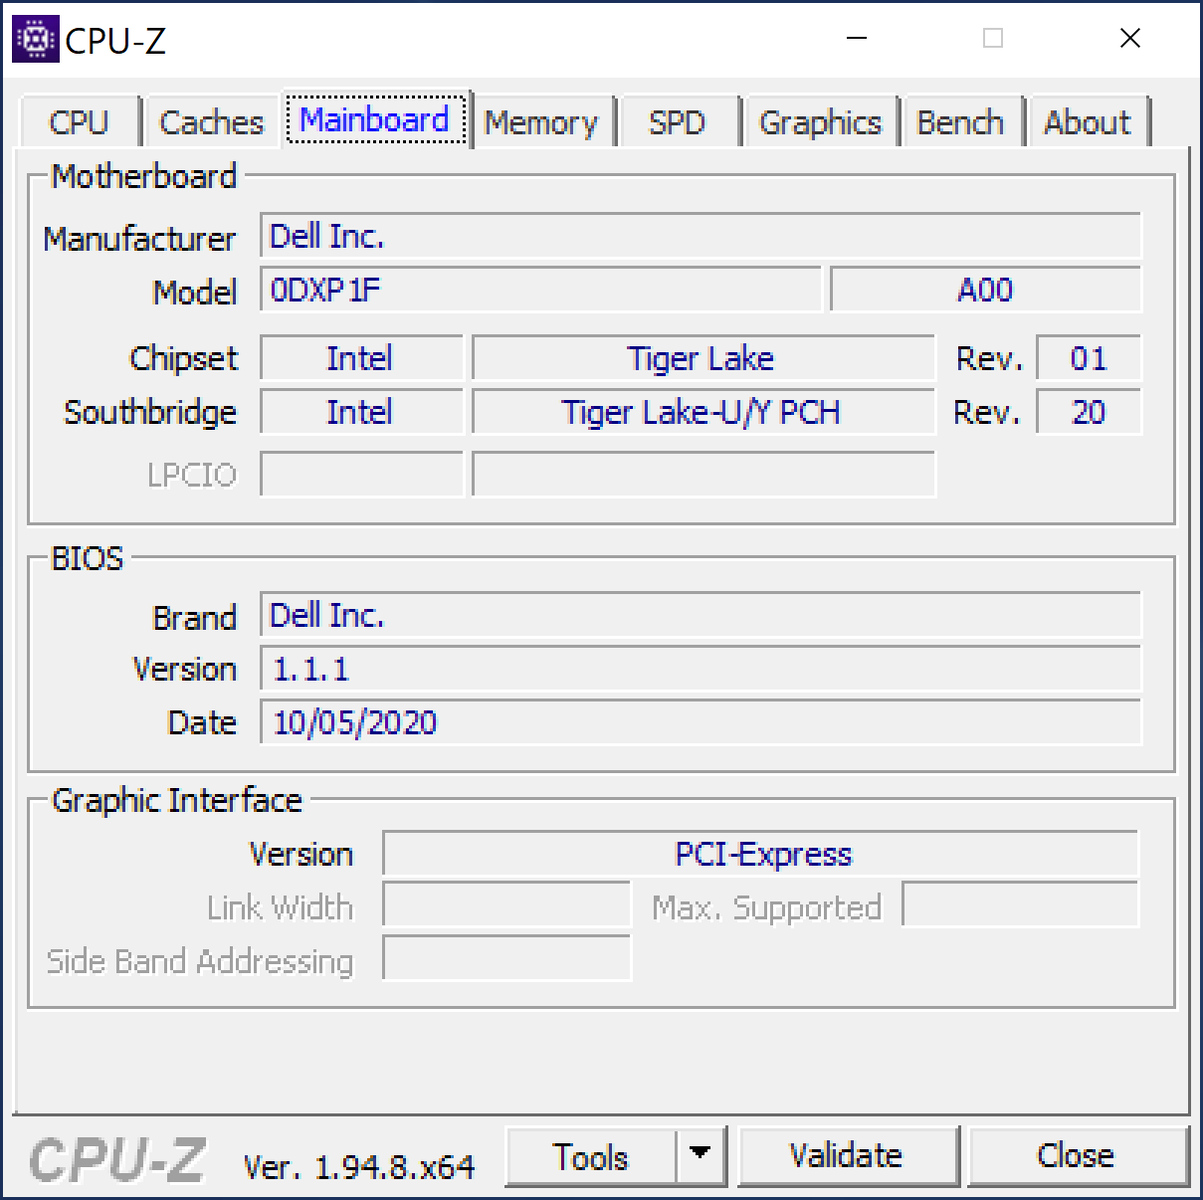
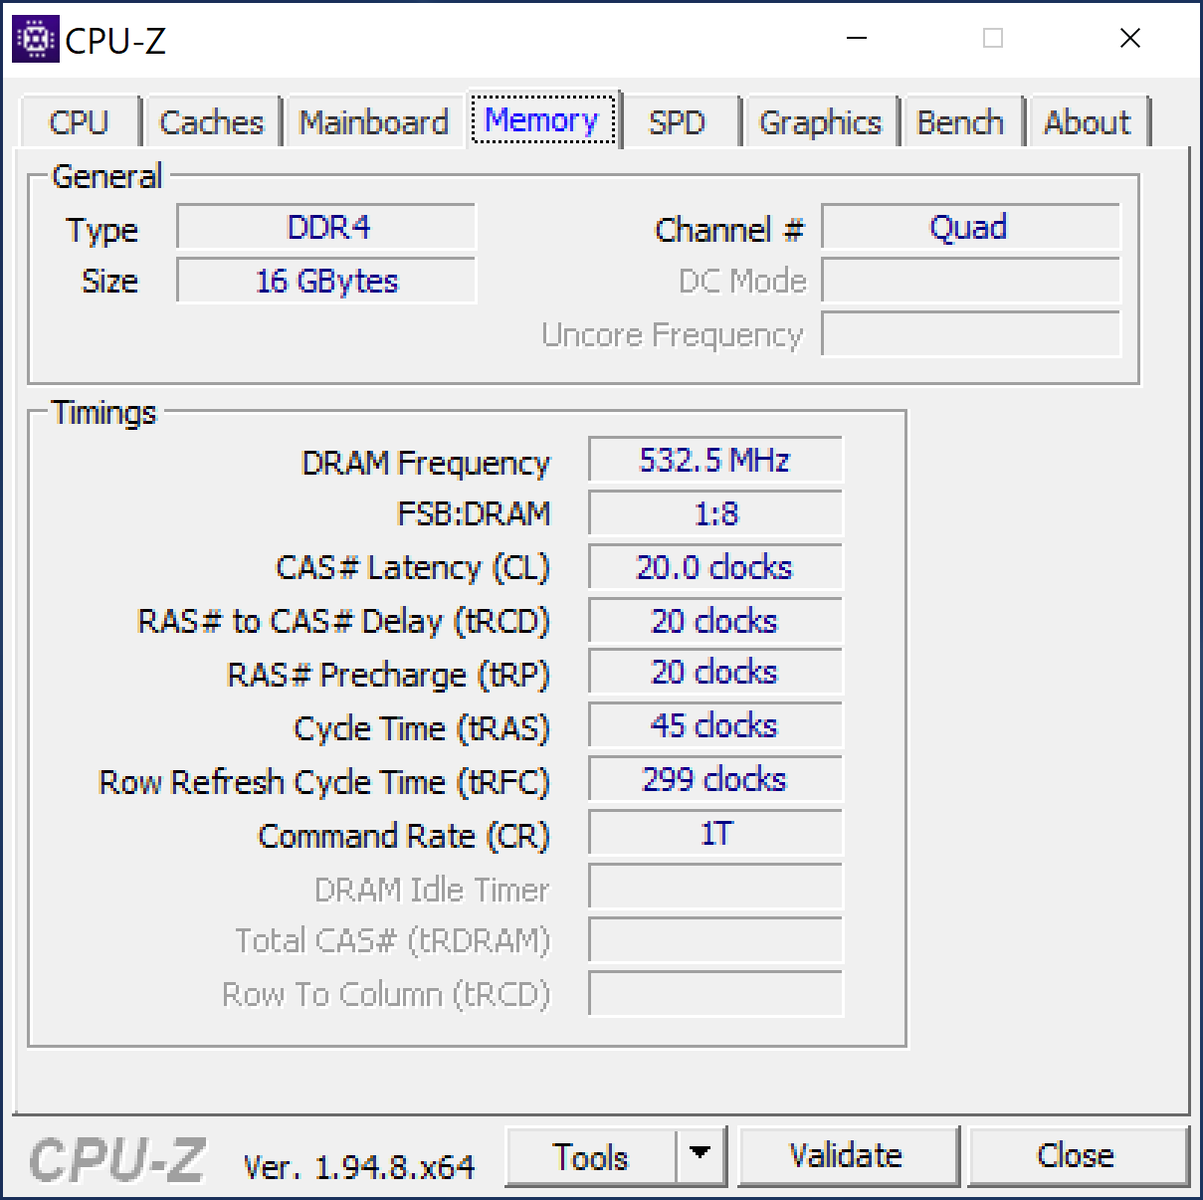
Dell XPS 13 9310 Core i7 4K
- 31 May 2021 v7 (old)
Allen Ngo
Price comparison

