Обзор мини-компьютера Intel NUC11PHKi7C (Phantom Canyon)

В отличие от менее шустрых (и менее дорогих) NUC11TNK и NUC11PAQ, модель NUC11PHK, она же Phantom Canyon, поставляется с дискретной видеокартой GeForce RTX 2060, тем самым выигрывая у первых двух по графической производительности и игровому потенциалу. Phantom Canyon выпущен на смену энтузиастскому NUC 8 (Hades Canyon), не NUC 9 Extreme, как можно бы подумать, это видно в том числе по похожести корпуса.
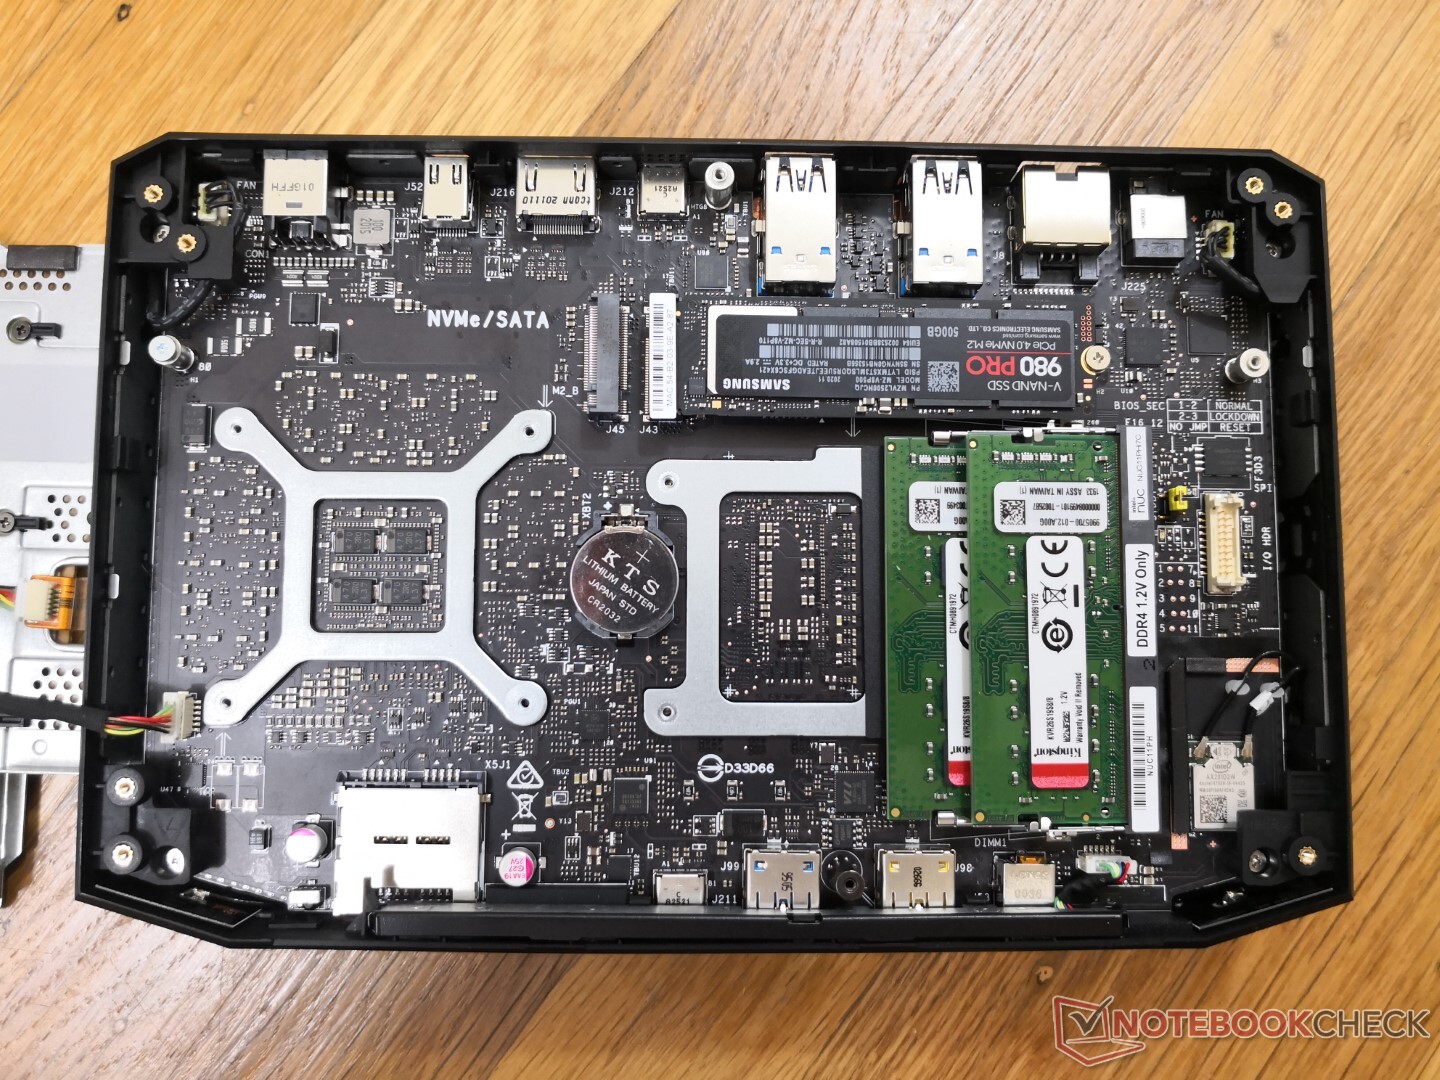
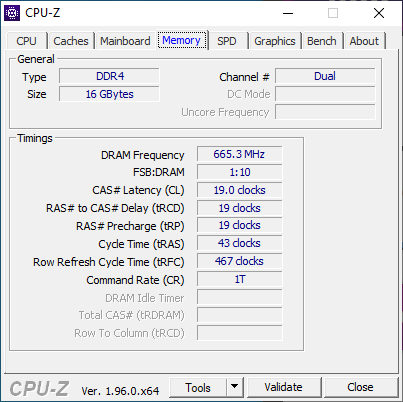
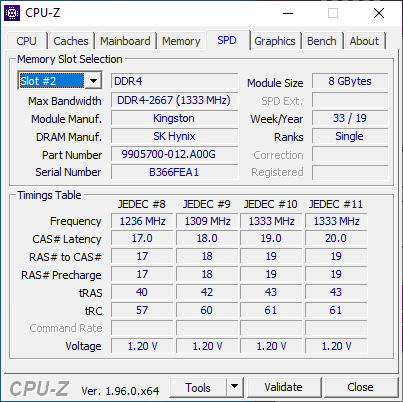
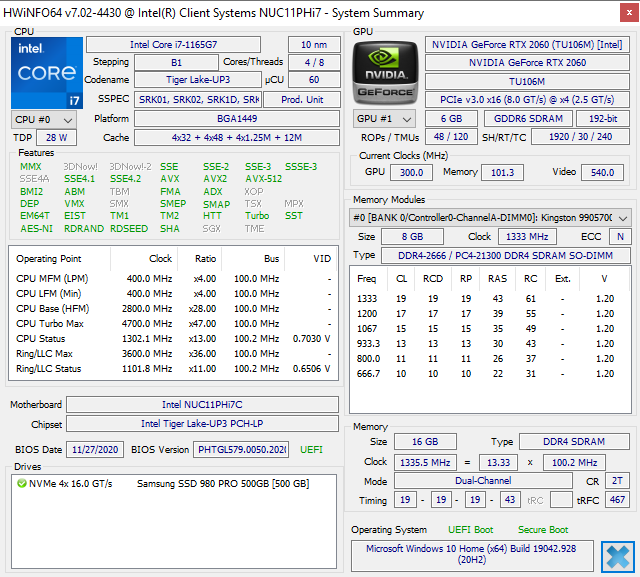
Этот неттоп поставляется в виде платформы. Пользователь сможет установить свои SSD, модули RAM, операционную систему. Для нашего тестирования использовался Samsung 980 Pro, накопитель класса NVMe, а также 16 ГБ двухканальной памяти DDR4-2666. Phantom Canyon ориентирован на память DDR4-3200, но мы использовали то, что было под рукой.
Отметим, что на момент проведения тестов у нас нет точной информации от Intel про поводу поддержки G-Sync и возможности смены синей подсветки черепа на другой цвет.
Больше обзоров Intel NUC:
Рейтинг | Дата | Модель | Вес | Height | Размер | Разрешение | Цена |
|---|---|---|---|---|---|---|---|
v (old) | April 2021 | Intel NUC11PHKi7C i7-1165G7, GeForce RTX 2060 Mobile | 1.4 килог. | 42 мм | x | ||
v (old) | April 2018 | Intel Hades Canyon NUC8i7HVK i7-8809G, Vega M GH | 1.3 килог. | 39 мм | x | ||
v (old) | February 2021 | Intel NUC11PAQi7 i7-1165G7, Iris Xe G7 96EUs | 647 г | 56 мм | x | ||
v (old) | March 2021 | GMK NucBox 2 i5-8259U, Iris Plus Graphics 655 | 430 г | 50 мм | x | ||
v (old) | Zotac ZBOX Magnus EK71080 i7-7700HQ, GeForce GTX 1080 (Desktop) | 3.3 килог. | 128 мм | 0.00" | x | ||
v (old) | Aorus Gaming Box GeForce RTX 2080 Ti i7-1165G7 | 3.8 килог. | 140 мм | x | |||
v (old) | September 2020 | Beelink GTR35 II-G-16512D00W64PRO-1T R5 3550H, Vega 8 | 843 г | 39 мм | x |
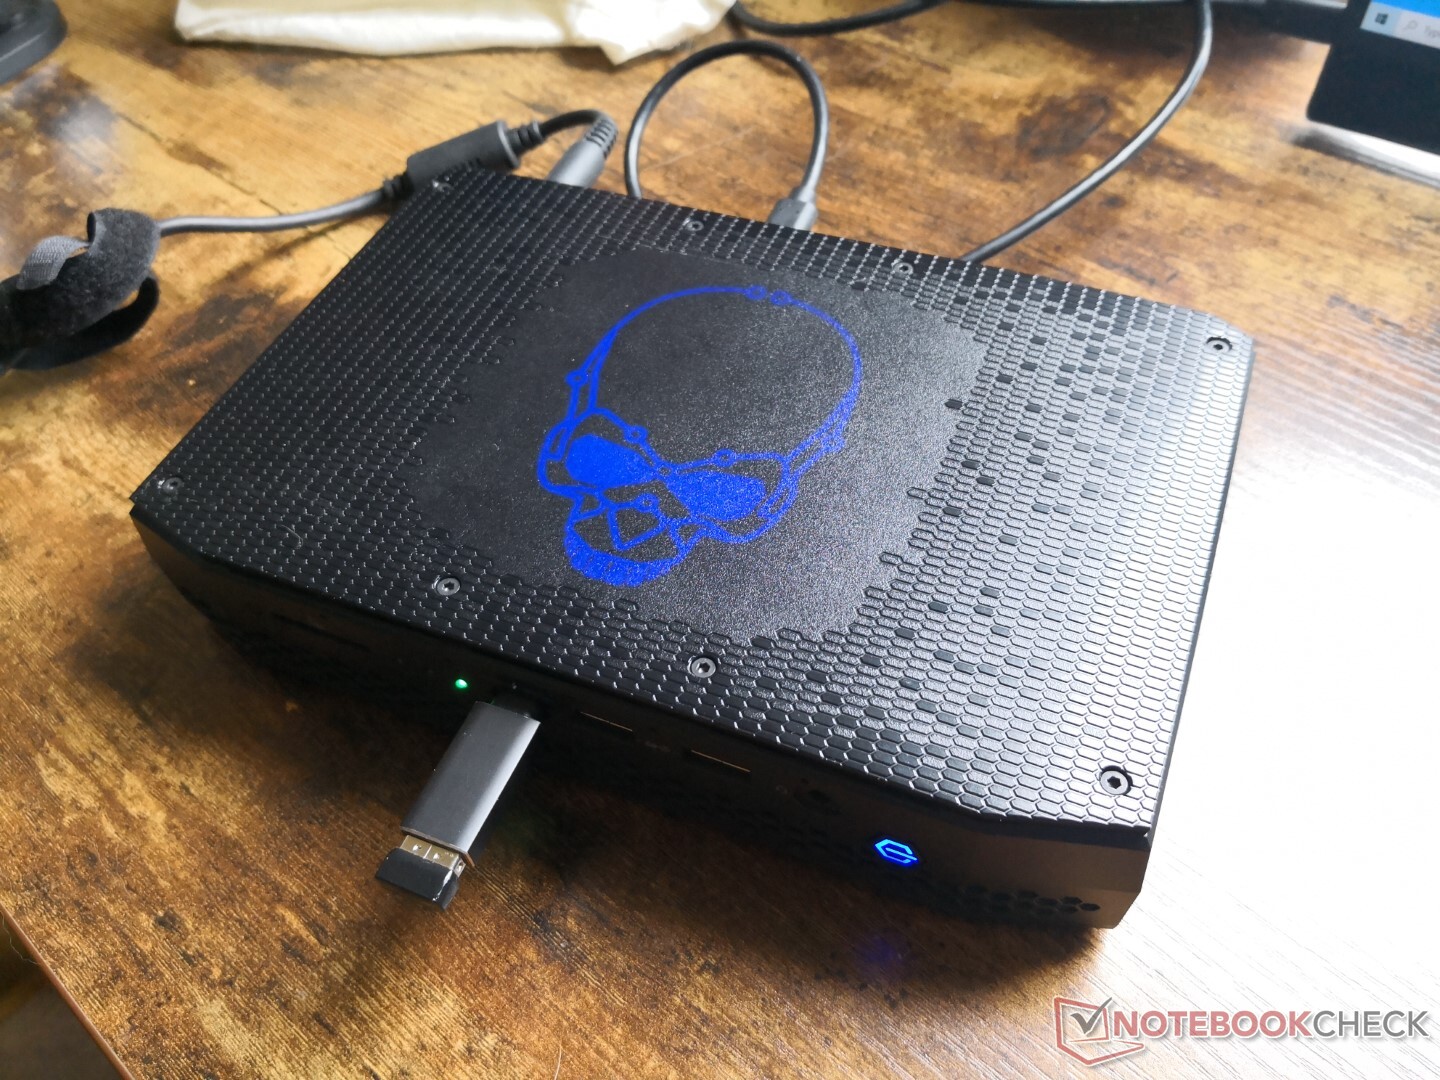
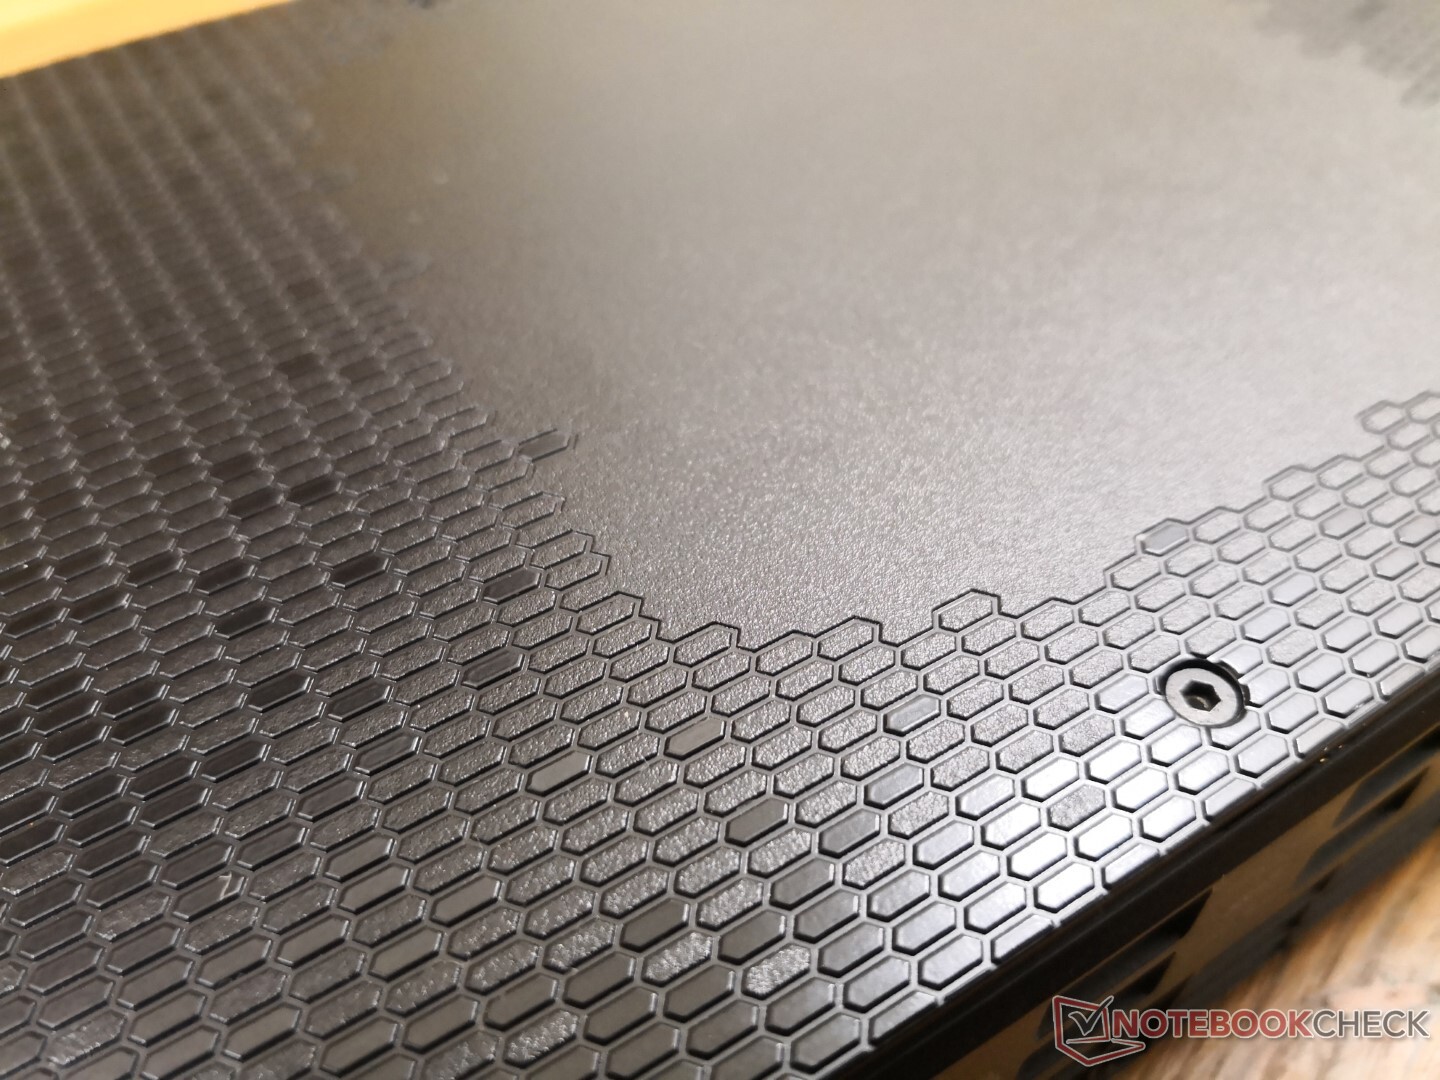
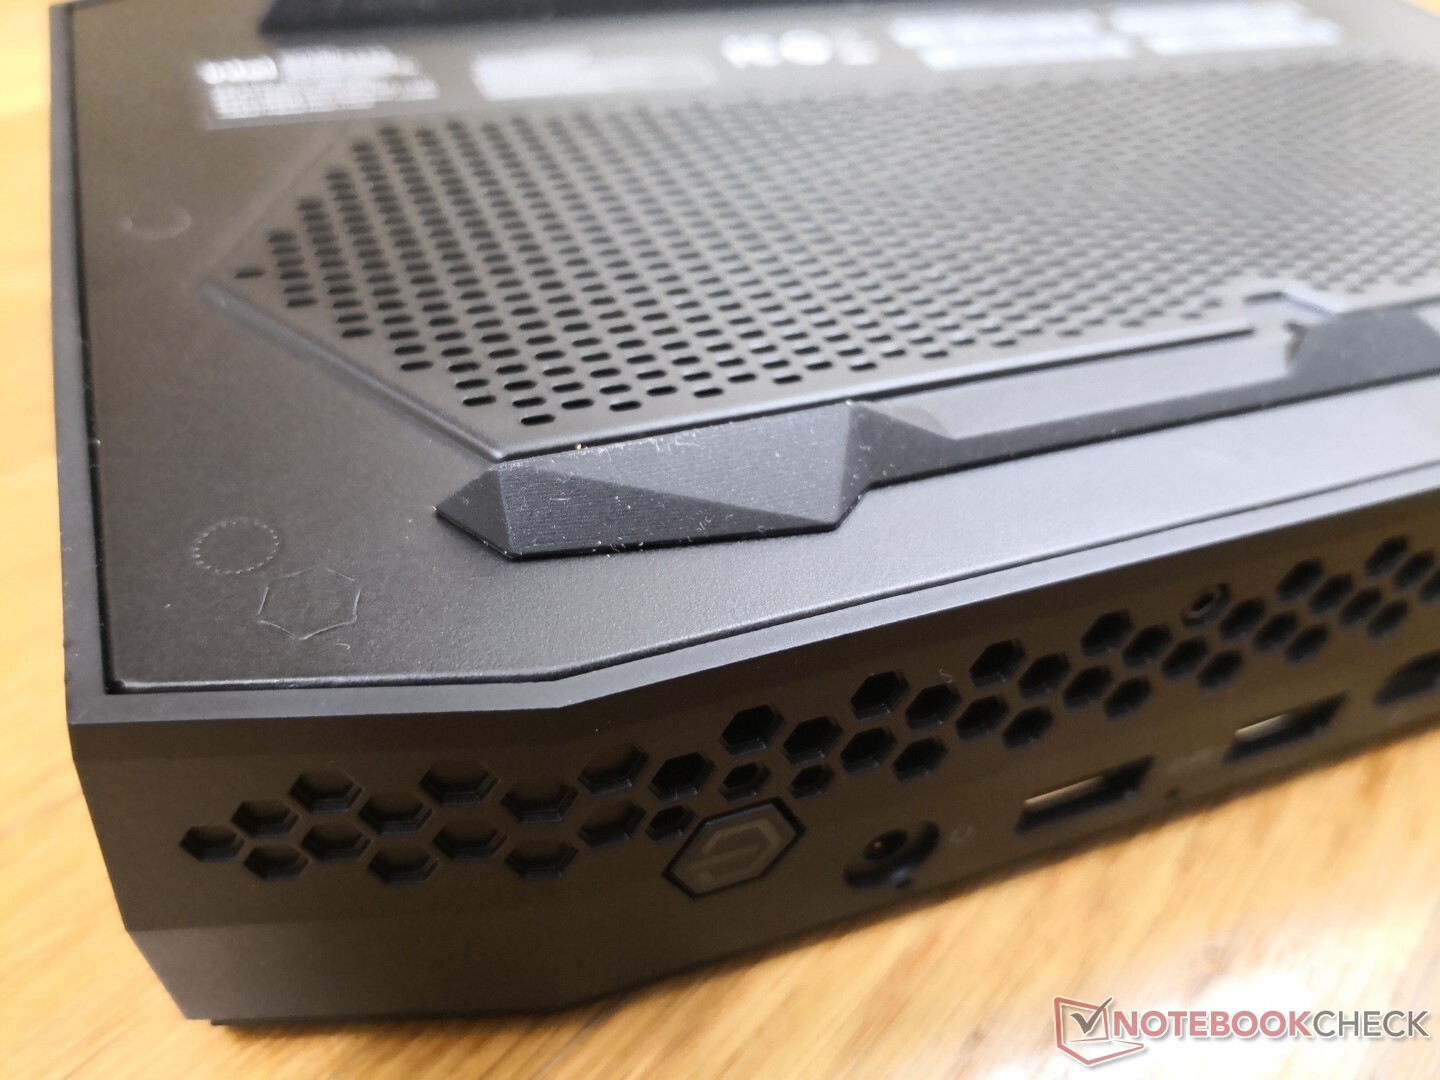
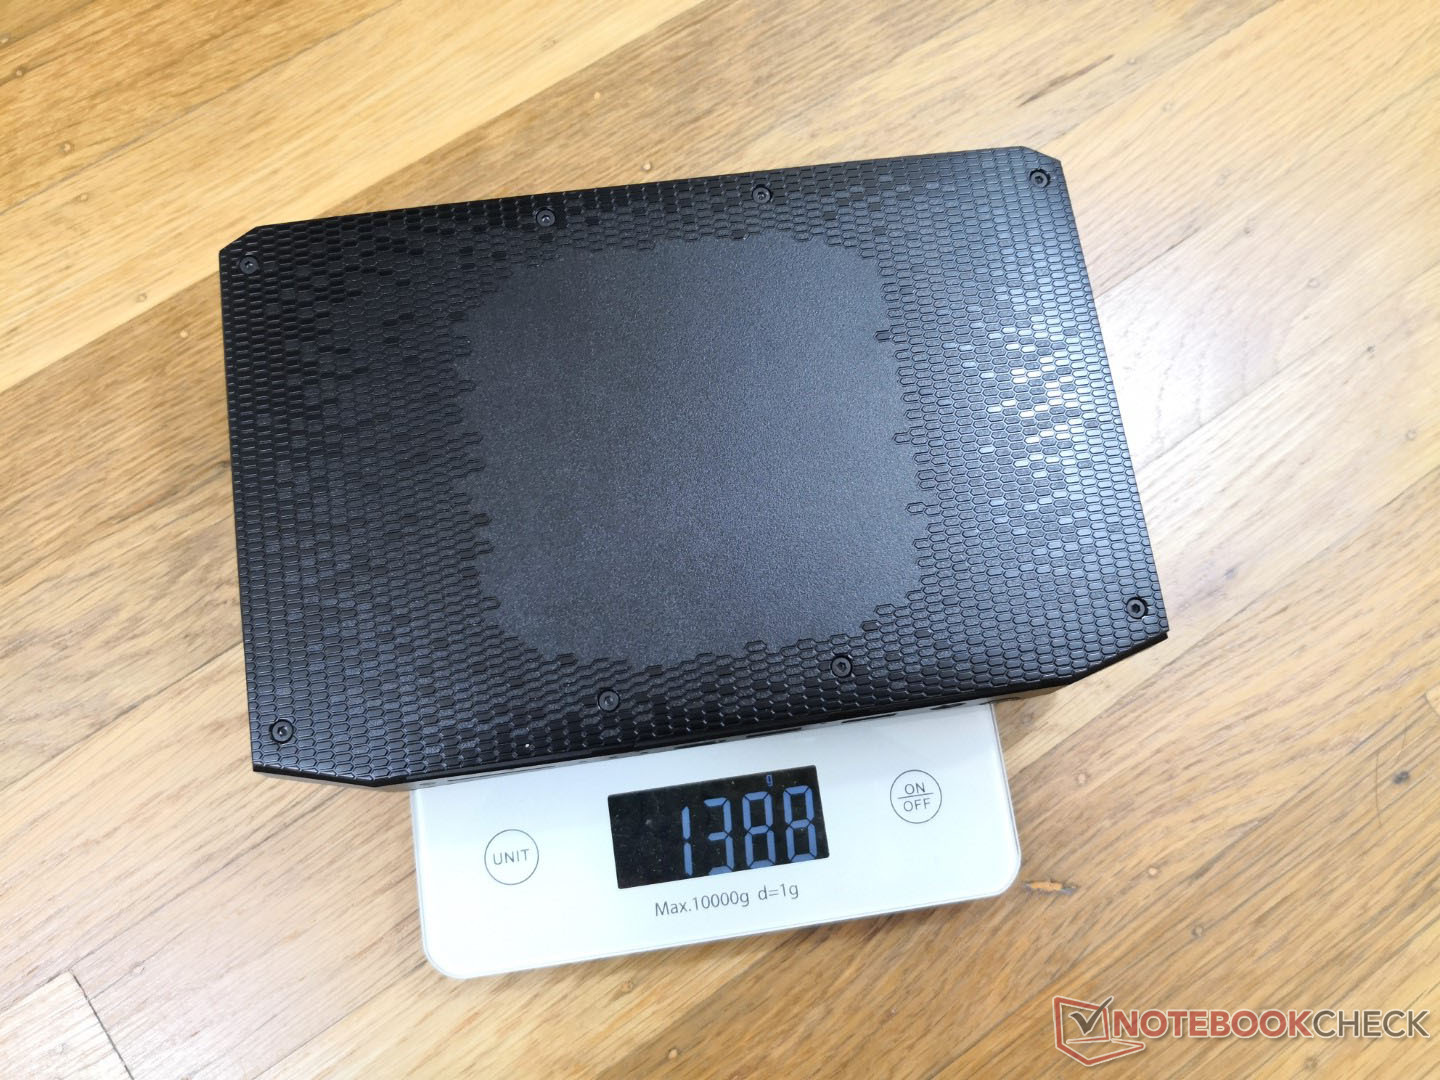
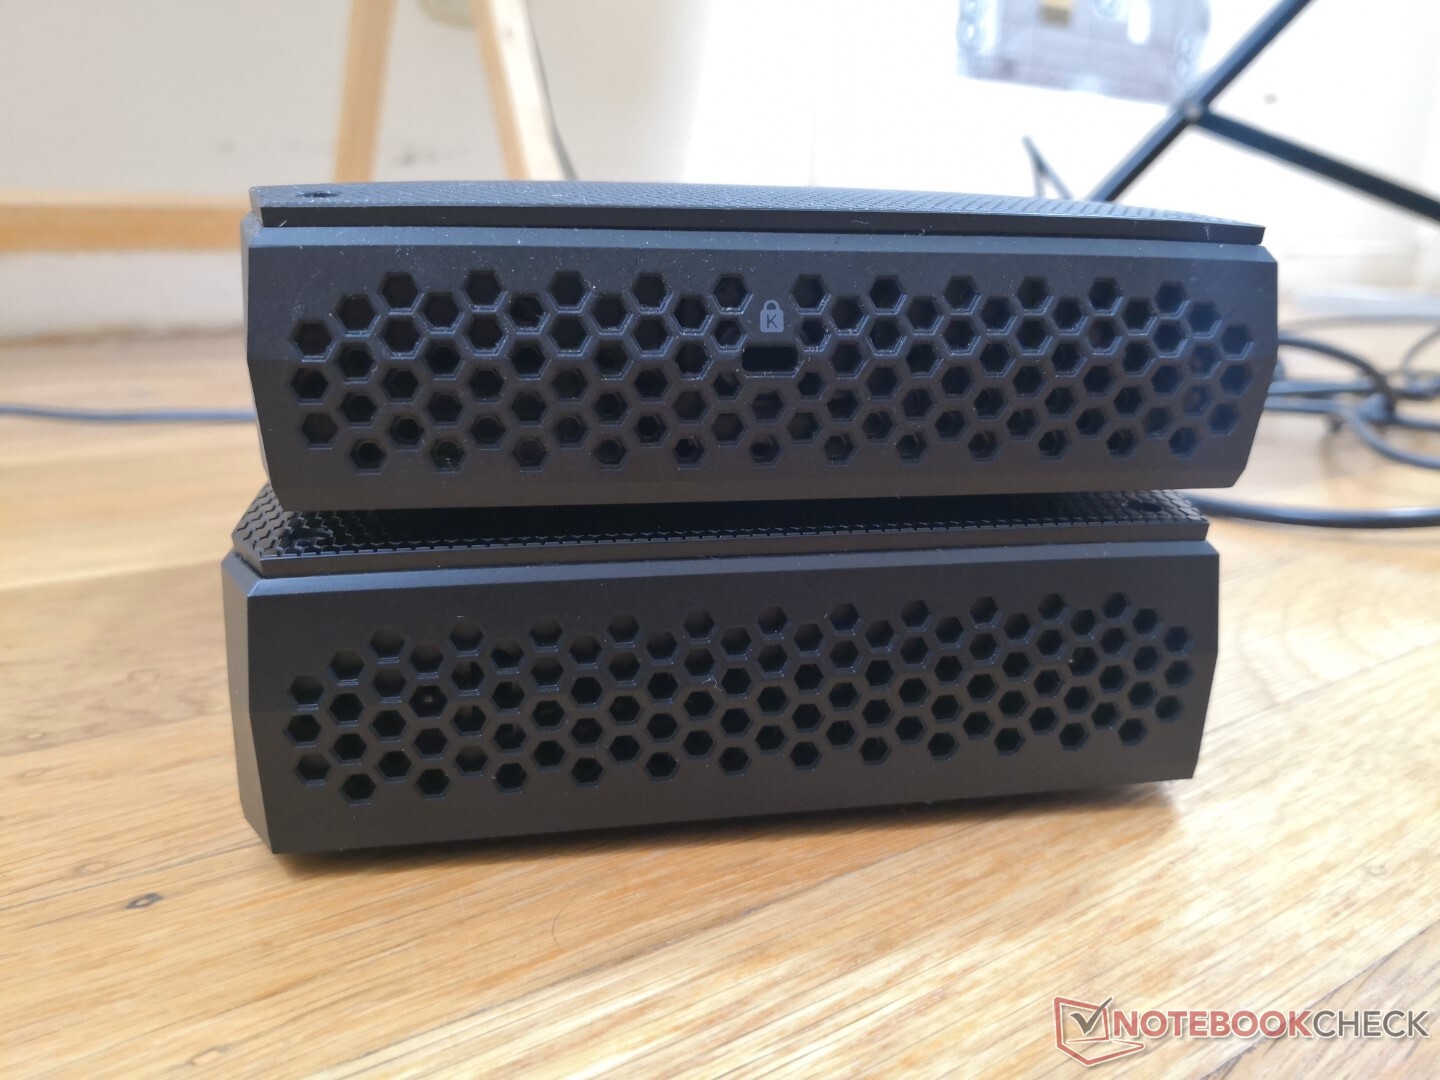
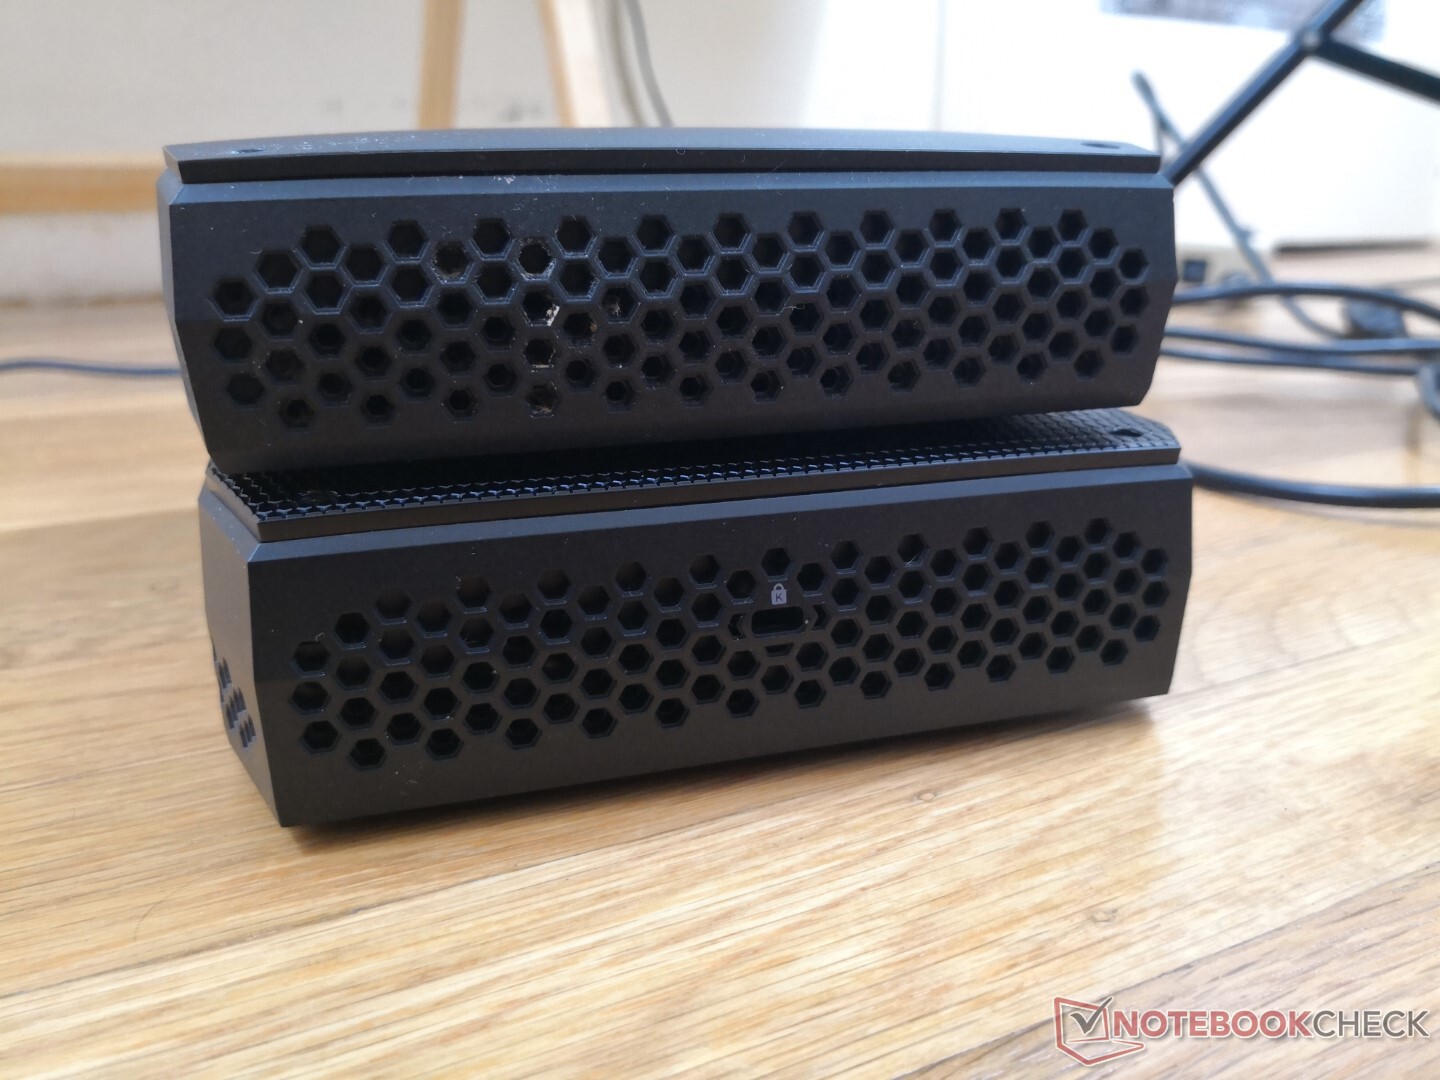
Дизайн и особенности
Материалы нового корпуса, как и его размеры, почти не отличаются от Hades Canyon. Текстура поверхности и вентиляционные отверстия чуть изменились, увеличилась толщина (42 против 39 миллиметров) и вес (1.4 против 1.3 килограмма). С нашей точки зрения перемены объясняются присутствием более мощных компонентов и сменных пластиковых крышек с узором, позволяющих быстро заменить подсвечиваемый череп на подсвечиваемое что-то другое.
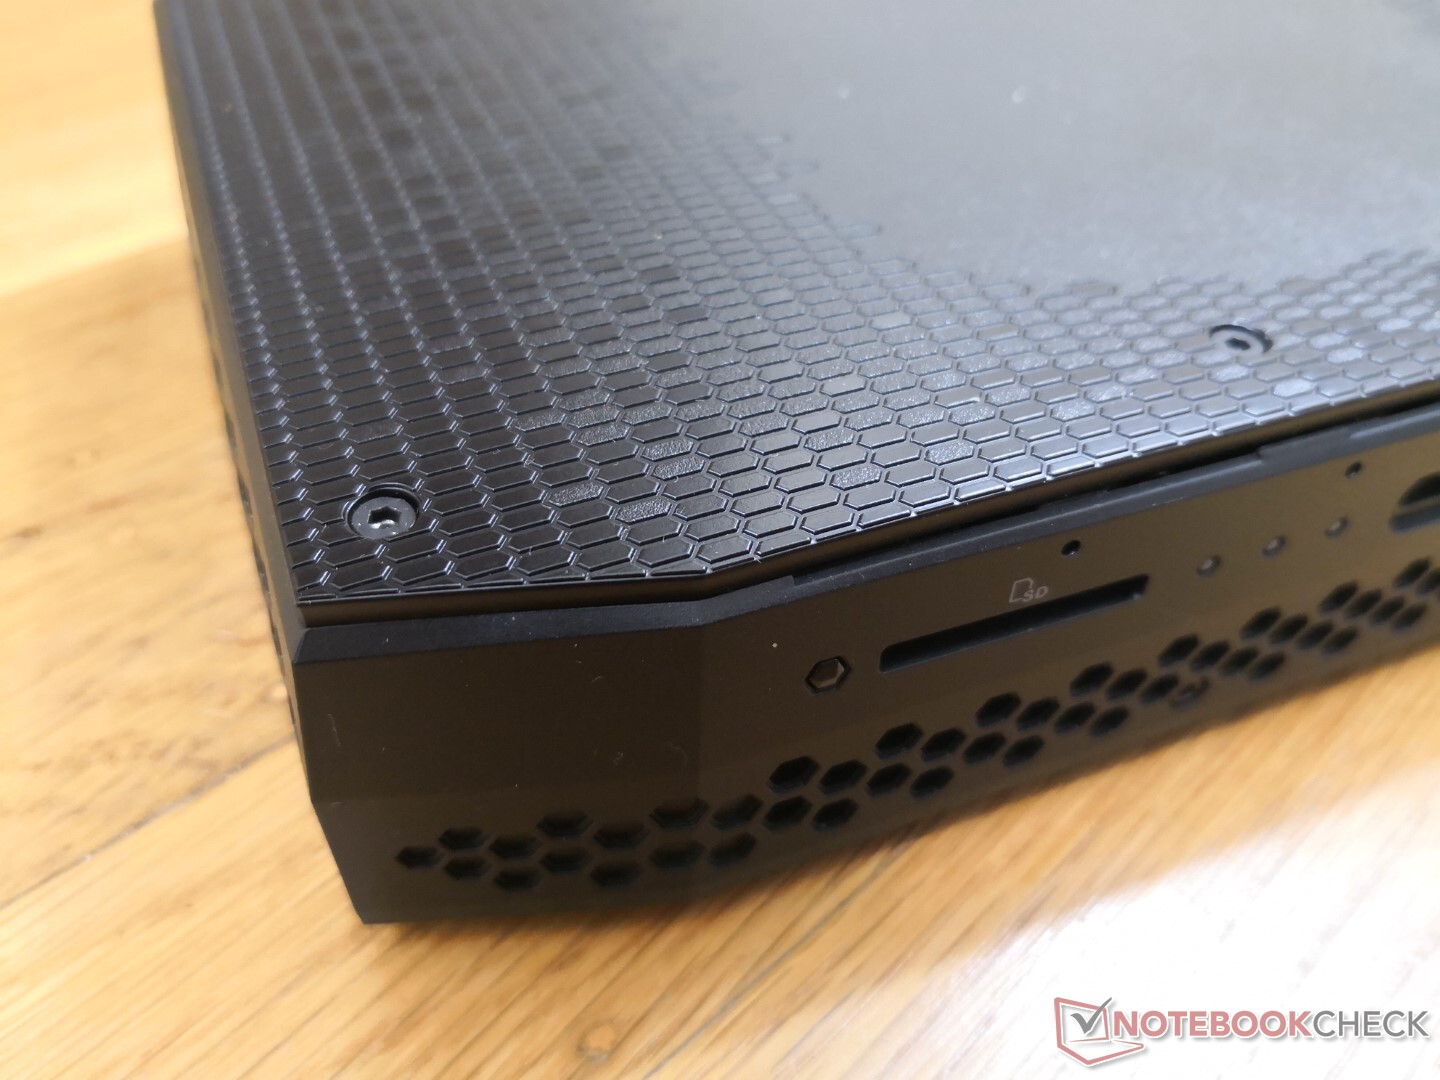
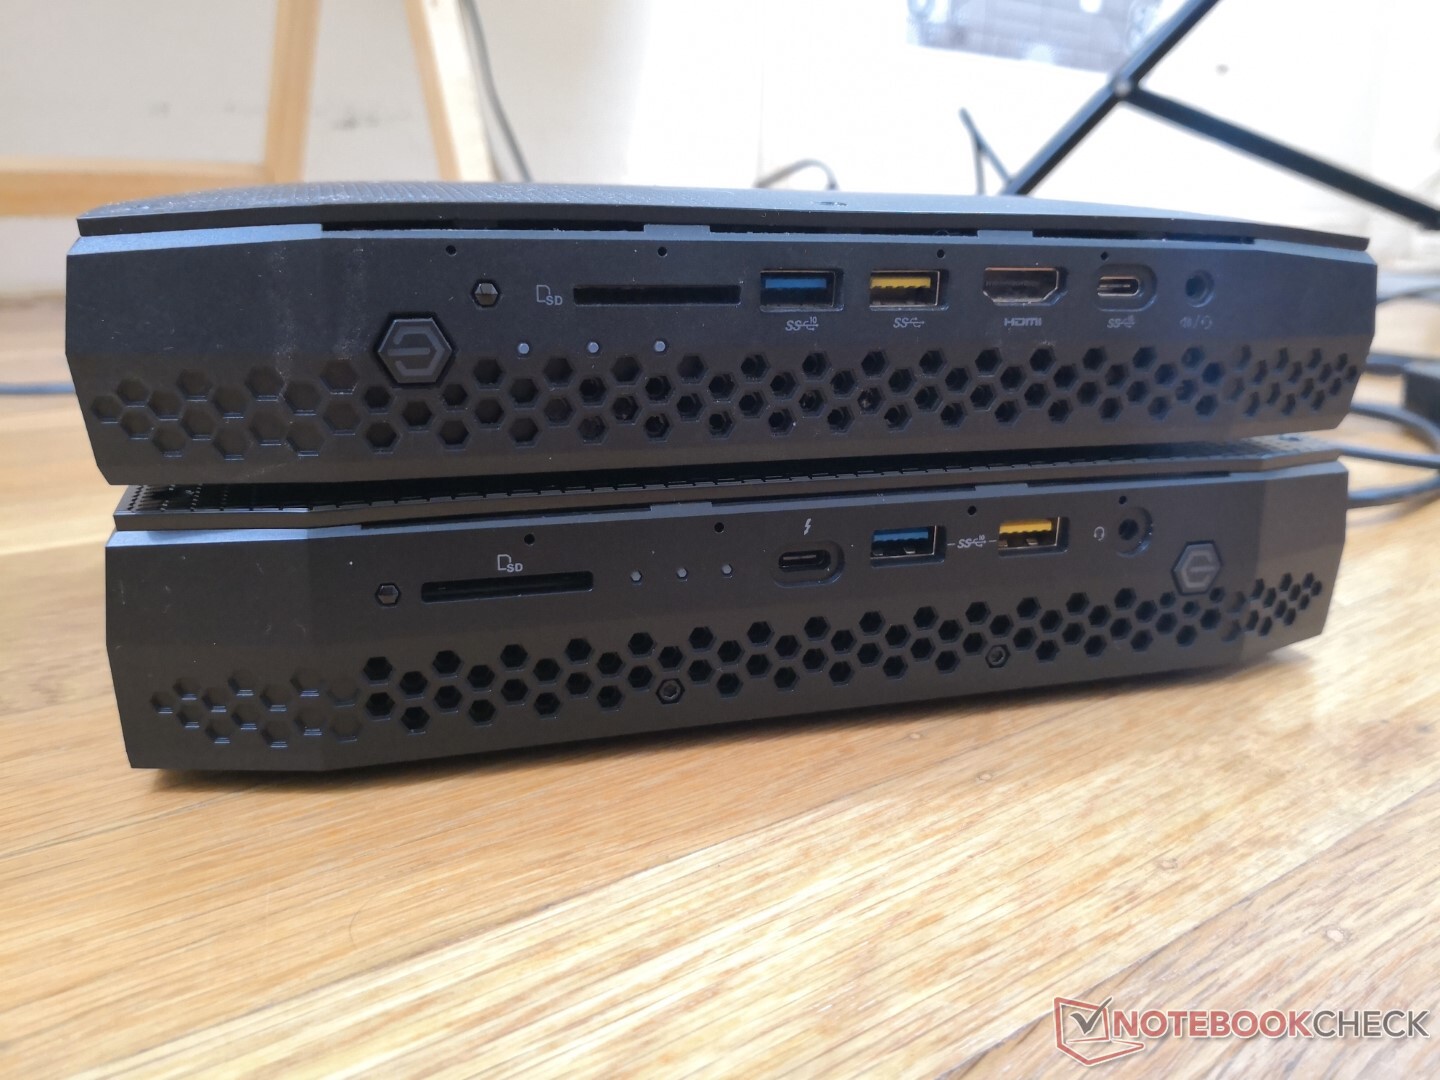
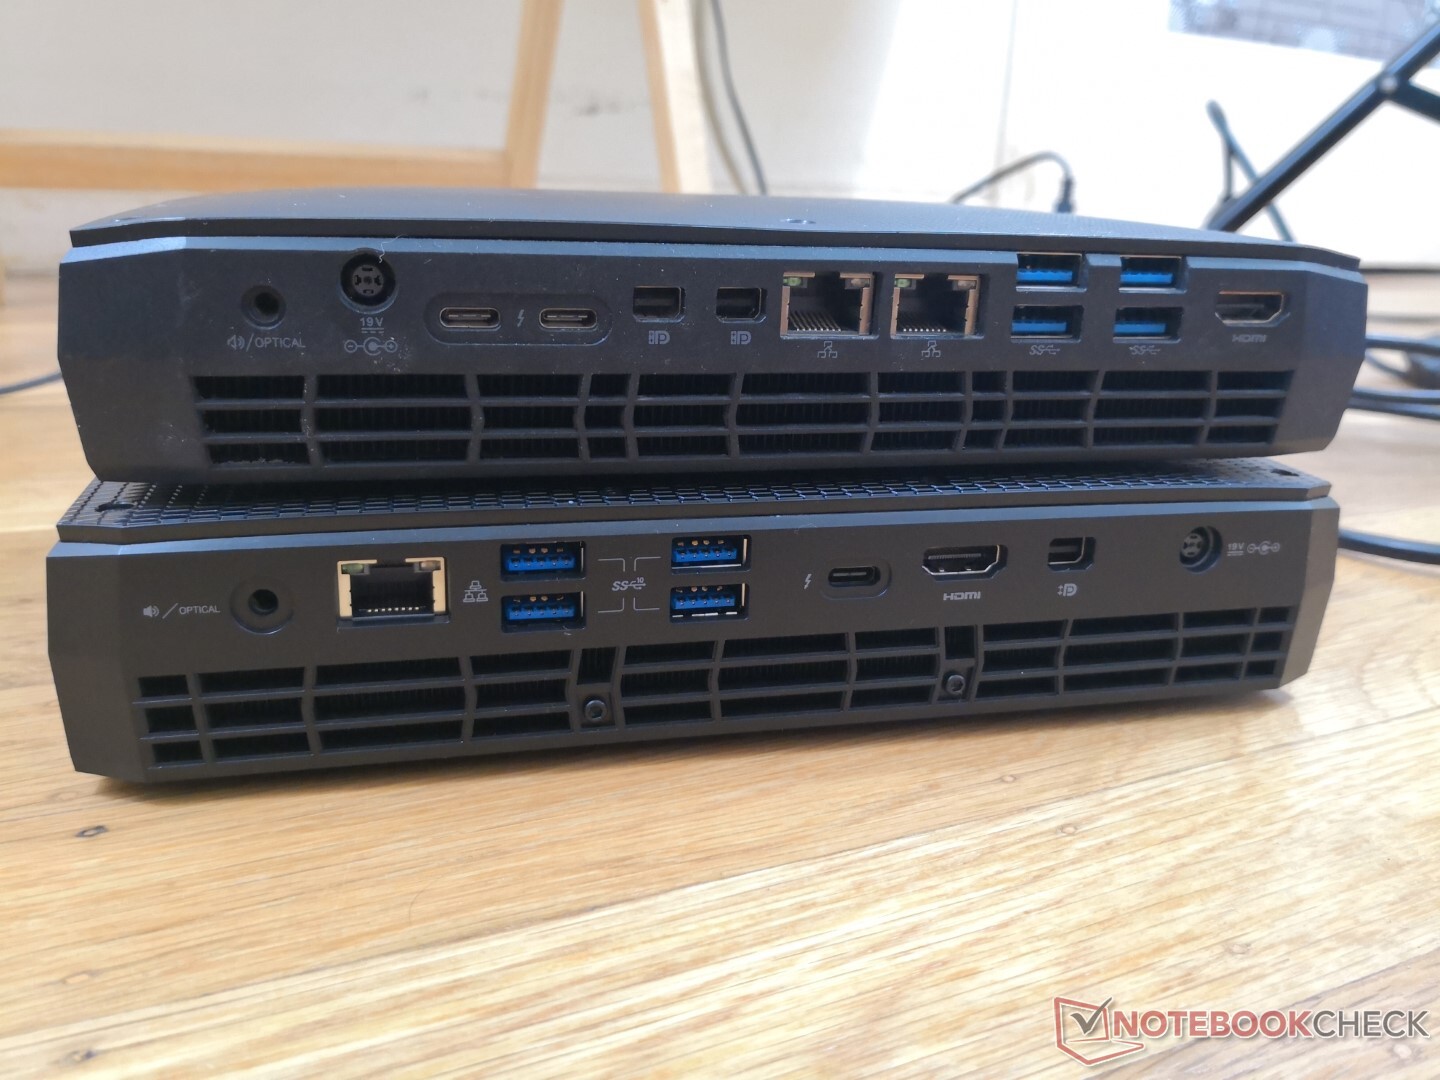
Порты и коммуникации
Набор портов здесь отличается от Hades Canyon. Вместо двух RJ-45 Ethernet, двух HDMI, двух mini-DisplayPort и трёх USB-C здесь присутствует один RJ-45 Ethernet, один HDMI, один mini-DP и два USB-C (они же Thunderbolt 4). Шесть полноразмерных USB перенесены без изменений, как и картридер.
Поддержки получения тока по USB-C нет. Впрочем, под большой нагрузкой этот компьютер требует больше 200 ватт, а лимит PowerDelivery - это сотня.
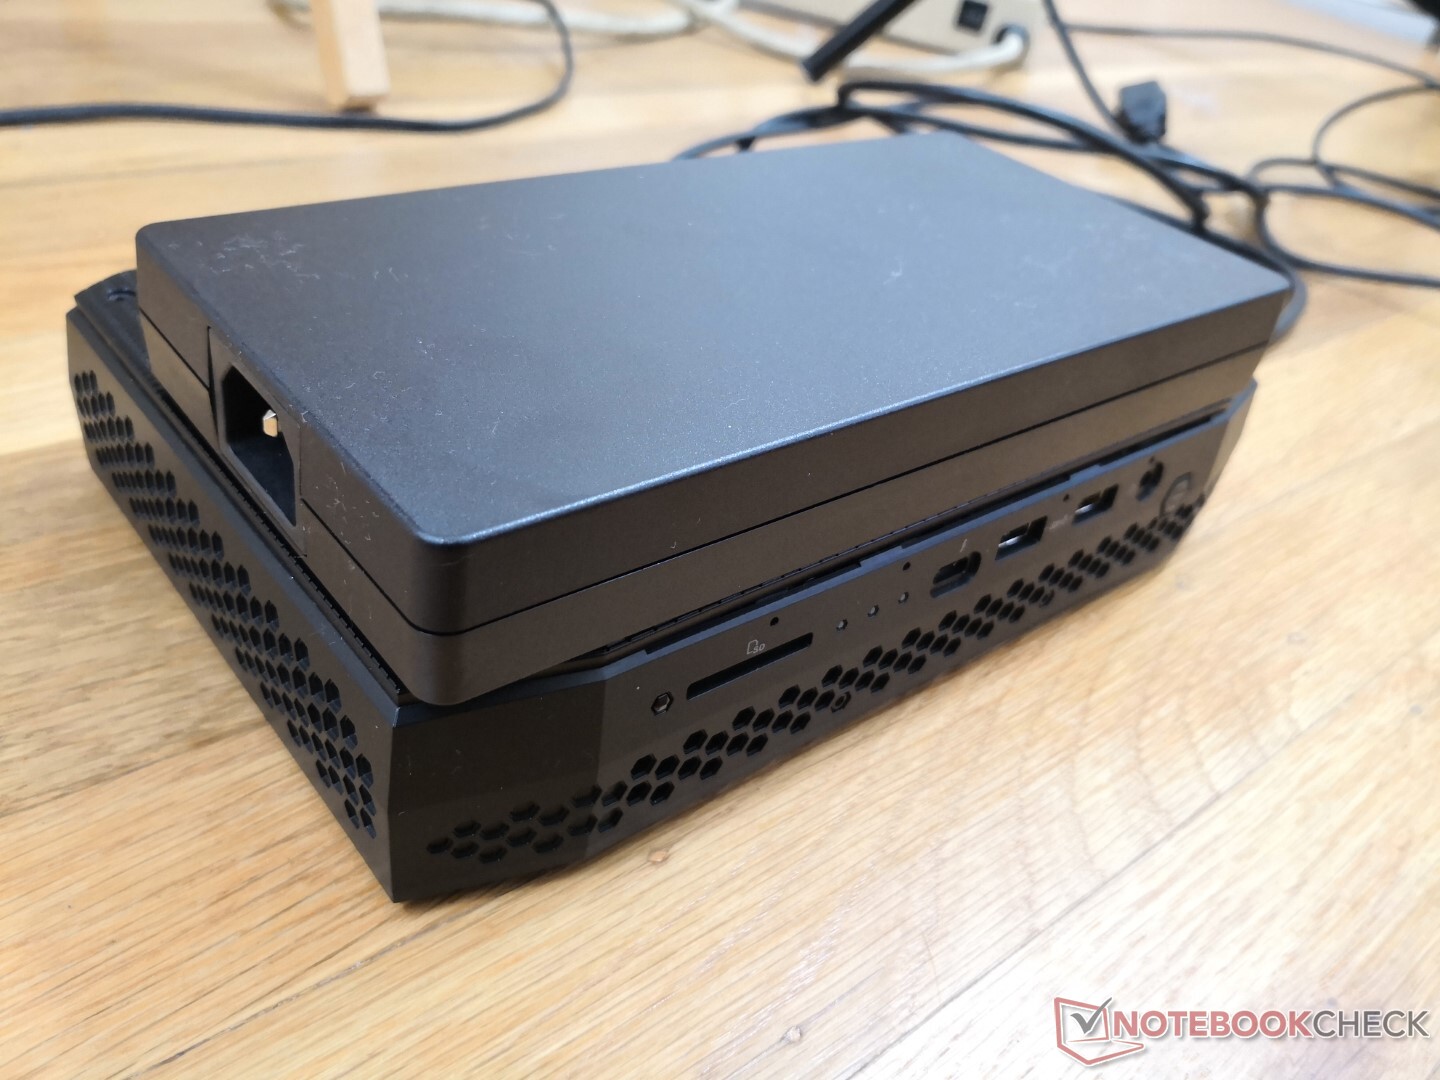
На прикреплённых изображениях мы сравниваем новый NUC 11 Phantom Canyon (снизу) с NUC 8 Hades Canyon.
Картридер
Этот NUC принимает полноразмерные карты SD и работает с ними намного быстрее, чем мог Hades Canyon. Пружинного механизма удержания и подачи карты тут нет, в отличие от типичного ноутбука.
| SD Card Reader | |
| average JPG Copy Test (av. of 3 runs) | |
| Intel NUC11PAQi7 (Toshiba Exceria Pro SDXC 64 GB UHS-II) | |
| Intel NUC11PHKi7C (Toshiba Exceria Pro SDXC 64 GB UHS-II) | |
| Intel Hades Canyon NUC8i7HVK (Toshiba Exceria Pro SDXC 64 GB UHS-II) | |
| Zotac ZBOX Magnus EK71080 (Toshiba Exceria Pro SDXC 64 GB UHS-II) | |
| GMK NucBox 2 (Toshiba Exceria Pro M501 UHS-II) | |
| maximum AS SSD Seq Read Test (1GB) | |
| Intel NUC11PHKi7C (Toshiba Exceria Pro SDXC 64 GB UHS-II) | |
| Intel NUC11PAQi7 (Toshiba Exceria Pro SDXC 64 GB UHS-II) | |
| Intel Hades Canyon NUC8i7HVK (Toshiba Exceria Pro SDXC 64 GB UHS-II) | |
| Zotac ZBOX Magnus EK71080 (Toshiba Exceria Pro SDXC 64 GB UHS-II) | |
| GMK NucBox 2 (Toshiba Exceria Pro M501 UHS-II) | |
Связь
| Networking | |
| iperf3 transmit AX12 | |
| Intel NUC11PHKi7C | |
| Intel NUC11PAQi7 | |
| GMK NucBox 2 | |
| Intel Hades Canyon NUC8i7HVK | |
| Zotac ZBOX Magnus EK71080 | |
| iperf3 receive AX12 | |
| Intel NUC11PHKi7C | |
| Intel NUC11PAQi7 | |
| GMK NucBox 2 | |
| Intel Hades Canyon NUC8i7HVK | |
| Zotac ZBOX Magnus EK71080 | |
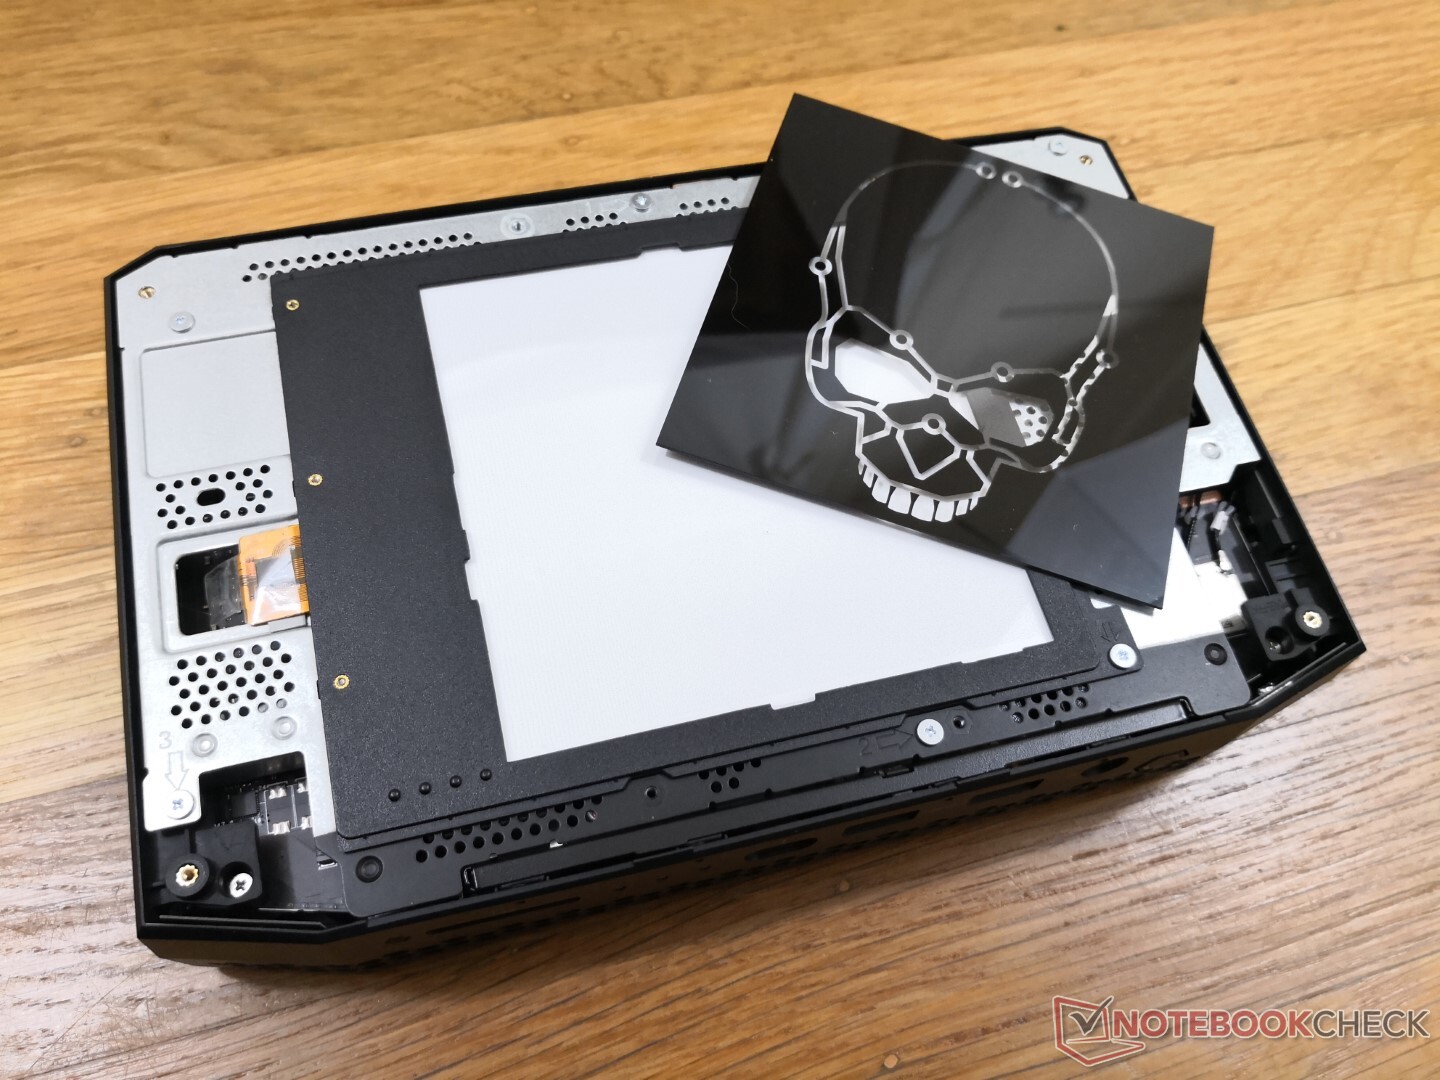
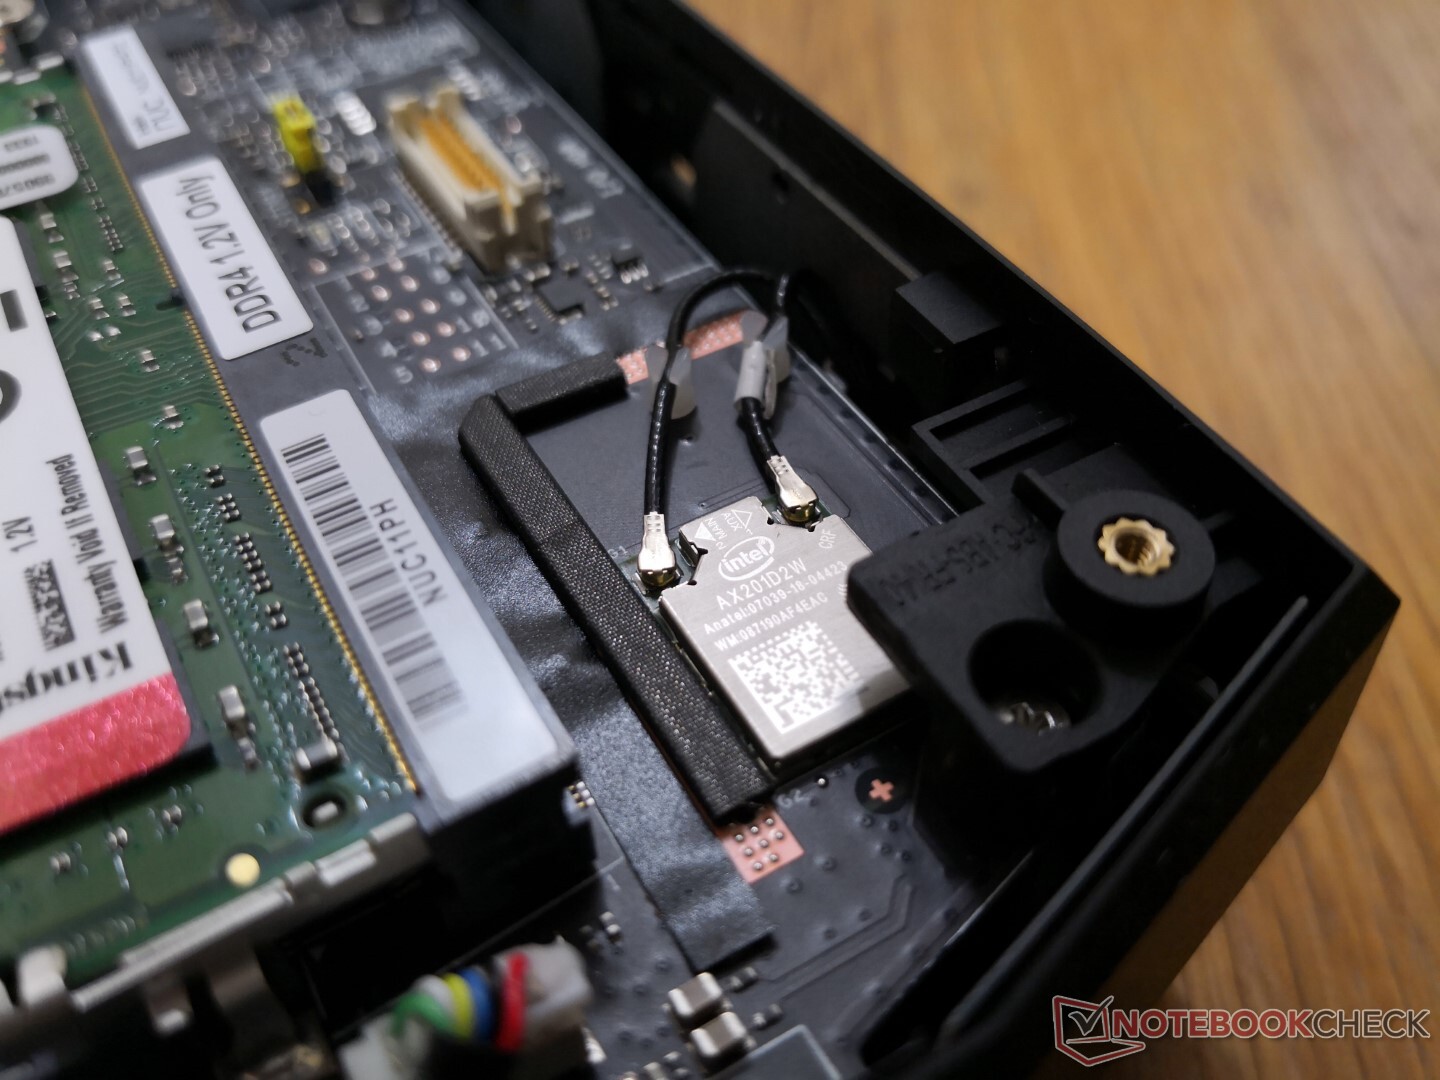
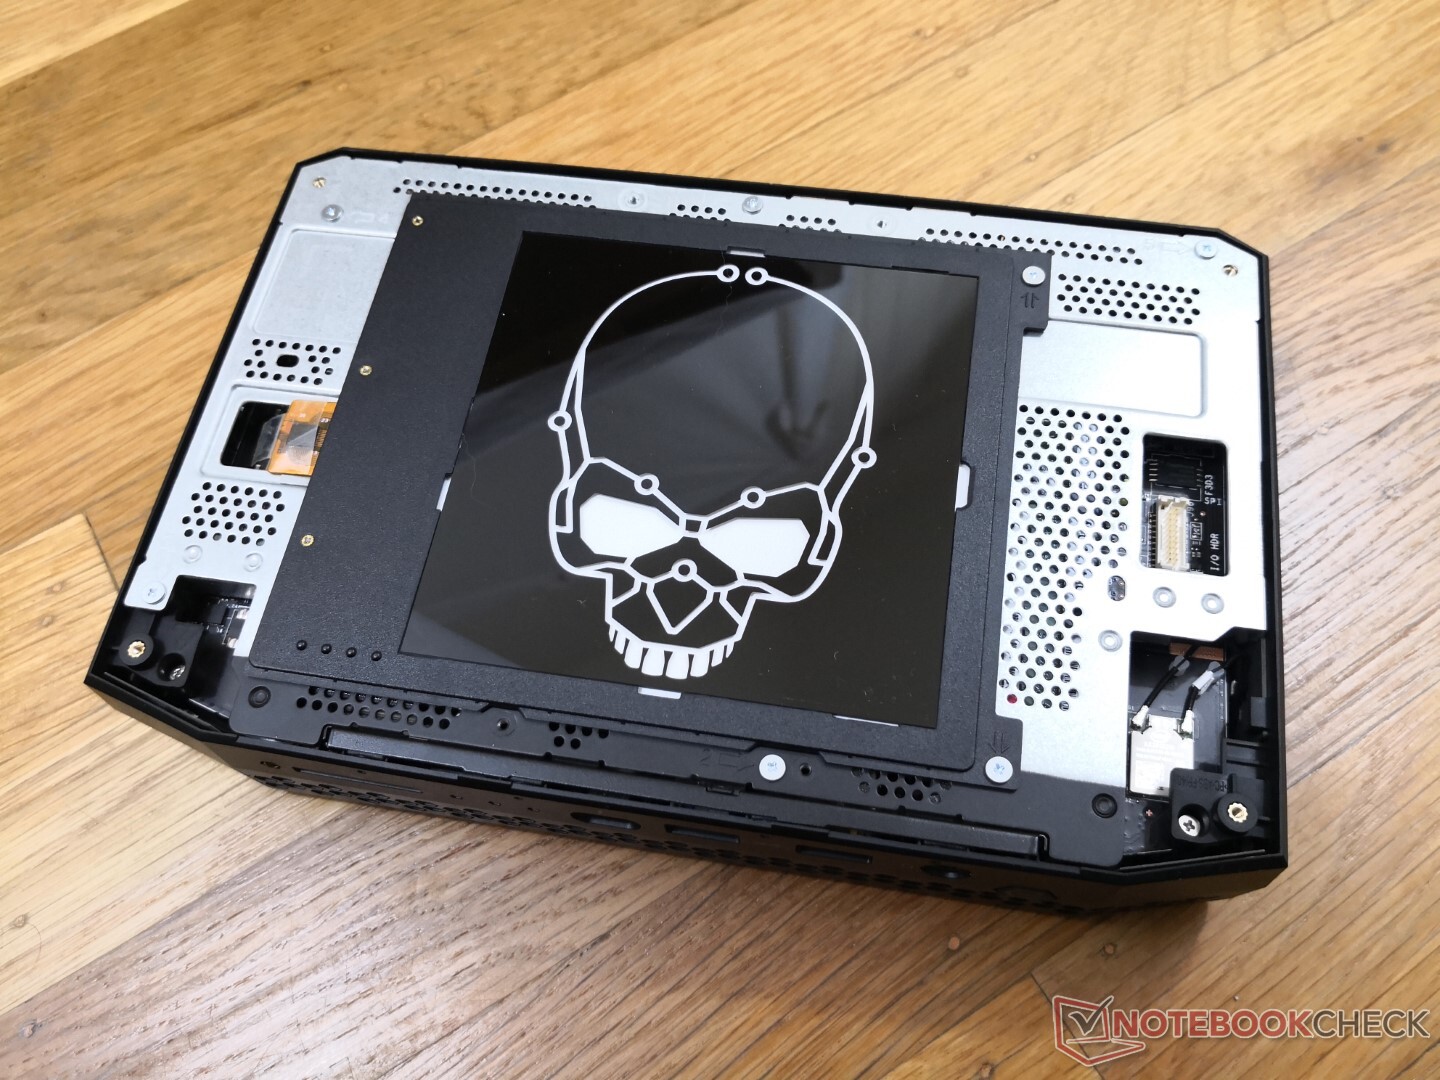
Обслуживание
Верхняя крышка удерживается 8 винтиками с шестигранной головкой. В этой области размещены заменяемая насадка-черепушка и внутренняя металлическая клеть. Чтобы забраться под металлическую клеть, под которой ждут площадки для накопителей и RAM, нужна будет отвёртка Philips. Чтобы добраться до системы охлаждения, нужны дополнительные процедуры по разборке, менее дружелюбные к простому пользователю.
Комплектация и аксессуары. Гарантия
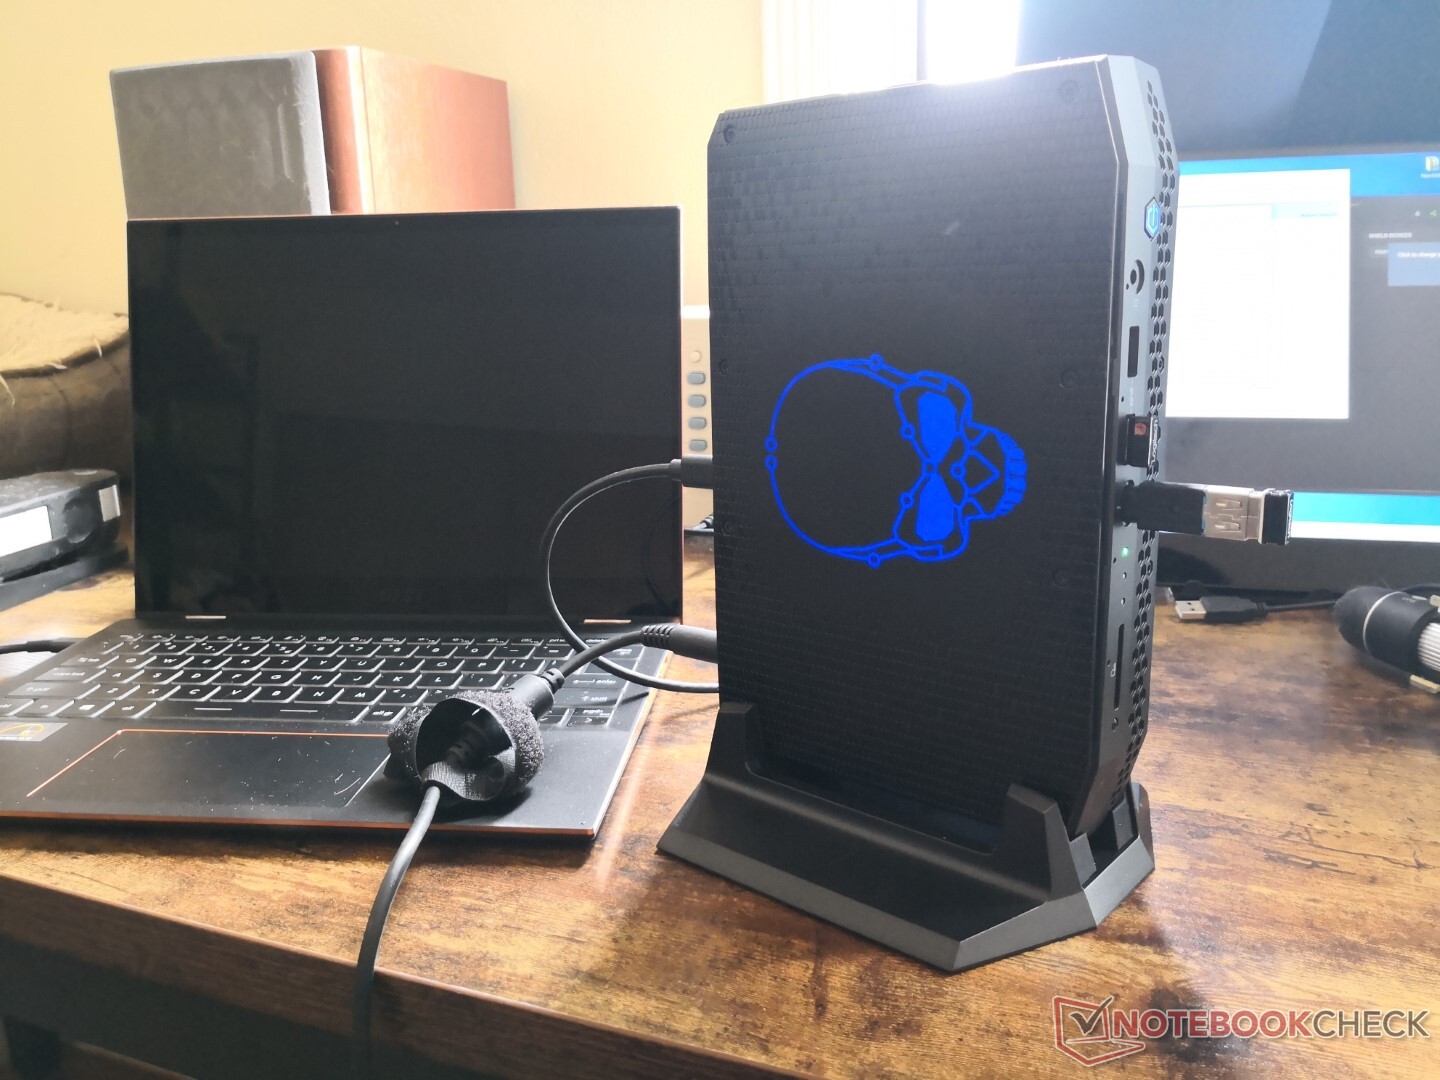
Помимо компьютера и блока питания, в коробке есть крепление VESA с винтиками к нему, пластиковая подставка для вертикального размещения и 5 различных пластиковых насадок на замену черепушке. Подставка нам кажется хорошей, компьютер в ней вряд ли опрокинется. Подставка оставляет под боком NUC дополнительное пространство для вентиляции.
Тестовый NUC предназначен для рынка США и, в пример большинству мини-компьютеров, поставляется с 36-месячной гарантией.
Производительность
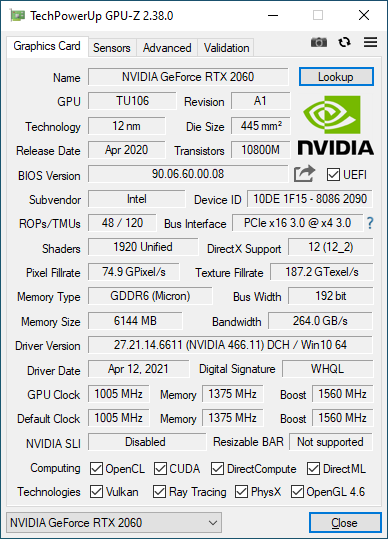
Известные нам конфигурации NUC 11 Enthusiast поставляются с Core i7-1165G7 и GeForce RTX 2060 (для ноутбука). Подчёркиваем, здесь применена мобильная RTX 2060 в полноценном варианте. Это лучше, чем Max-Q версия RTX 2060, но медленнее настольной RTX 2060.
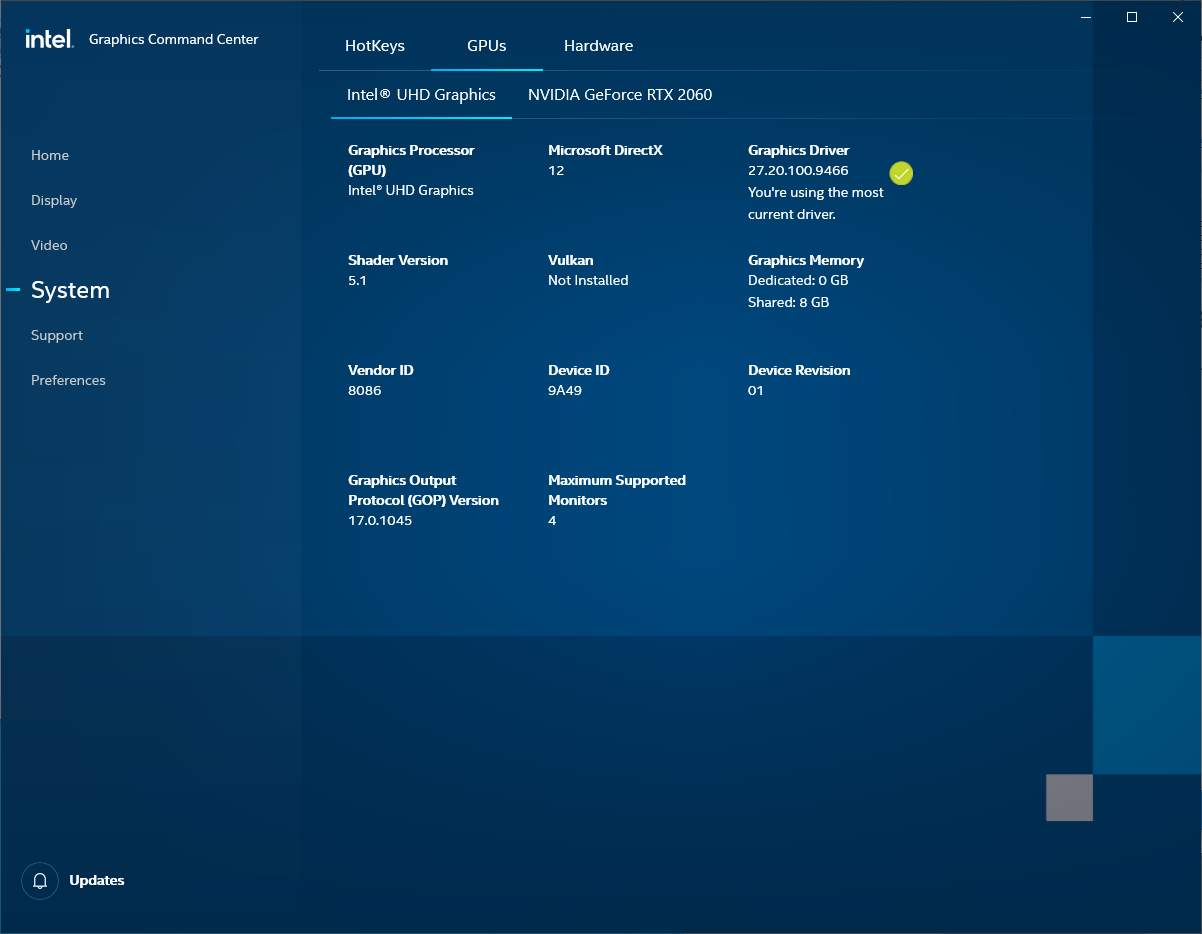
Неттоп поддерживает Optimus для автоматического переключения между RTX 2060 и интегрированным видеопроцессором Intel. Поддержки G-Sync, при этом, нет.
Для проведения наших тестов мы выставили в настройках BIOS/UEFI профиль максимальной производительности. Наши цифры представляют собой максимум, который стоит ждать от этого NUC.
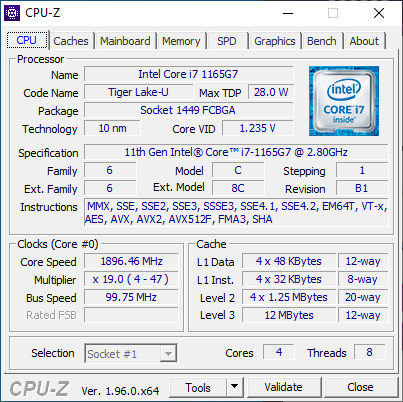
Процессор
Процессорная производительность очень хороша, разница с NUC11PHKi7C держится в пределах пяти процентов. Huawei MateBook X Pro с точно таким же i7-1165G7, как тут, работает на 32% медленнее тестового Phantom Canyon.
Сбалансированный профиль, выставленный в BIOS/UEFI вместо профиля максимальной производительности, уменьшает цифры от многопоточных тестов CineBench на 10....15%.
Новый 1165G7 даёт на 30% больше однопоточной и на 15% больше многопоточной производительности, чем Core i7-8809G из предшествующего NUC. С этим не согласен многопоточный CineBench R20, он выдаёт прежнему NUC больше баллов, чем новому.
Cinebench R15: CPU Multi 64Bit | CPU Single 64Bit
Blender: v2.79 BMW27 CPU
7-Zip 18.03: 7z b 4 -mmt1 | 7z b 4
Geekbench 5.5: Single-Core | Multi-Core
HWBOT x265 Benchmark v2.2: 4k Preset
LibreOffice : 20 Documents To PDF
R Benchmark 2.5: Overall mean
| Cinebench R20 / CPU (Multi Core) | |
| Lenovo Legion C7 15IMH05 82EH0030GE | |
| Asus ZenBook 13 UM325S | |
| Zotac ZBOX Magnus EN72070V | |
| Lenovo ThinkBook 15p Gen1 4K | |
| Intel Hades Canyon NUC8i7HVK | |
| Intel NUC11TNKi5 | |
| Усредн. модель с Intel Core i7-1165G7 (1060 - 2657, n=81) | |
| Intel NUC11PHKi7C | |
| Beelink GTR35 II-G-16512D00W64PRO-1T | |
| Asus VivoBook S13 S333JA-DS51 | |
| Asus Zenbook S UX393JA | |
| Beelink SEi10 | |
| Cinebench R20 / CPU (Single Core) | |
| Intel NUC11PHKi7C | |
| Asus ZenBook 13 UM325S | |
| Усредн. модель с Intel Core i7-1165G7 (442 - 589, n=81) | |
| Intel NUC11TNKi5 | |
| Zotac ZBOX Magnus EN72070V | |
| Lenovo Legion C7 15IMH05 82EH0030GE | |
| Lenovo ThinkBook 15p Gen1 4K | |
| Asus Zenbook S UX393JA | |
| Intel Hades Canyon NUC8i7HVK | |
| Beelink SEi10 | |
| Asus VivoBook S13 S333JA-DS51 | |
| Beelink GTR35 II-G-16512D00W64PRO-1T | |
| Cinebench R15 / CPU Multi 64Bit | |
| Lenovo Legion C7 15IMH05 82EH0030GE | |
| Asus ZenBook 13 UM325S | |
| Lenovo ThinkBook 15p Gen1 4K | |
| Zotac ZBOX Magnus EN72070V | |
| Intel NUC11PHKi7C | |
| Intel Hades Canyon NUC8i7HVK | |
| Усредн. модель с Intel Core i7-1165G7 (553 - 1027, n=86) | |
| Intel NUC11TNKi5 | |
| Beelink GTR35 II-G-16512D00W64PRO-1T | |
| Asus VivoBook S13 S333JA-DS51 | |
| Asus Zenbook S UX393JA | |
| Beelink SEi10 | |
| Cinebench R15 / CPU Single 64Bit | |
| Intel NUC11PHKi7C | |
| Asus ZenBook 13 UM325S | |
| Усредн. модель с Intel Core i7-1165G7 (115 - 230, n=78) | |
| Lenovo Legion C7 15IMH05 82EH0030GE | |
| Intel NUC11TNKi5 | |
| Lenovo ThinkBook 15p Gen1 4K | |
| Zotac ZBOX Magnus EN72070V | |
| Asus Zenbook S UX393JA | |
| Intel Hades Canyon NUC8i7HVK | |
| Beelink SEi10 | |
| Beelink GTR35 II-G-16512D00W64PRO-1T | |
| Asus VivoBook S13 S333JA-DS51 | |
| Blender / v2.79 BMW27 CPU | |
| Beelink SEi10 | |
| Asus Zenbook S UX393JA | |
| Asus VivoBook S13 S333JA-DS51 | |
| Beelink GTR35 II-G-16512D00W64PRO-1T | |
| Усредн. модель с Intel Core i7-1165G7 (468 - 1138, n=80) | |
| Intel NUC11TNKi5 | |
| Intel NUC11PHKi7C | |
| Intel Hades Canyon NUC8i7HVK | |
| Lenovo ThinkBook 15p Gen1 4K | |
| Zotac ZBOX Magnus EN72070V | |
| Asus ZenBook 13 UM325S | |
| Lenovo Legion C7 15IMH05 82EH0030GE | |
| 7-Zip 18.03 / 7z b 4 -mmt1 | |
| Lenovo Legion C7 15IMH05 82EH0030GE | |
| Asus ZenBook 13 UM325S | |
| Intel NUC11PHKi7C | |
| Усредн. модель с Intel Core i7-1165G7 (4478 - 5507, n=80) | |
| Lenovo ThinkBook 15p Gen1 4K | |
| Zotac ZBOX Magnus EN72070V | |
| Intel NUC11TNKi5 | |
| Asus Zenbook S UX393JA | |
| Intel Hades Canyon NUC8i7HVK | |
| Beelink SEi10 | |
| Asus VivoBook S13 S333JA-DS51 | |
| Beelink GTR35 II-G-16512D00W64PRO-1T | |
| 7-Zip 18.03 / 7z b 4 | |
| Lenovo Legion C7 15IMH05 82EH0030GE | |
| Asus ZenBook 13 UM325S | |
| Zotac ZBOX Magnus EN72070V | |
| Lenovo ThinkBook 15p Gen1 4K | |
| Intel NUC11PHKi7C | |
| Intel NUC11TNKi5 | |
| Усредн. модель с Intel Core i7-1165G7 (15347 - 27405, n=80) | |
| Intel Hades Canyon NUC8i7HVK | |
| Asus Zenbook S UX393JA | |
| Asus VivoBook S13 S333JA-DS51 | |
| Beelink GTR35 II-G-16512D00W64PRO-1T | |
| Beelink SEi10 | |
| Geekbench 5.5 / Single-Core | |
| Intel NUC11PHKi7C | |
| Усредн. модель с Intel Core i7-1165G7 (1302 - 1595, n=77) | |
| Asus ZenBook 13 UM325S | |
| Intel NUC11TNKi5 | |
| Asus Zenbook S UX393JA | |
| Lenovo Legion C7 15IMH05 82EH0030GE | |
| Lenovo ThinkBook 15p Gen1 4K | |
| Zotac ZBOX Magnus EN72070V | |
| Asus VivoBook S13 S333JA-DS51 | |
| Beelink SEi10 | |
| Beelink GTR35 II-G-16512D00W64PRO-1T | |
| Geekbench 5.5 / Multi-Core | |
| Lenovo Legion C7 15IMH05 82EH0030GE | |
| Asus ZenBook 13 UM325S | |
| Lenovo ThinkBook 15p Gen1 4K | |
| Zotac ZBOX Magnus EN72070V | |
| Intel NUC11PHKi7C | |
| Усредн. модель с Intel Core i7-1165G7 (3078 - 5926, n=77) | |
| Asus Zenbook S UX393JA | |
| Intel NUC11TNKi5 | |
| Asus VivoBook S13 S333JA-DS51 | |
| Beelink GTR35 II-G-16512D00W64PRO-1T | |
| Beelink SEi10 | |
| HWBOT x265 Benchmark v2.2 / 4k Preset | |
| Lenovo Legion C7 15IMH05 82EH0030GE | |
| Asus ZenBook 13 UM325S | |
| Zotac ZBOX Magnus EN72070V | |
| Lenovo ThinkBook 15p Gen1 4K | |
| Intel NUC11PHKi7C | |
| Intel Hades Canyon NUC8i7HVK | |
| Intel NUC11TNKi5 | |
| Усредн. модель с Intel Core i7-1165G7 (1.39 - 8.47, n=80) | |
| Asus VivoBook S13 S333JA-DS51 | |
| Asus Zenbook S UX393JA | |
| Beelink GTR35 II-G-16512D00W64PRO-1T | |
| Beelink SEi10 | |
| LibreOffice / 20 Documents To PDF | |
| Beelink GTR35 II-G-16512D00W64PRO-1T | |
| Asus VivoBook S13 S333JA-DS51 | |
| Zotac ZBOX Magnus EN72070V | |
| Lenovo ThinkBook 15p Gen1 4K | |
| Lenovo Legion C7 15IMH05 82EH0030GE | |
| Beelink SEi10 | |
| Asus ZenBook 13 UM325S | |
| Intel NUC11TNKi5 | |
| Усредн. модель с Intel Core i7-1165G7 (21.5 - 88.1, n=78) | |
| Asus Zenbook S UX393JA | |
| Intel NUC11PHKi7C | |
| R Benchmark 2.5 / Overall mean | |
| Asus VivoBook S13 S333JA-DS51 | |
| Beelink SEi10 | |
| Beelink GTR35 II-G-16512D00W64PRO-1T | |
| Asus Zenbook S UX393JA | |
| Intel NUC11TNKi5 | |
| Lenovo ThinkBook 15p Gen1 4K | |
| Zotac ZBOX Magnus EN72070V | |
| Усредн. модель с Intel Core i7-1165G7 (0.552 - 1.002, n=80) | |
| Lenovo Legion C7 15IMH05 82EH0030GE | |
| Intel NUC11PHKi7C | |
| Asus ZenBook 13 UM325S | |
* ... меньше = лучше
Общесистемная производительность
| PCMark 10 | |
| Score | |
| Intel NUC11PHKi7C | |
| Aorus Gaming Box GeForce RTX 2080 Ti | |
| Intel Hades Canyon NUC8i7HVK | |
| Zotac ZBOX Magnus EK71080 | |
| Intel NUC11PAQi7 | |
| GMK NucBox 2 | |
| Essentials | |
| Intel NUC11PAQi7 | |
| Aorus Gaming Box GeForce RTX 2080 Ti | |
| Intel NUC11PHKi7C | |
| Intel Hades Canyon NUC8i7HVK | |
| GMK NucBox 2 | |
| Zotac ZBOX Magnus EK71080 | |
| Productivity | |
| Intel NUC11PHKi7C | |
| Aorus Gaming Box GeForce RTX 2080 Ti | |
| Intel Hades Canyon NUC8i7HVK | |
| Intel NUC11PAQi7 | |
| Zotac ZBOX Magnus EK71080 | |
| GMK NucBox 2 | |
| Digital Content Creation | |
| Intel NUC11PHKi7C | |
| Zotac ZBOX Magnus EK71080 | |
| Aorus Gaming Box GeForce RTX 2080 Ti | |
| Intel Hades Canyon NUC8i7HVK | |
| Intel NUC11PAQi7 | |
| GMK NucBox 2 | |
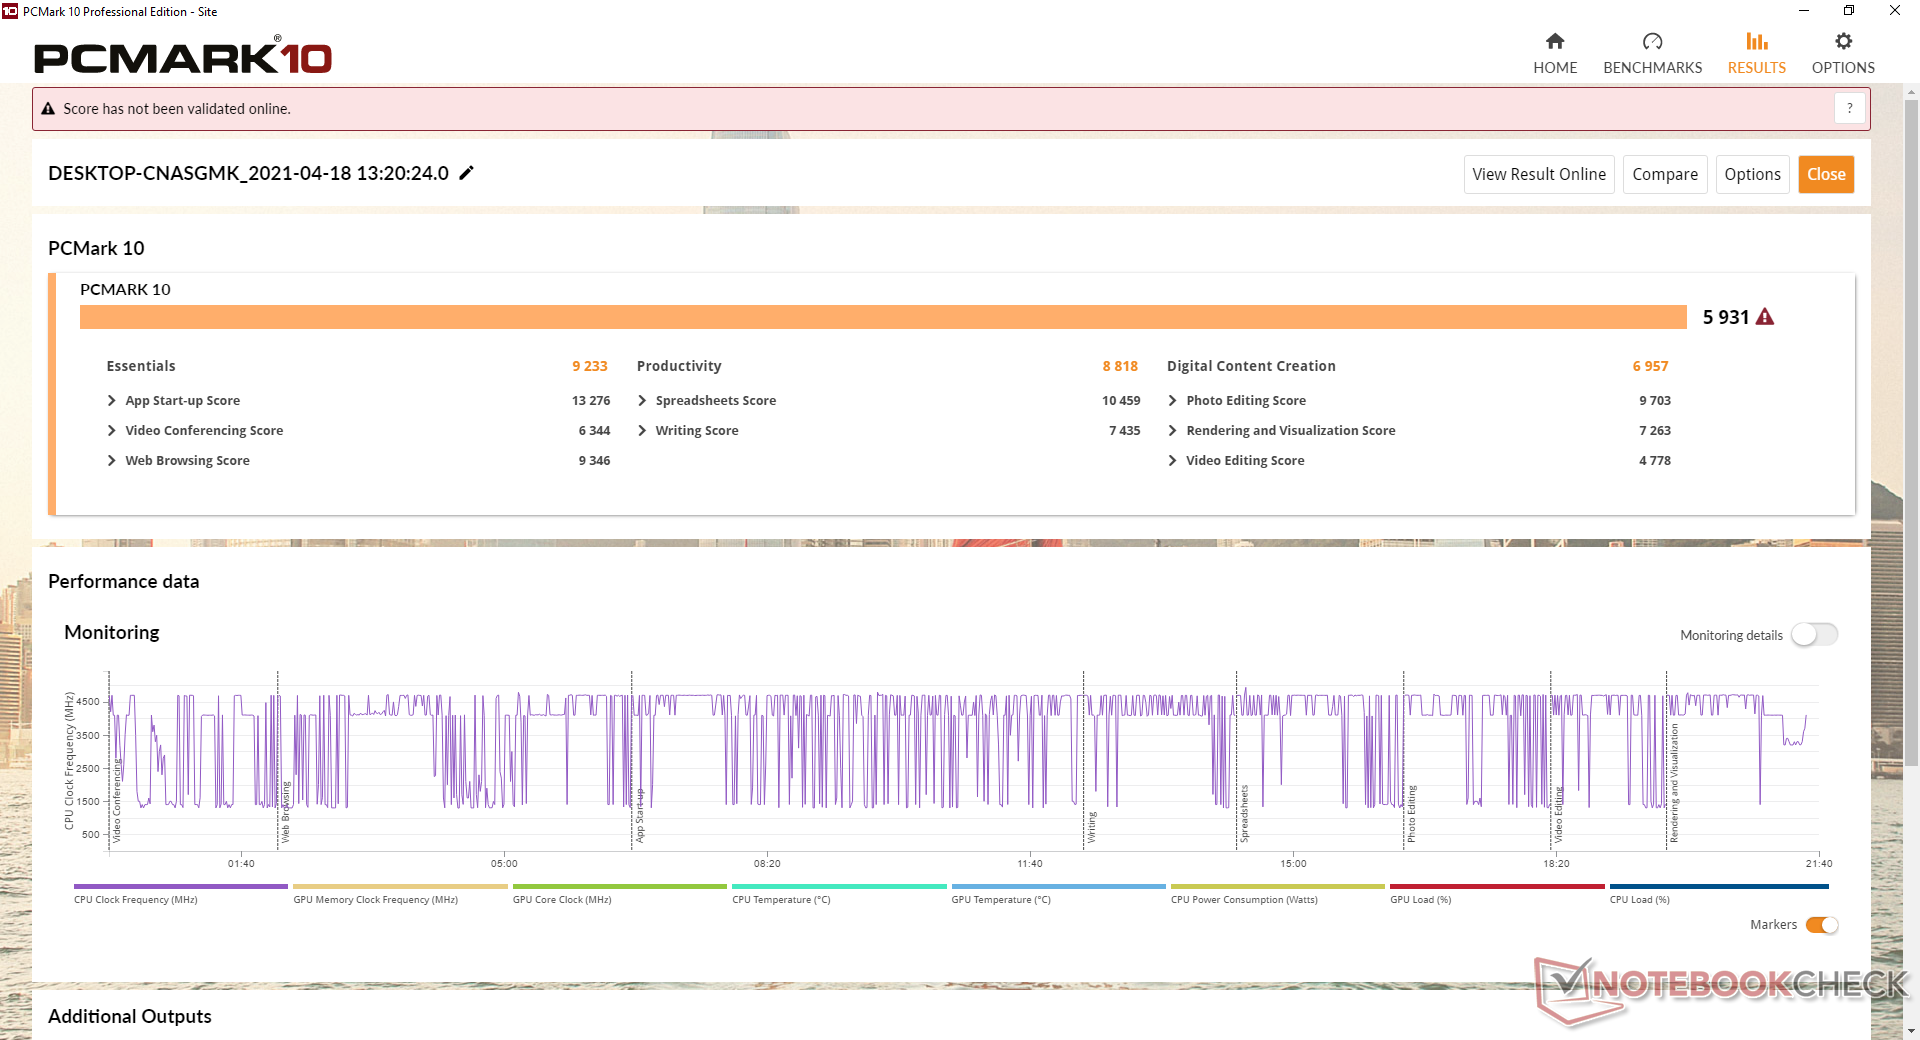
| PCMark 10 Score | 5931 баллов | |
? | ||
Задержки DPC
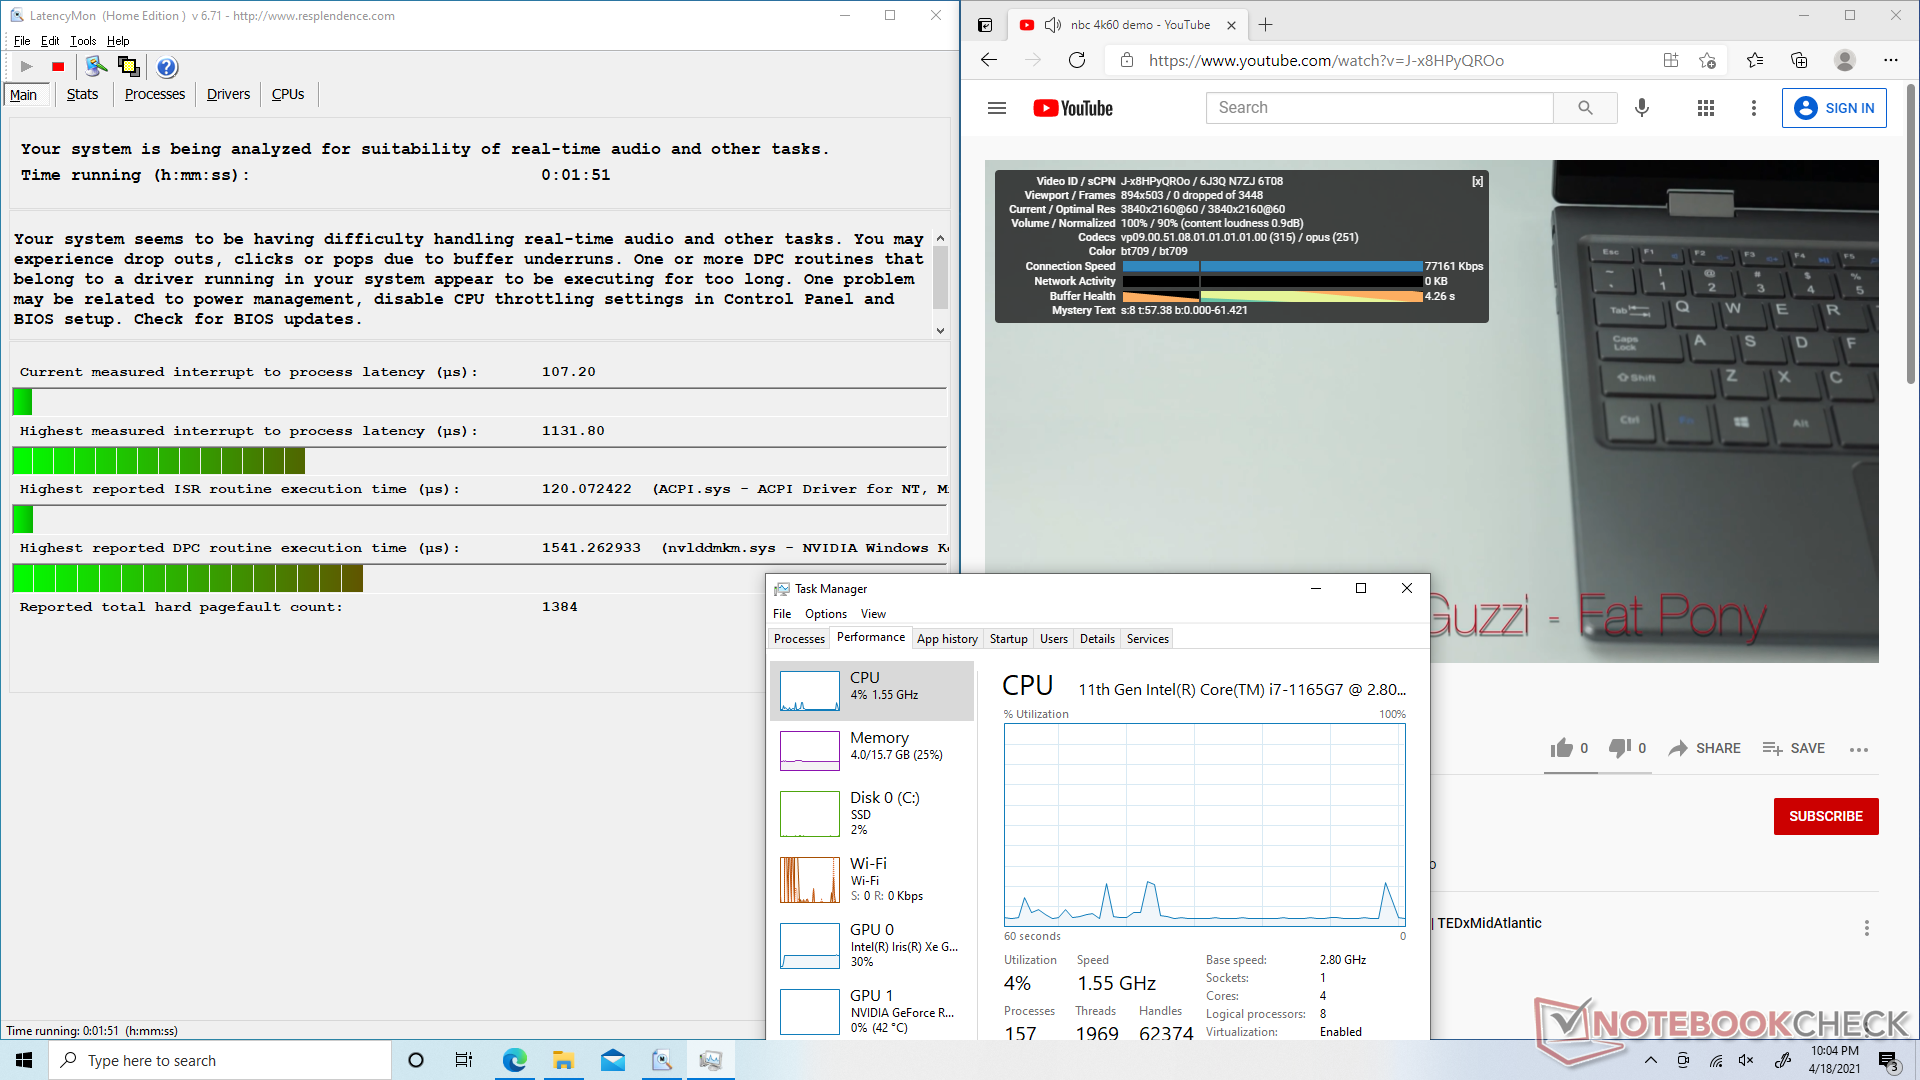
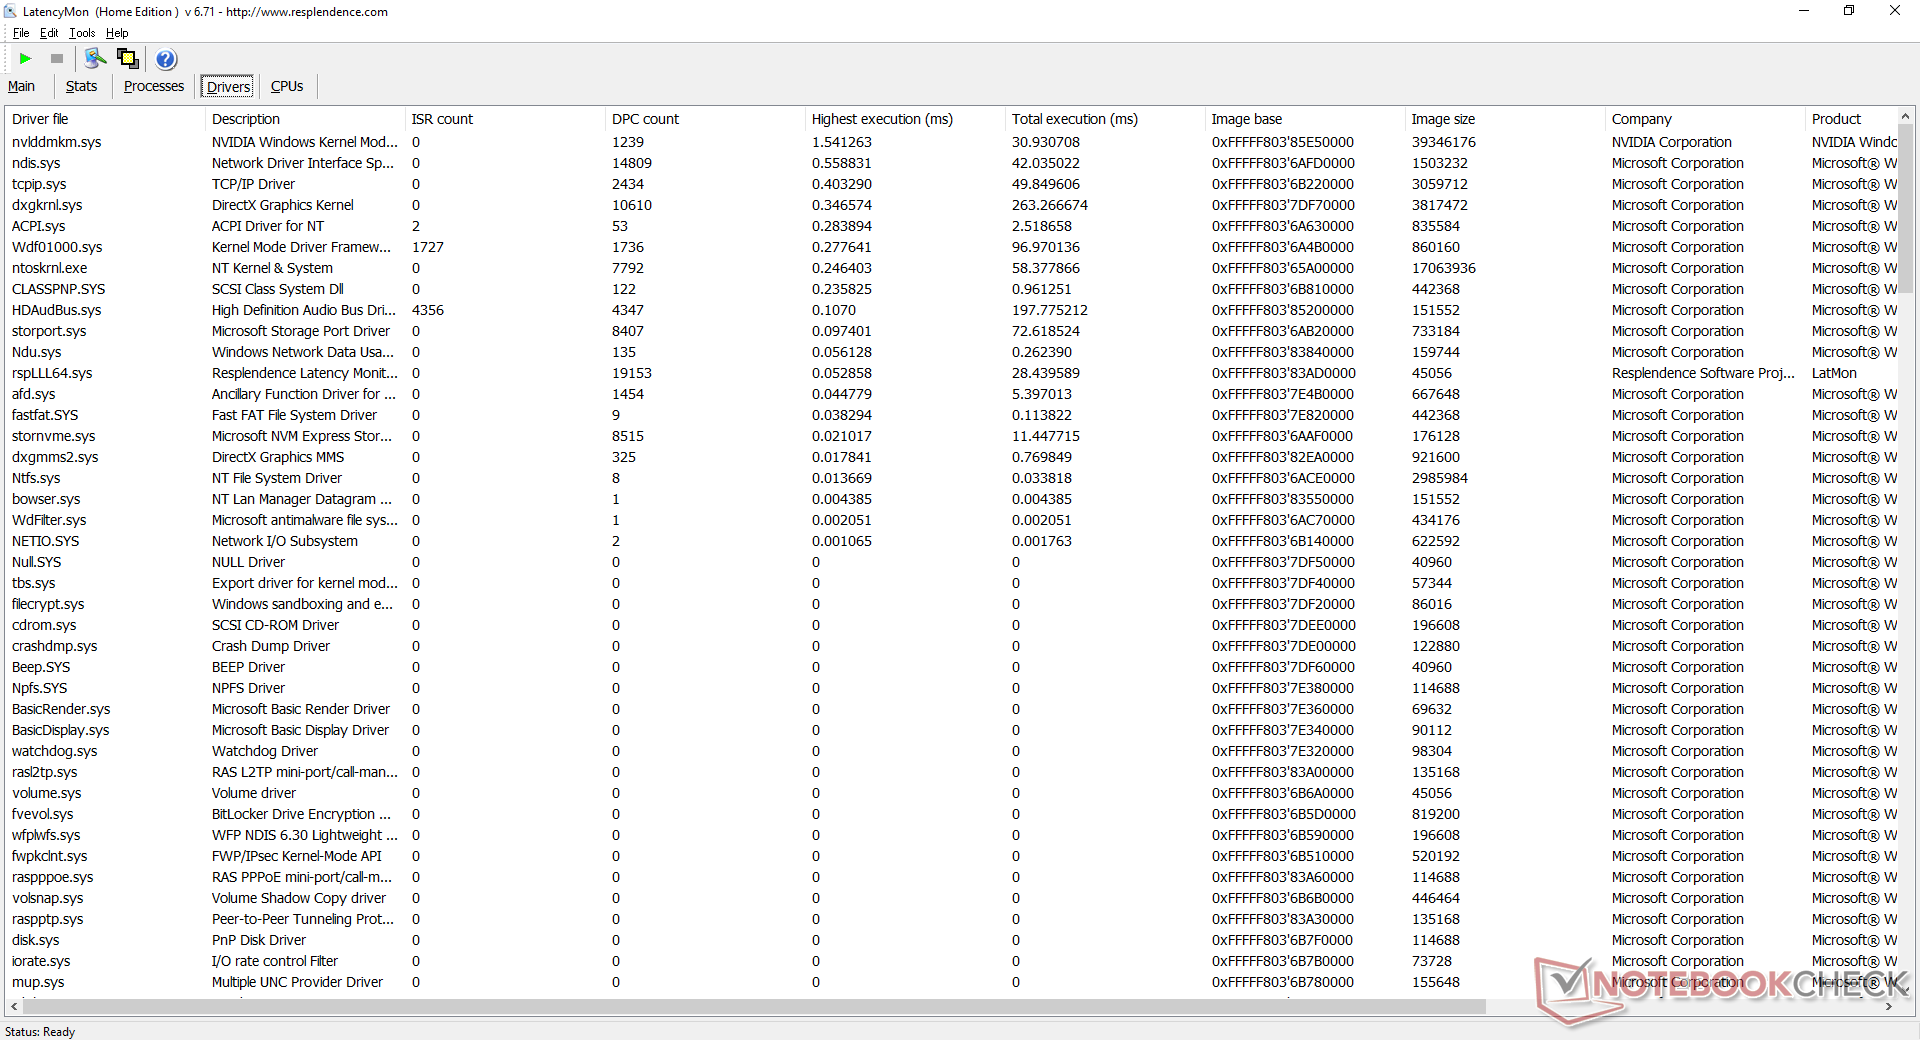
| DPC Latencies / LatencyMon - interrupt to process latency (max), Web, Youtube, Prime95 | |
| Intel NUC11PHKi7C | |
| GMK NucBox 2 | |
| Intel NUC11PAQi7 | |
* ... меньше = лучше
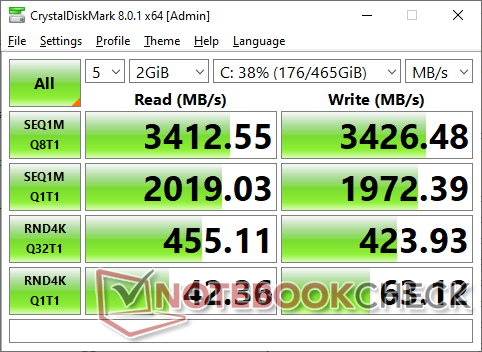
Хранение данных
В отличие от NUC11PAQi7, который даёт 4 линии PCI-Express 4.0 для SSD, тестовый NUC11PHKi7C располагает лишь 4 линиями PCI-Express 3.0 - странно для энтузиастского товара с увеличенным ценником. Конечно же, поддерживаются и накопители на протоколе SATA III. Оба NUC, и NUC11PAQi7, и NUC11PHKi7C, мы протестировали с одним и тем же накопителем Samsung. Младший NUC даёт вдвое больше скоростей, чем тестовый Phantom Canyon.
Любопытно то, что здесь поддерживается редкий размер M.2 22x110, а не только общепринятый M.2 22x80.
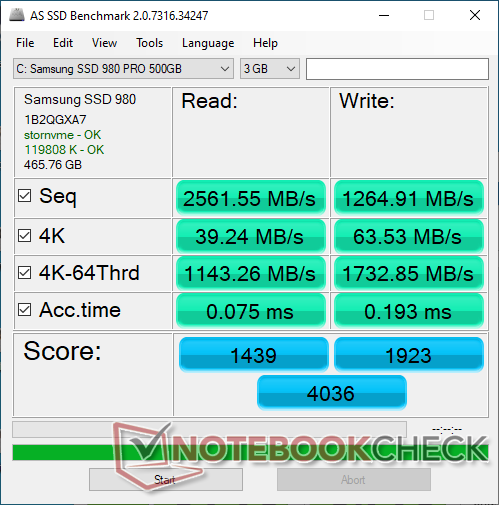
| Intel NUC11PHKi7C Samsung SSD 980 Pro 500GB MZ-V8P500BW | Intel Hades Canyon NUC8i7HVK Intel Optane 120 GB SSDPEK1W120GA | Intel NUC11PAQi7 Samsung SSD 980 Pro 500GB MZ-V8P500BW | GMK NucBox 2 Netac S930E8/256GPN | Zotac ZBOX Magnus EK71080 Samsung PM961 MZVLW256HEHP | |
|---|---|---|---|---|---|
| AS SSD | 3% | 47% | -33% | -8% | |
| Seq Read (MB/s) | 2562 | 1379 -46% | 3257 27% | 2069 -19% | 2119 -17% |
| Seq Write (MB/s) | 1265 | 553 -56% | 3937 211% | 1203 -5% | 1205 -5% |
| 4K Read (MB/s) | 39.24 | 127.9 226% | 51.3 31% | 41.66 6% | 46.69 19% |
| 4K Write (MB/s) | 63.5 | 103.5 63% | 75.7 19% | 136.9 116% | 105.2 66% |
| 4K-64 Read (MB/s) | 1143 | 1258 10% | 2283 100% | 366.3 -68% | 1170 2% |
| 4K-64 Write (MB/s) | 1733 | 556 -68% | 2206 27% | 340.5 -80% | 443.8 -74% |
| Access Time Read * (ms) | 0.075 | 0.025 67% | 0.056 25% | 0.064 15% | 0.06 20% |
| Access Time Write * (ms) | 0.193 | 0.033 83% | 0.154 20% | 0.347 -80% | 0.04 79% |
| Score Read (Points) | 1439 | 1524 6% | 2660 85% | 615 -57% | 1429 -1% |
| Score Write (Points) | 1923 | 714 -63% | 2676 39% | 598 -69% | 669 -65% |
| Score Total (Points) | 4036 | 3023 -25% | 6725 67% | 1497 -63% | 2791 -31% |
| Copy ISO MB/s (MB/s) | 1675 | 1125 -33% | 2030 21% | 1186 -29% | 1649 -2% |
| Copy Program MB/s (MB/s) | 1030 | 342.4 -67% | 883 -14% | 428.6 -58% | 468 -55% |
| Copy Game MB/s (MB/s) | 1810 | 768 -58% | 1817 0% | 435.7 -76% | 1010 -44% |
| CrystalDiskMark 5.2 / 6 | 21% | 111% | 6% | -2% | |
| Write 4K (MB/s) | 67.3 | 133.7 99% | 244.6 263% | 178.4 165% | 132.7 97% |
| Read 4K (MB/s) | 38.32 | 178.6 366% | 80.4 110% | 61 59% | 44.48 16% |
| Write Seq (MB/s) | 1985 | 608 -69% | 4094 106% | 1040 -48% | 1193 -40% |
| Read Seq (MB/s) | 2049 | 1428 -30% | 4099 100% | 1919 -6% | 1371 -33% |
| Write 4K Q32T1 (MB/s) | 432.3 | 323.6 -25% | 715 65% | 417.7 -3% | 398.5 -8% |
| Read 4K Q32T1 (MB/s) | 452.4 | 282.3 -38% | 783 73% | 325.6 -28% | 483.5 7% |
| Write Seq Q32T1 (MB/s) | 3423 | 627 -82% | 5065 48% | 1144 -67% | 1202 -65% |
| Read Seq Q32T1 (MB/s) | 3123 | 1521 -51% | 6884 120% | 2379 -24% | 3388 8% |
| Среднее значение | 12% /
10% | 79% /
70% | -14% /
-19% | -5% /
-6% |
* ... меньше = лучше

Нагрузочный тест SSD длительным чтением: DiskSpd Read Loop, Queue Depth 8
Графика
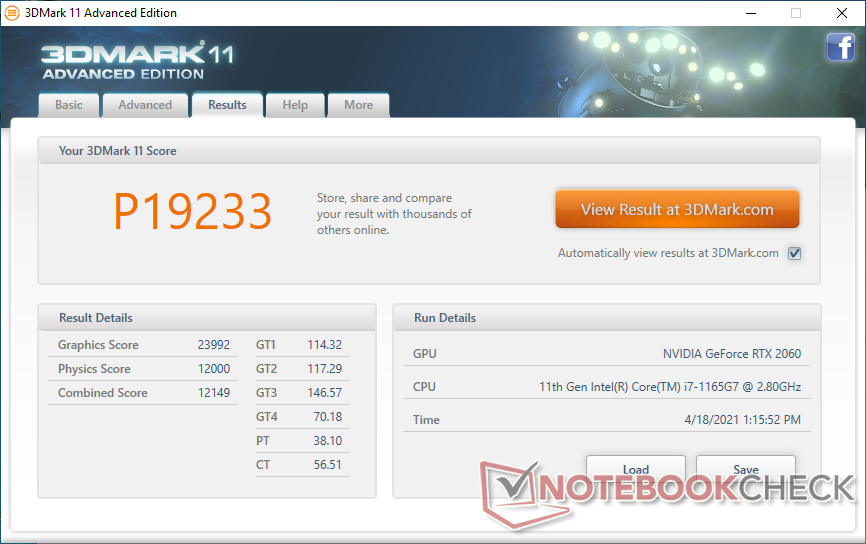
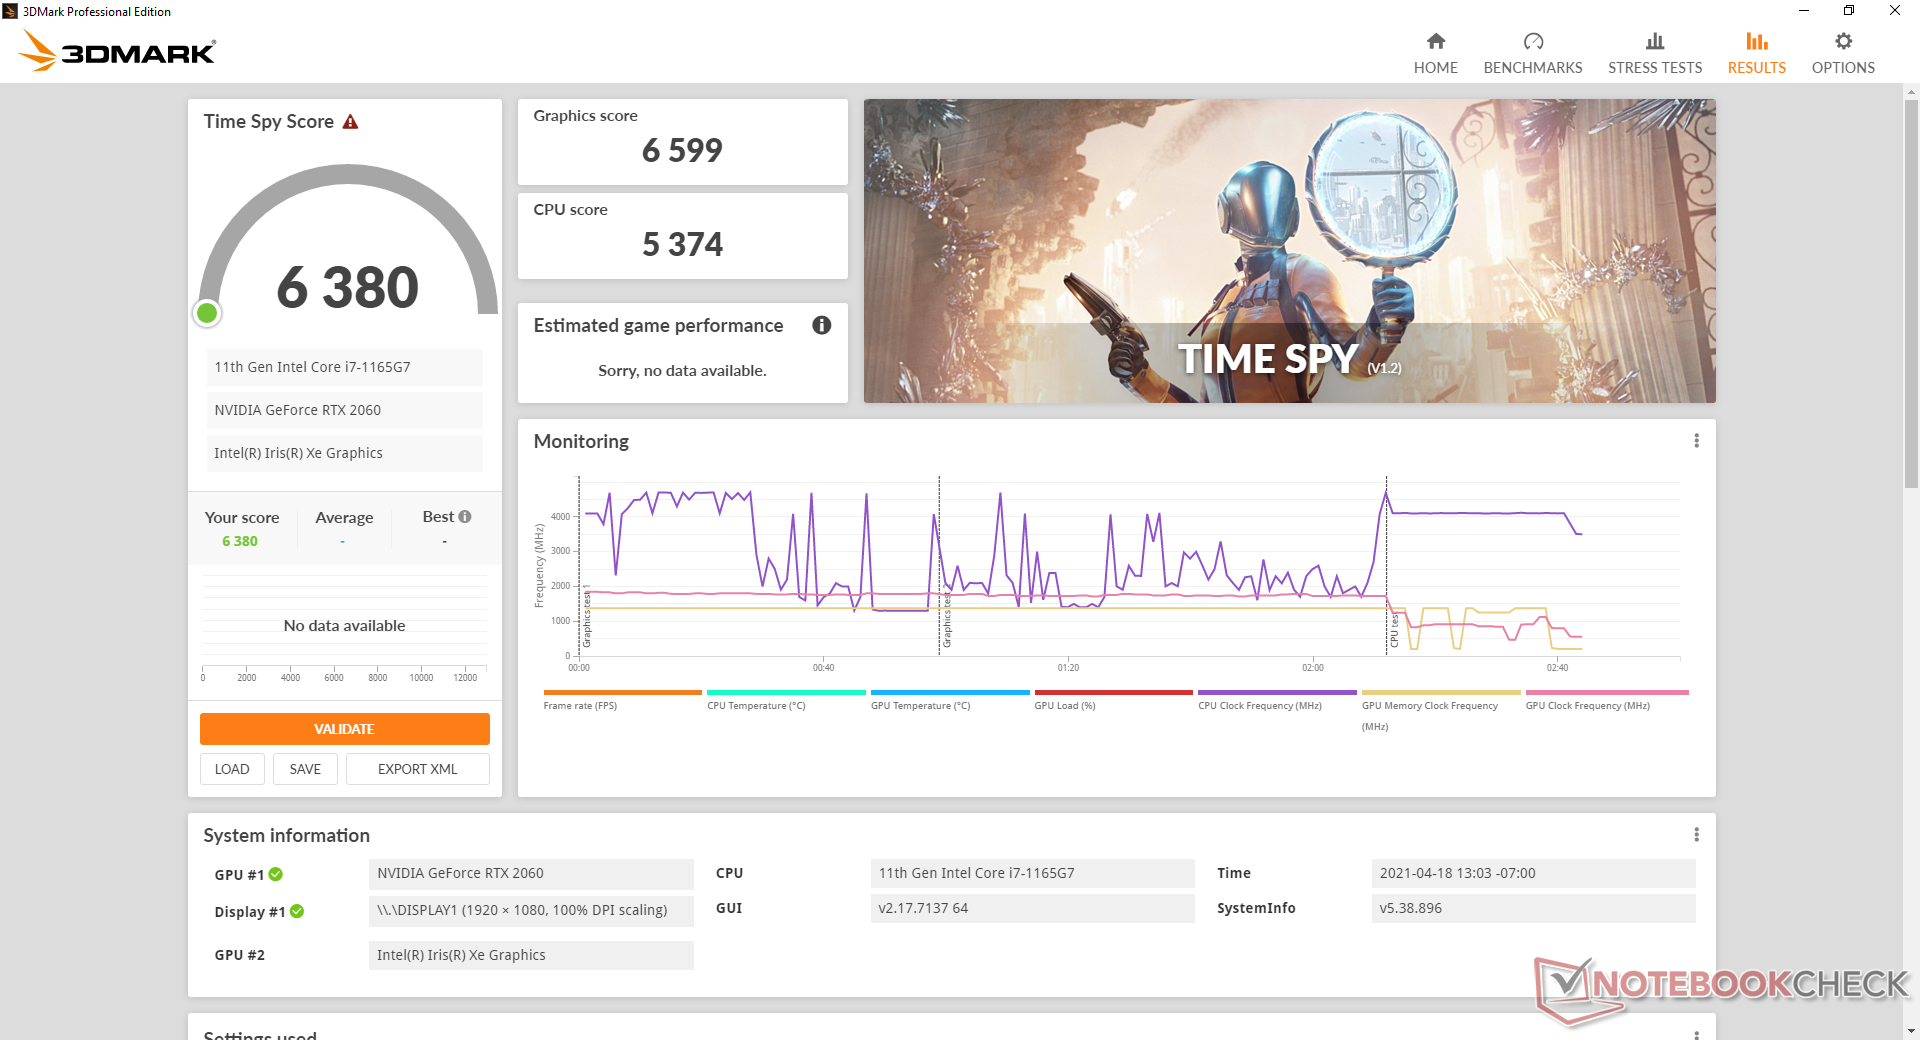
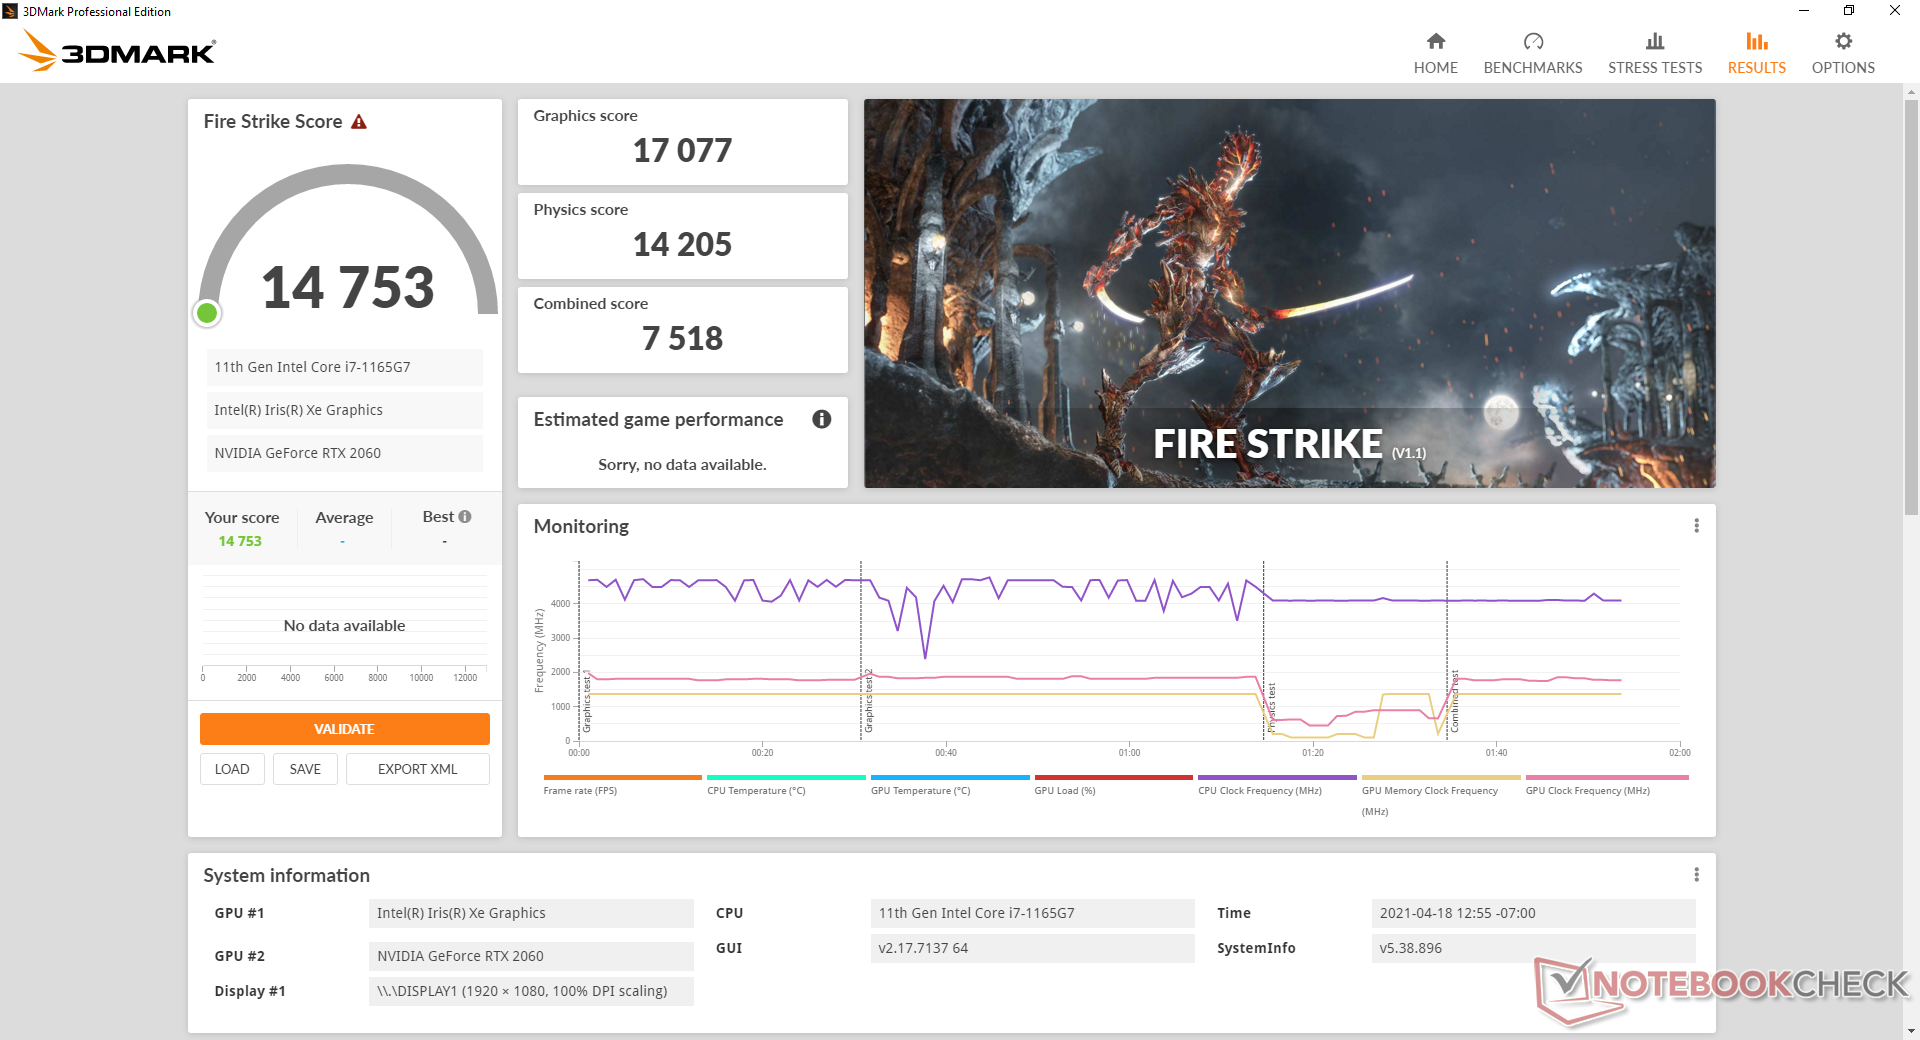
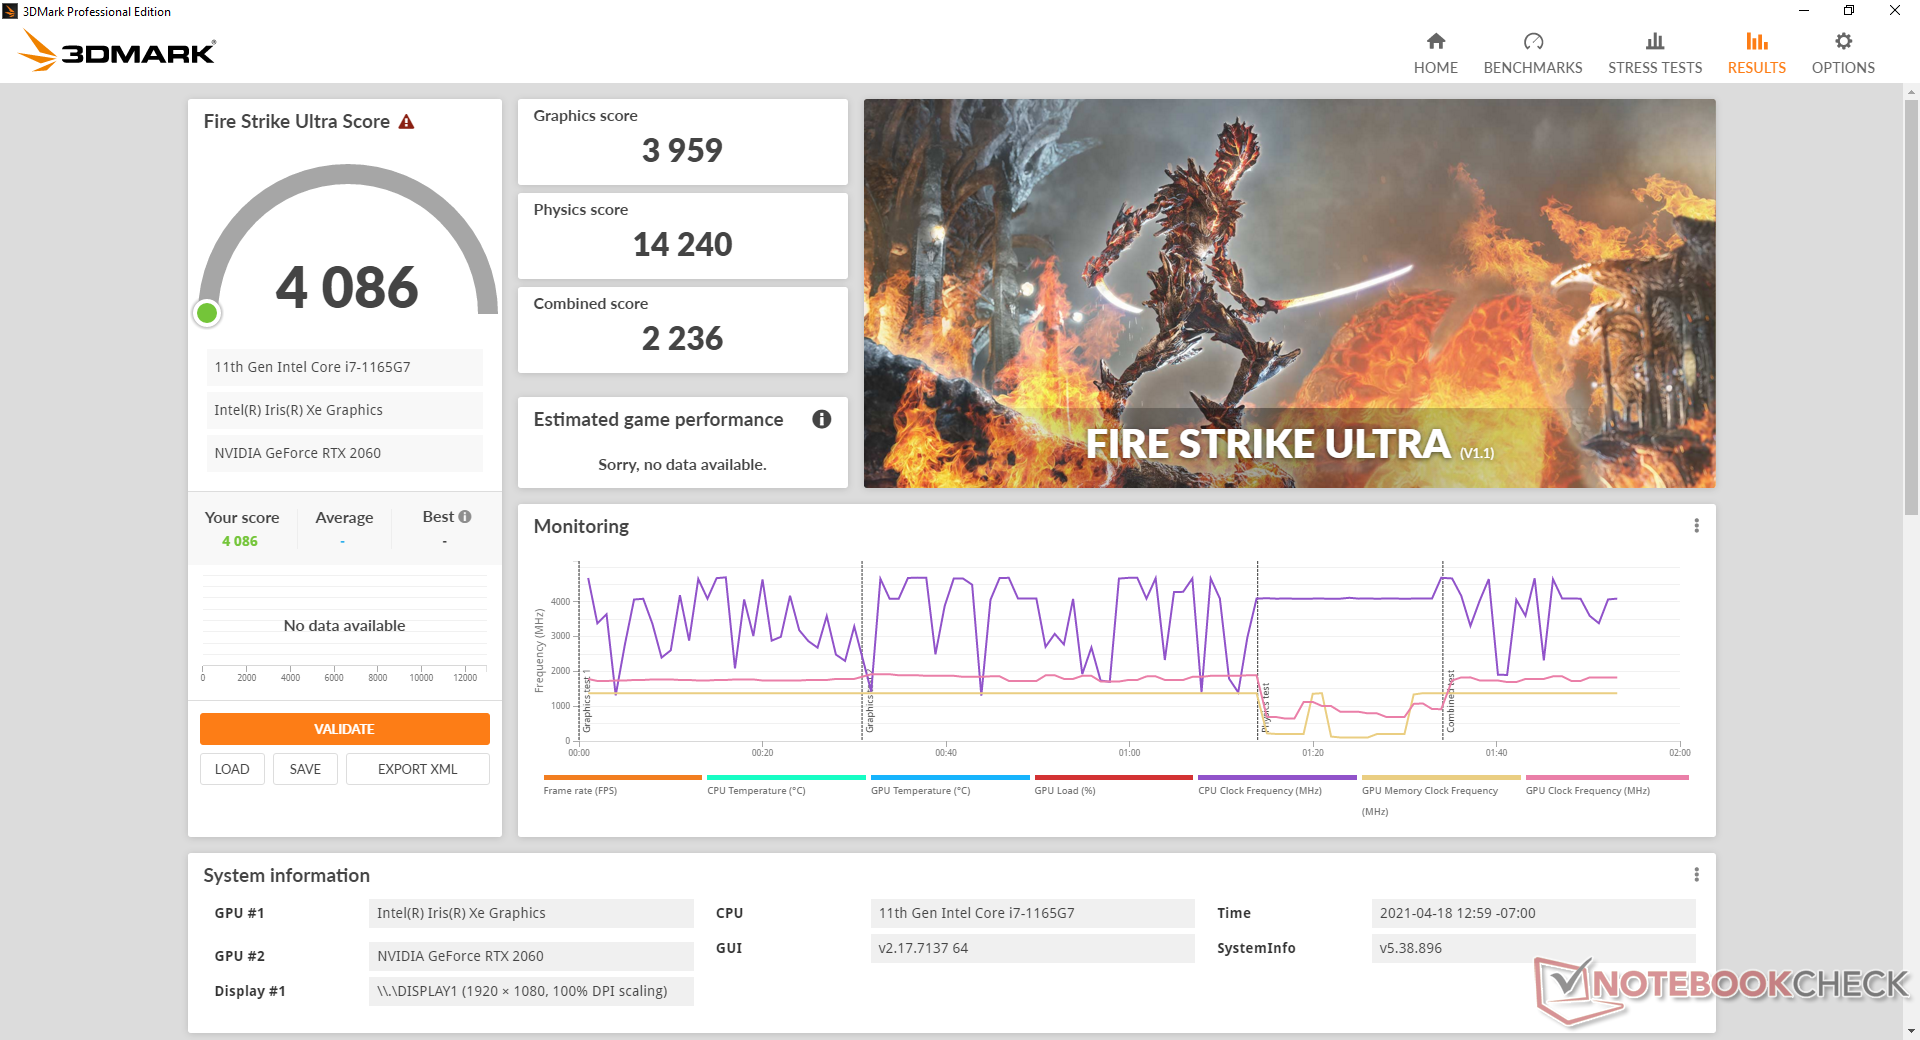
Местная видеокарта даёт почти те же цифры, что и случайно взятый ноутбук с GeForce RTX 2060. По сравнению с Radeon RX Vega M GH, видеопроцессором из Hades Canyon, трёхмерная производительность увеличилась на 70% в 3DMark Fire Strike и на 100% с лишним в Time Spy. Видимо, максимальный прирост будет ощущаться в играх с полной поддержкой DX12.
Самый обычный настольный компьютер с настольной RTX 2060 даст на 15....20% больше графической мощи, чем тестовый NUC.


| 3DMark 11 | |
| 1280x720 Performance GPU | |
| Aorus Gaming Box GeForce RTX 2080 Ti | |
| Zotac ZBOX Magnus EN72070V | |
| MSI RTX 2060 Gaming Z 6G | |
| Intel NUC11PHKi7C | |
| MSI GF65 Thin 10UE | |
| Aorus 15P WB | |
| Asus ROG Zephyrus M15 GU502LU-BI7N4 | |
| Усредн. модель с NVIDIA GeForce RTX 2060 Mobile (19143 - 24662, n=40) | |
| Intel Hades Canyon NUC8i7HVK | |
| HP Envy 14-eb0010nr | |
| Huawei MateBook X Pro 2021 | |
| Intel NUC11TNKi5 | |
| Beelink SEi10 | |
| 1280x720 Performance Combined | |
| MSI RTX 2060 Gaming Z 6G | |
| Asus ROG Zephyrus M15 GU502LU-BI7N4 | |
| Aorus 15P WB | |
| MSI GF65 Thin 10UE | |
| Aorus Gaming Box GeForce RTX 2080 Ti | |
| Zotac ZBOX Magnus EN72070V | |
| Intel NUC11PHKi7C | |
| Усредн. модель с NVIDIA GeForce RTX 2060 Mobile (1107 - 14726, n=40) | |
| Intel Hades Canyon NUC8i7HVK | |
| HP Envy 14-eb0010nr | |
| Huawei MateBook X Pro 2021 | |
| Intel NUC11TNKi5 | |
| Beelink SEi10 | |
| 3DMark 11 Performance | 19233 баллов | |
| 3DMark Cloud Gate Standard Score | 30679 баллов | |
| 3DMark Fire Strike Score | 14753 баллов | |
| 3DMark Time Spy Score | 6380 баллов | |
? | ||
| мин. | сред. | выс. | макс. | |
|---|---|---|---|---|
| GTA V (2015) | 168 | 158 | 119 | 69.6 |
| The Witcher 3 (2015) | 220.7 | 152.2 | 101.5 | 61.4 |
| Dota 2 Reborn (2015) | 139 | 123 | 116 | 112 |
| Final Fantasy XV Benchmark (2018) | 130 | 89.2 | 67.5 | |
| X-Plane 11.11 (2018) | 94.8 | 81.3 | 69.8 | |
| Strange Brigade (2018) | 287 | 148 | 124 | 109 |
Шумовые и температурные показатели
Шум
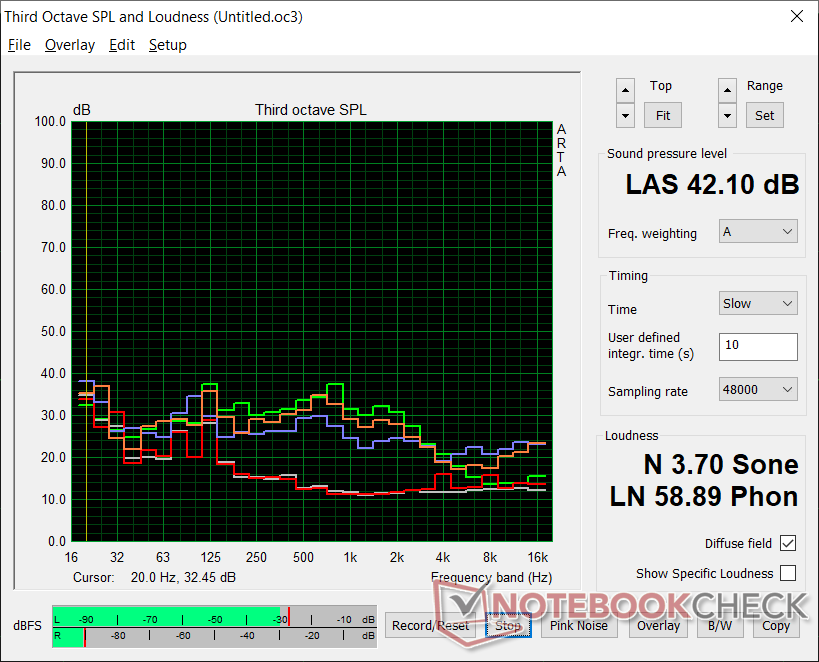
В простое, при показе рабочего стола, тестовый экземпляр издаёт электронный писк громкостью около 25.3 акустического децибела против фона комнаты в 24.5 децибела. Что касается шума от системы охлаждения, он мало отличается от показателей модели Hades Canyon. Во время игры в Ведьмак 3, например, вентилятор потихоньку увеличивает обороты, приходя в итоге к стабильным 39.7 децибела шума. Нагрузочное тестирование при помощи Prime95 плюс FurMark даёт до 47.9 децибела шума, но держится этот уровень недолго, вскоре уменьшаясь до 42.1 децибела.
| Intel NUC11PHKi7C GeForce RTX 2060 Mobile, i7-1165G7, Samsung SSD 980 Pro 500GB MZ-V8P500BW | Intel Hades Canyon NUC8i7HVK Vega M GH, i7-8809G, Intel Optane 120 GB SSDPEK1W120GA | Intel NUC11PAQi7 Iris Xe G7 96EUs, i7-1165G7, Samsung SSD 980 Pro 500GB MZ-V8P500BW | GMK NucBox 2 Iris Plus Graphics 655, i5-8259U, Netac S930E8/256GPN | Zotac ZBOX Magnus EK71080 GeForce GTX 1080 (Desktop), i7-7700HQ, Samsung PM961 MZVLW256HEHP | Aorus Gaming Box GeForce RTX 2080 Ti , i7-1165G7 | |
|---|---|---|---|---|---|---|
| Уровень шума | -10% | 0% | 3% | -28% | -25% | |
| в выкл. виде (фон) * (dB) | 24.5 | 28.7 -17% | 25.6 -4% | 25.6 -4% | 29.9 -22% | 26.5 -8% |
| Мин. в простое * (dB) | 25.3 | 29 -15% | 25.6 -1% | 25.7 -2% | 38.6 -53% | 34.7 -37% |
| В простое, сред. * (dB) | 25.3 | 29 -15% | 25.6 -1% | 25.7 -2% | 38.6 -53% | 39.1 -55% |
| В простое, макс. * (dB) | 25.3 | 29 -15% | 25.6 -1% | 25.7 -2% | 39 -54% | 39.1 -55% |
| Нагрузка, сред. * (dB) | 36.4 | 36 1% | 33.6 8% | 35.3 3% | 40.6 -12% | 39.5 -9% |
| Witcher 3 ultra * (dB) | 39.7 | 42 -6% | 33.6 15% | 41.7 -5% | 43.7 -10% | |
| Нагрузка, макс. * (dB) | 47.9 | 49.4 -3% | 54.5 -14% | 35.1 27% | 47 2% | 48 -0% |
* ... меньше = лучше
Уровень шума
| Ожидание |
| 25.3 / 25.3 / 25.3 дБ |
| Нагрузка |
| 36.4 / 47.9 дБ |
 | ||
30 dB бесшумно 40 dB(A) различимо 50 dB(A) громко |
||
min: | ||
Нагрев
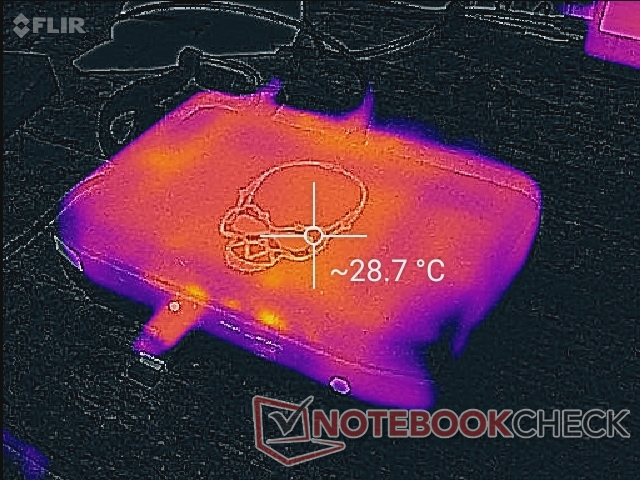
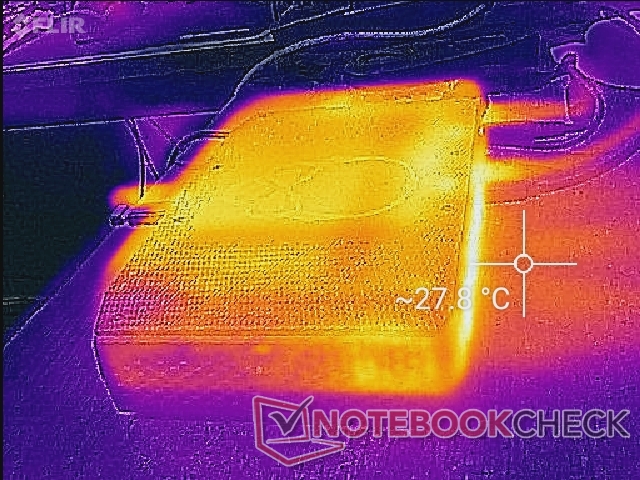
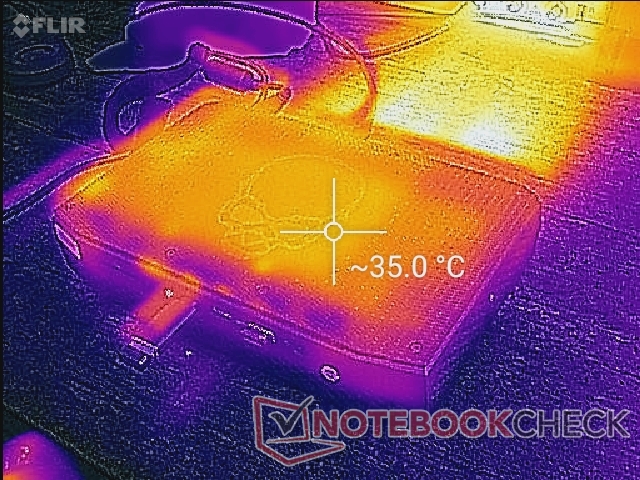
По этому поводу можно не беспокоиться. Самый горячий участок верхней крышки в игре греется лишь до 35 градусов. Тёплый воздух выдувается сзади корпуса, это стоит учесть при выборе расположения.
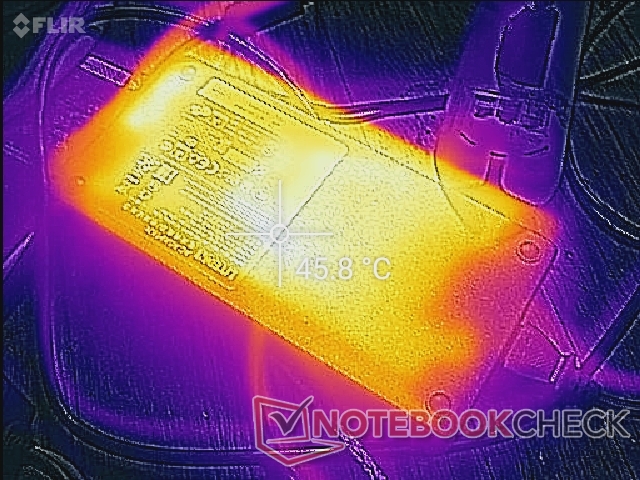
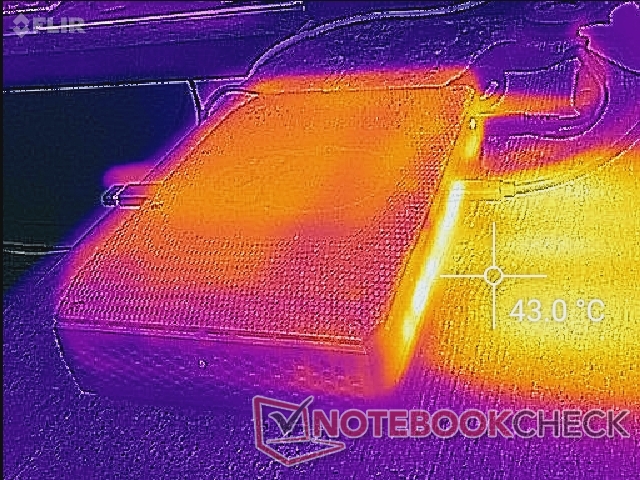
Комплектный адаптер питания греется больше, чем сам NUC. При игровой нагрузке на нём отмечено 43 градуса. Производитель мог бы использовать менее громоздкий блок питания, но тогда он грелся бы ещё сильнее - примером может стать ЗУ от Razer Blade.
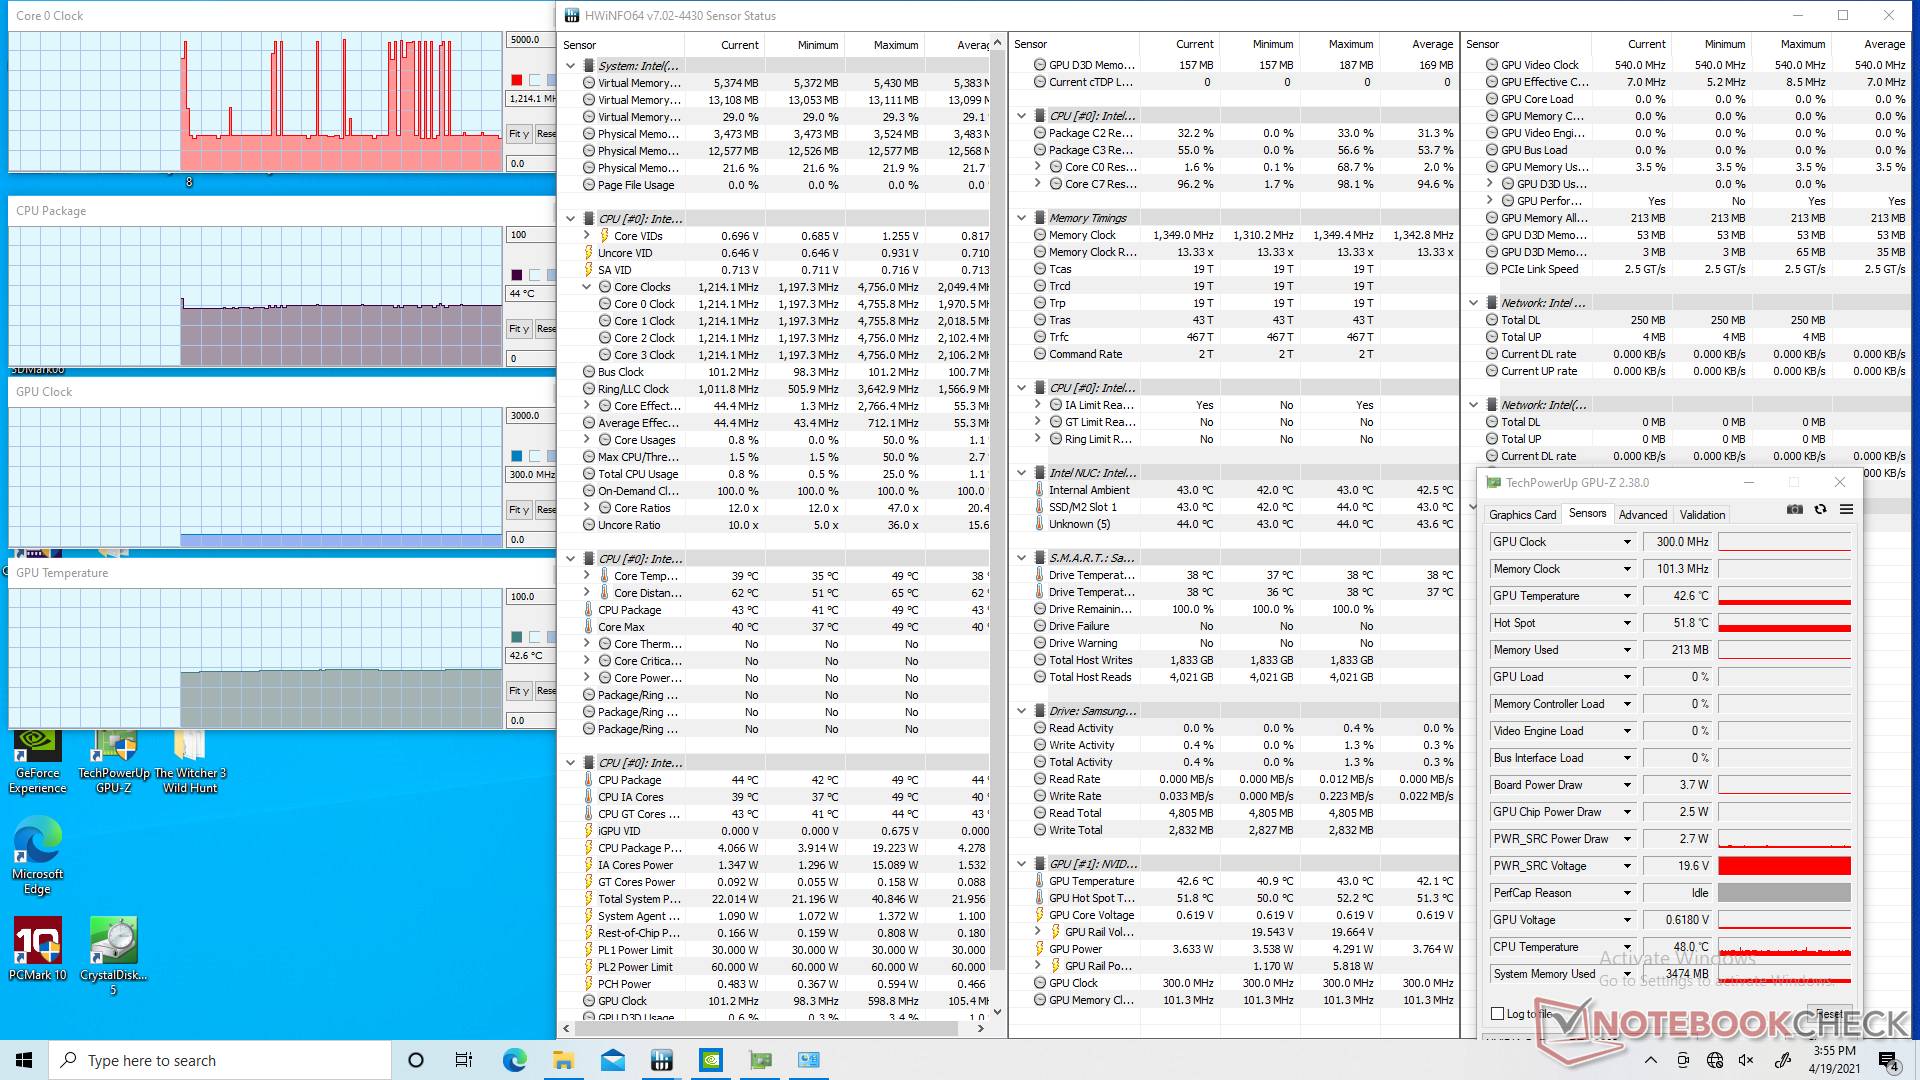
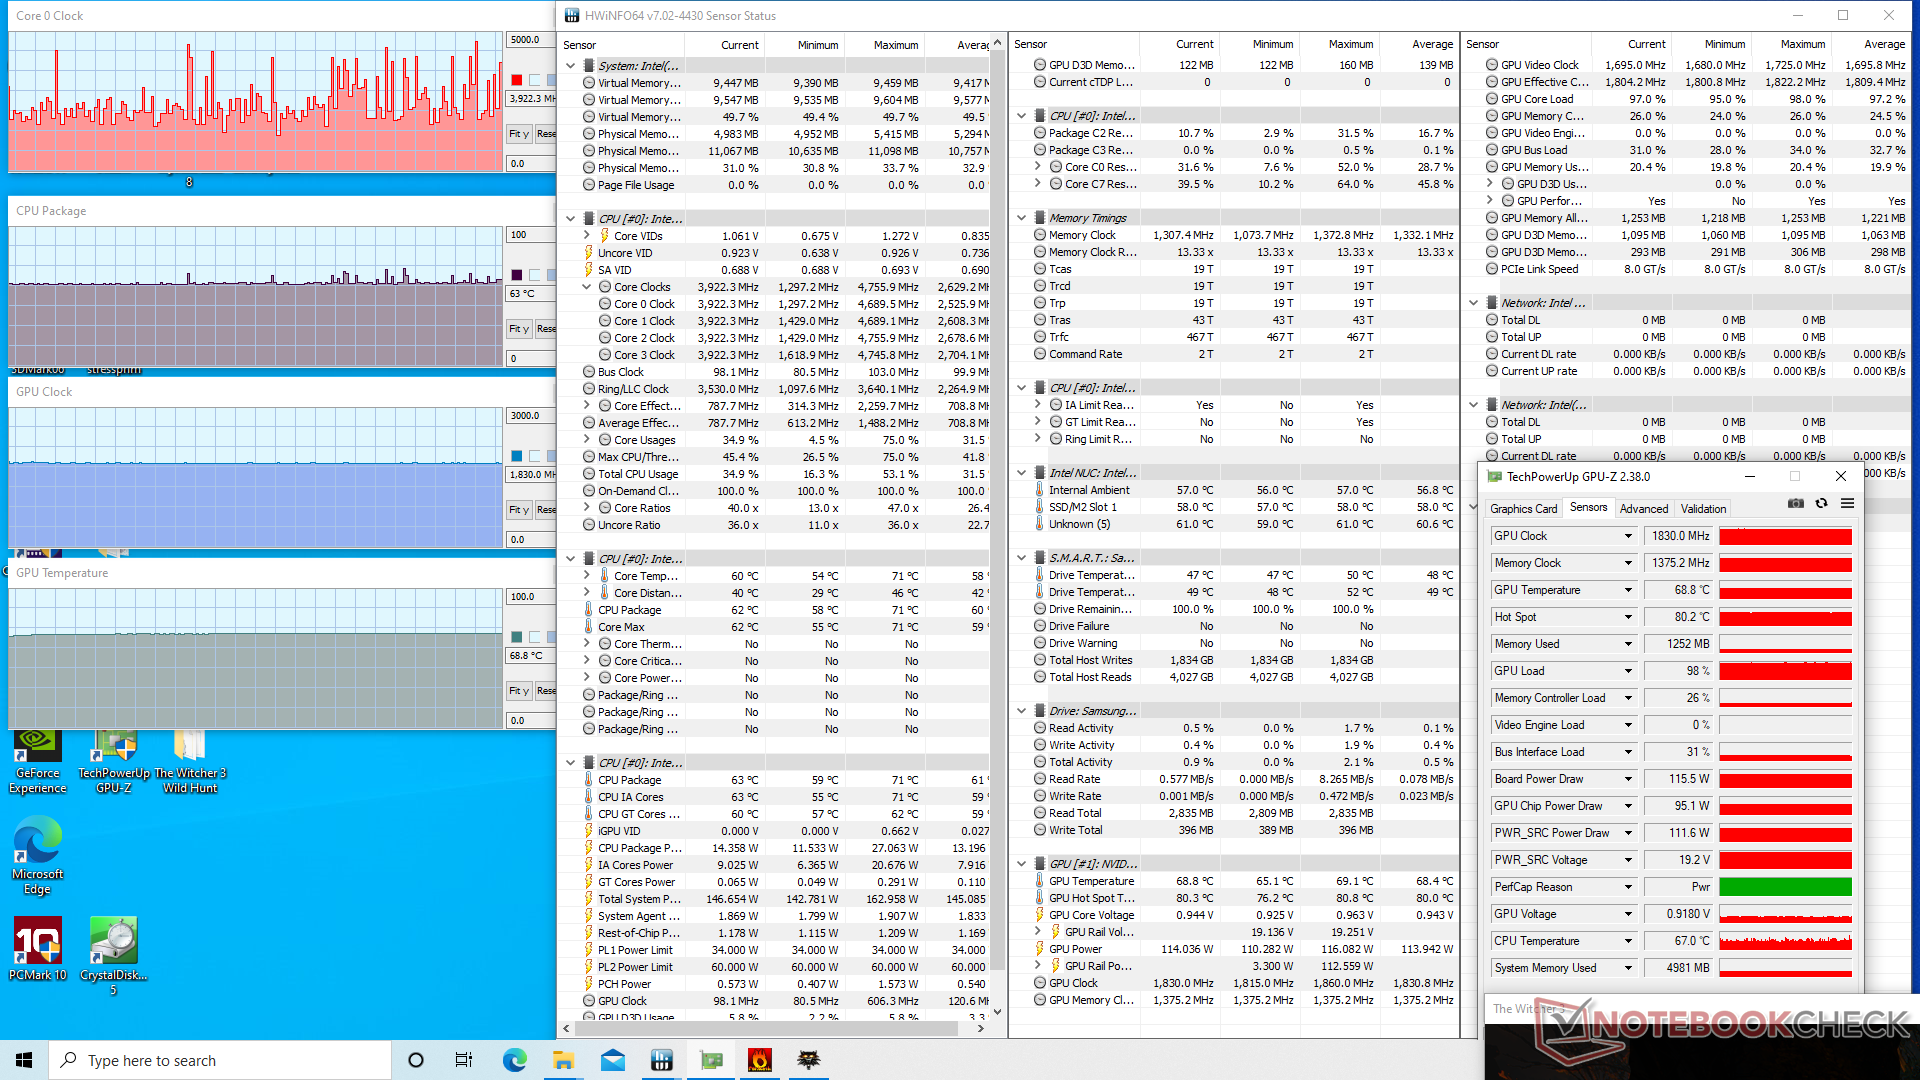
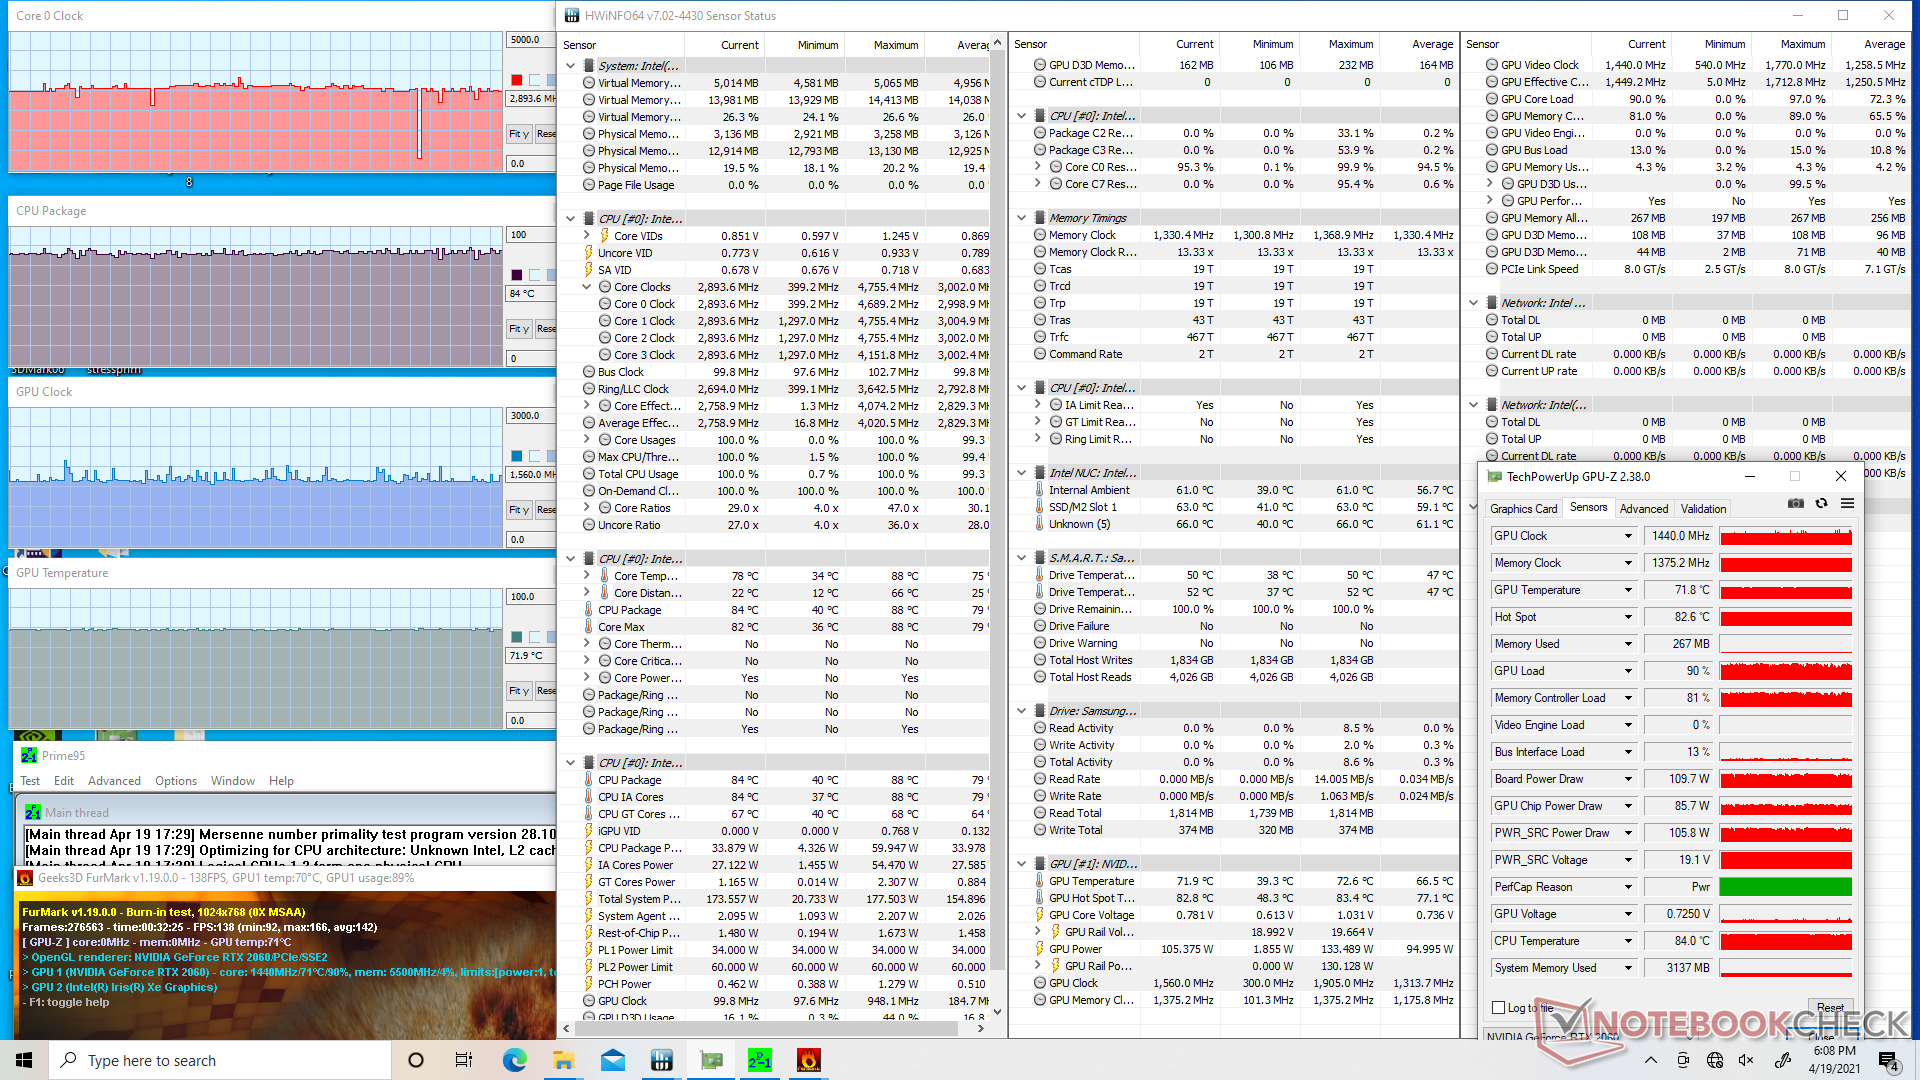
Искусственная загрузка утилитой Prime95 разгоняет процессорные ядра до 4.1 ГГц, но лишь примерно на 20 секунд. К этому моменту процессор нагревается до 89 градусов и начинает замедляться, находя стабильность в области 3.0....3.2 ГГц при 67 градусах. Если выставить сбалансированный профиль энергопотребления вместо профиля максимальной производительности, итоговая частота равна и вовсе 2.8 гигагерцам при 57 градусах.
Игровая нагрузка Ведьмаком 3 даёт 63 градуса на ЦП и 69 - на видеопроцессоре Nvidia. Видеокарта при этом потребляет около 116 ватт. Процессор Kaby Lake-G внутри Hades Canyon в тех же условиях работал со сравнимой температурой.
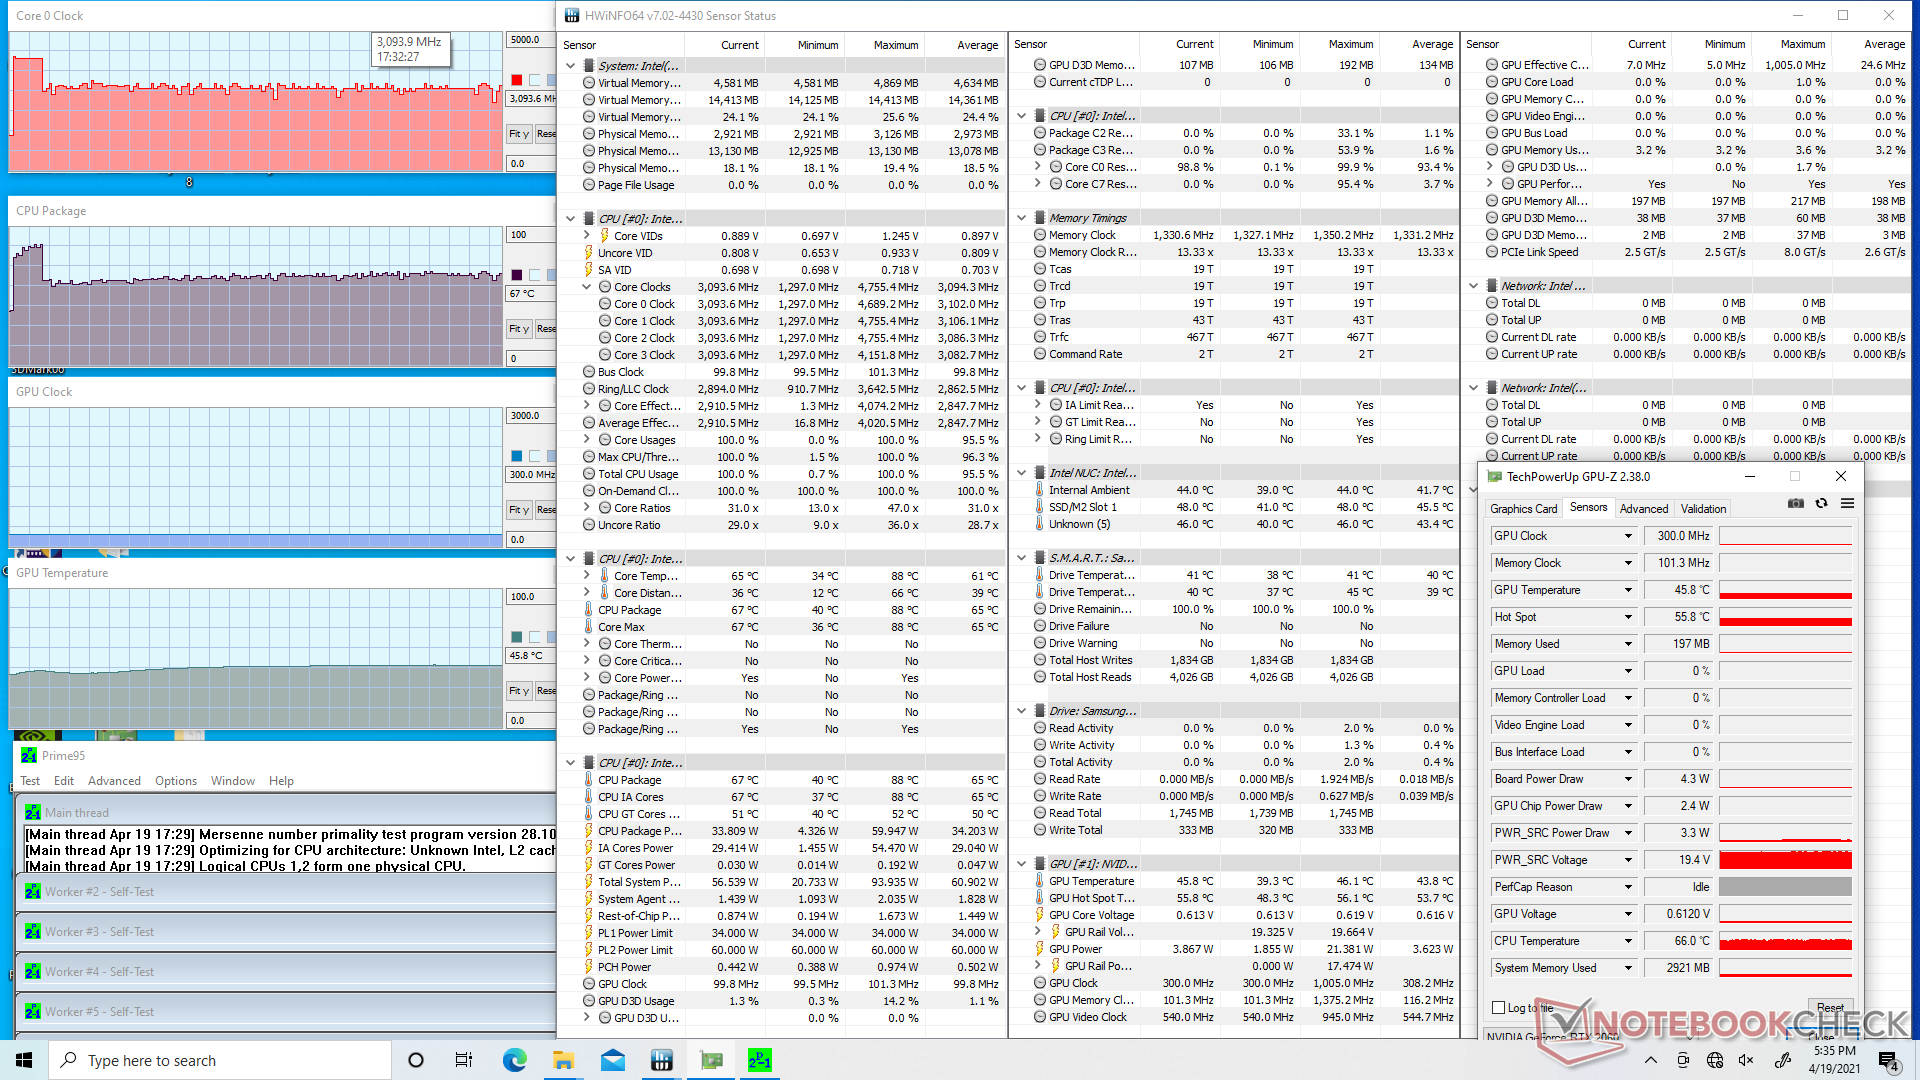
| Частота проц-ра (ГГц) | Частота видеопр-ра (МГц) | Сред. темп-ра проц-ра (°C) | Сред. темп-ра видеопр-ра (°C) | |
| В простое | -- | -- | 44 | 43 |
| Prime95 | 3.0 - 3.2 | -- | 67 | 46 |
| Prime95 и FurMark | 2.9 | 1440 | 84 | 72 |
| Ведьмак 3 | 1.5 - 4.2 | 1830 | 63 | 69 |
Энергопотребление
Энергопотребление
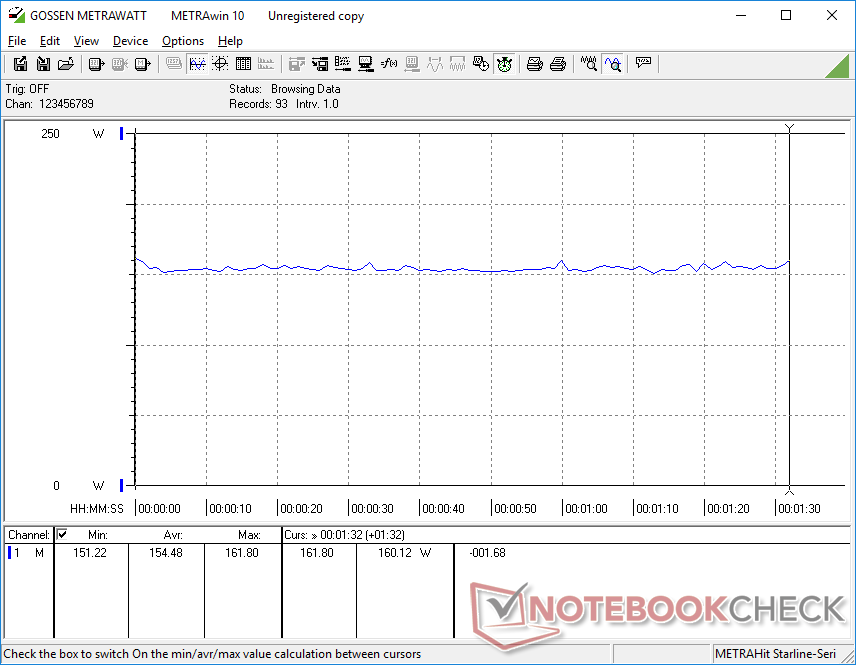
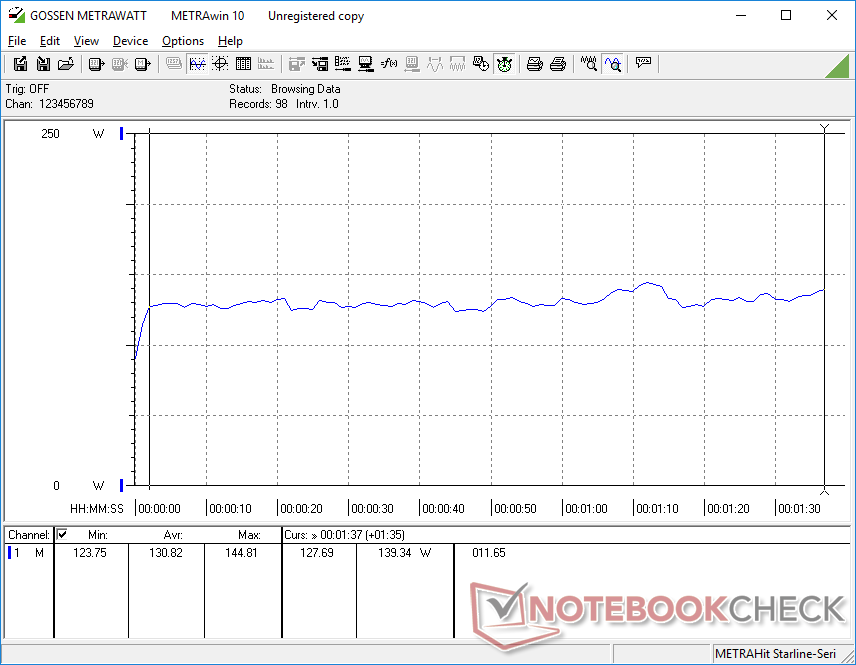
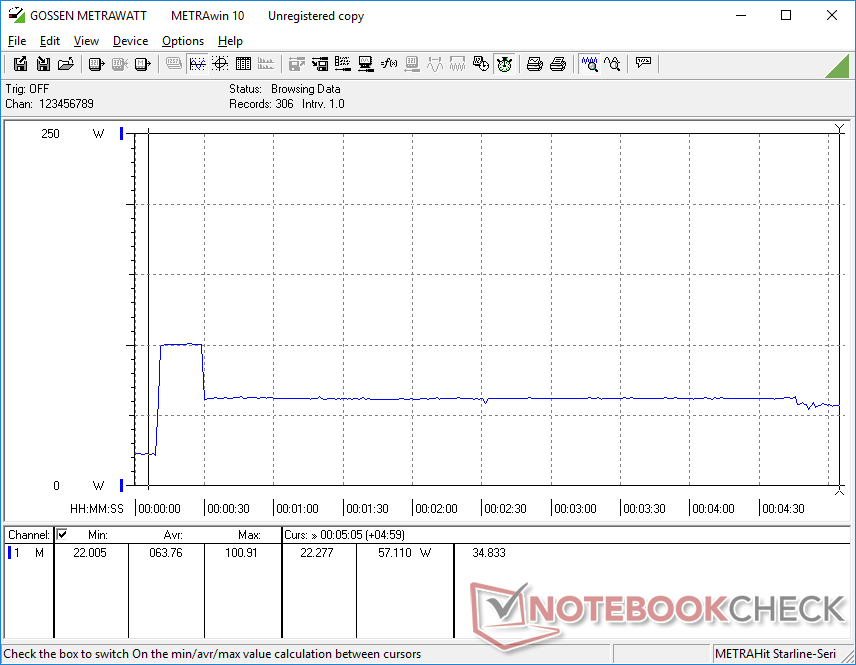
Тестовый неттоп требует 5....6 ватт в простое, при показе рабочего стола без подключённой периферии (в том числе дисплея). При подключённых мыши, клавиатуре и дисплее, с активной RTX 2060, цифра увеличивается до 21 ватта. В игровой нагрузке новинка требует на 30....60% больше энергии, чем Hades Canyon. Графическая производительность увеличилась на 70....100%, так что претензий никаких.
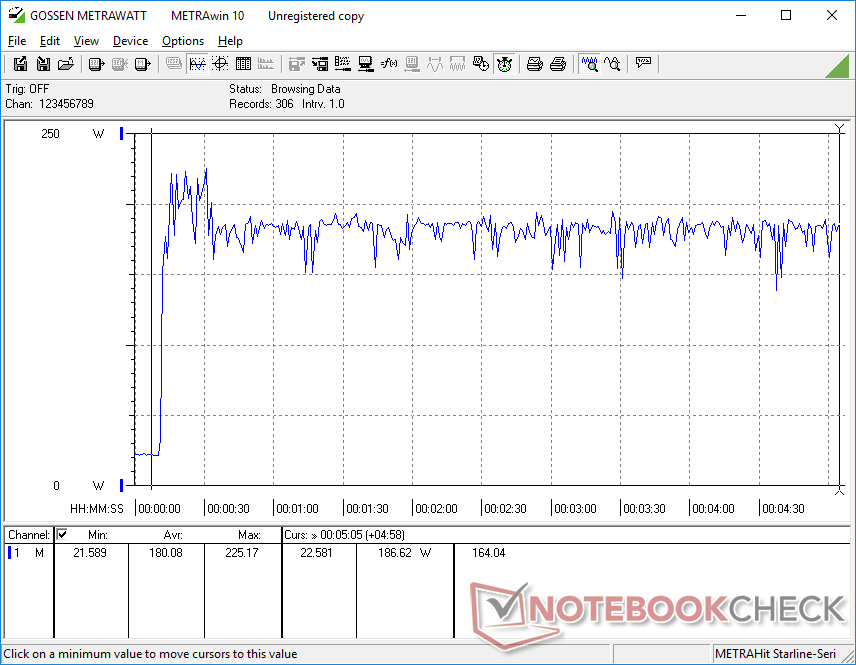
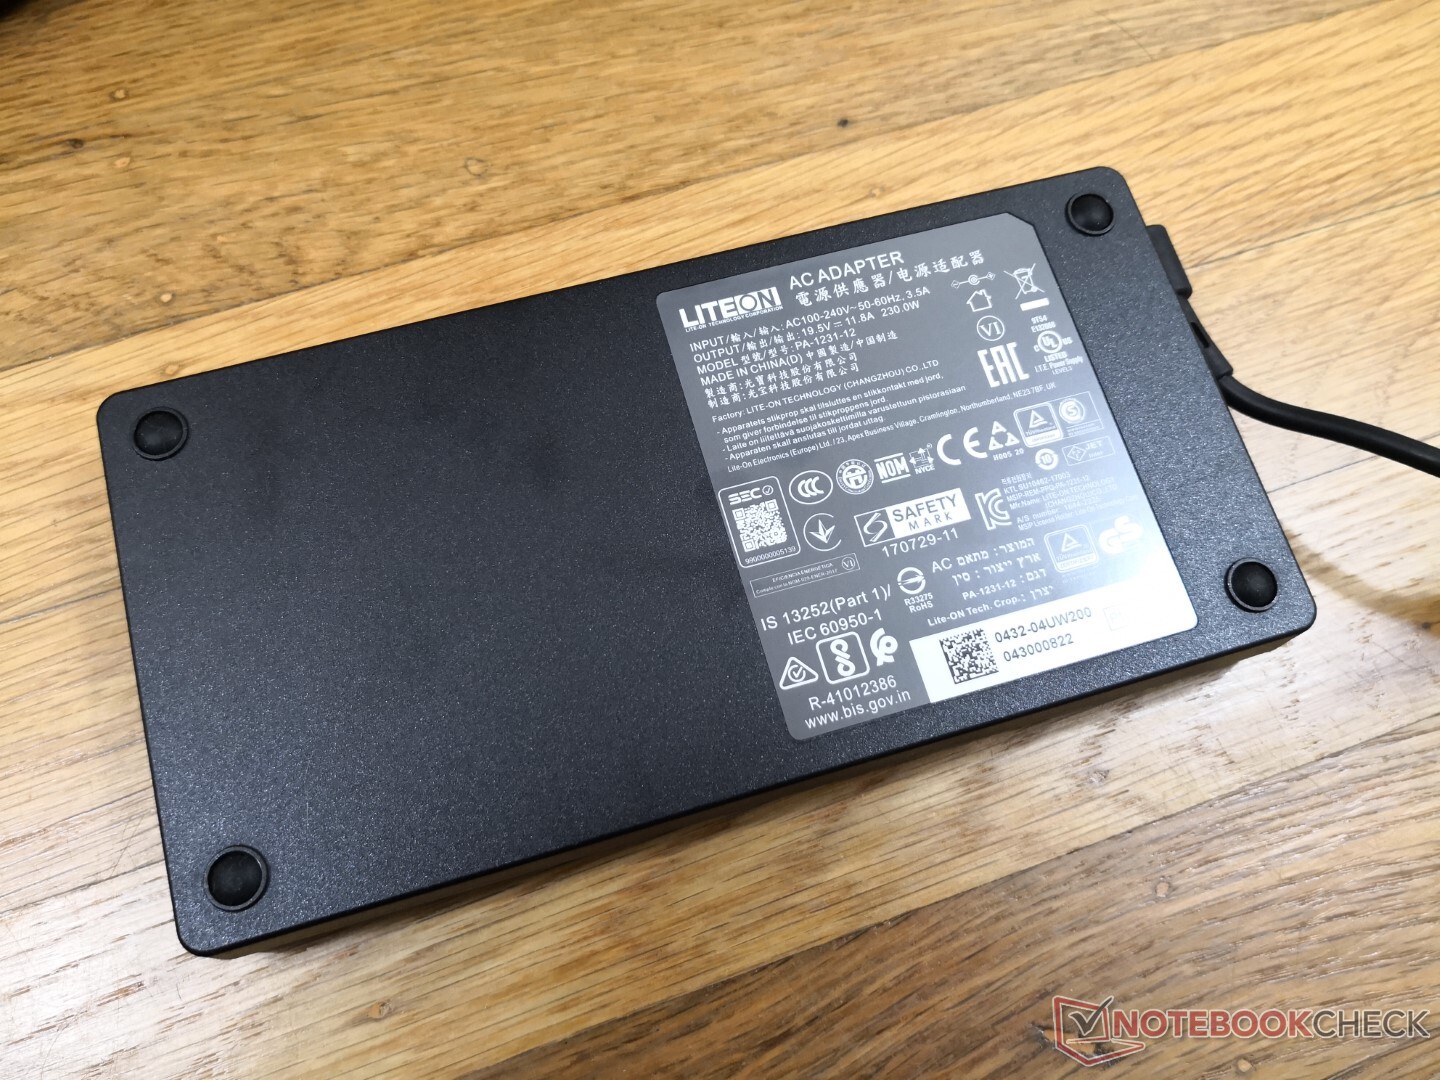
Максимальное потребление, отмеченное нами, составило 225 ватт и было достигнуто в нагрузочном тестировании утилитами Prime95 и FurMark. Мощность крупного, 20 на 10 на 2 сантиметра, блока питания составляет 240 ватт. Phantom Canyon поставляется с таким же блоком питания от Lite-On, что и Hades Canyon - новый можно будет подключить вместо старого и наборот.
| Выкл. | |
| Ожидание | |
| Нагрузка |
|
Легенда:
min: | |
| Intel NUC11PHKi7C i7-1165G7, GeForce RTX 2060 Mobile, Samsung SSD 980 Pro 500GB MZ-V8P500BW, , x, | Intel Hades Canyon NUC8i7HVK i7-8809G, Vega M GH, Intel Optane 120 GB SSDPEK1W120GA, , x, | Intel NUC11PAQi7 i7-1165G7, Iris Xe G7 96EUs, Samsung SSD 980 Pro 500GB MZ-V8P500BW, , x, | Zotac ZBOX Magnus EK71080 i7-7700HQ, GeForce GTX 1080 (Desktop), Samsung PM961 MZVLW256HEHP, , x, 0" | Aorus Gaming Box GeForce RTX 2080 Ti i7-1165G7, , , , x, | |
|---|---|---|---|---|---|
| Энергопотребление | -40% | 49% | -131% | -154% | |
| В простое, мин. * (Watt) | 5.8 | 15.5 -167% | 5.6 3% | 27.1 -367% | 29.6 -410% |
| В простое, сред. * (Watt) | 5.9 | 16.2 -175% | 5.6 5% | 27.4 -364% | 29.6 -402% |
| В простое, макс. * (Watt) | 20.7 | 16.5 20% | 6 71% | 28.8 -39% | 29.6 -43% |
| Нагрузка, сред. * (Watt) | 130.8 | 83.4 36% | 31.4 76% | 100.4 23% | 79.9 39% |
| Witcher 3 ultra * (Watt) | 154.4 | 121.7 21% | 39 75% | 243.1 -57% | 252 -63% |
| Нагрузка, макс. * (Watt) | 225.2 | 173.5 23% | 80.5 64% | 186.7 17% | 319.8 -42% |
* ... меньше = лучше
За
Против
Вердикт
Модель Phantom Canyon показывает, что в Intel окончательно попрощались с Kaby Lake-G и подобными экспериментами. Уникального партнёрства Intel и AMD нет, а есть самые обычные процессоры в паре с видеокартой мобильного сегмента. Пользователю эти перемены принесут более стабильные драйверы и отсутствие проблем в играх, которые попадались с моделью Hades Canyon.
Hades Canyon выглядит устаревшим на фоне Phantom Canyon. Самый новый энтузиастский NUC чуть вырос в размерах, но работает быстрее. Увеличения шума или нагрева не произошло, это очень важно.
Как и ожидалось, новинка работает быстрее Hades Canyon, причём температуры и уровень шума остались примерно теми же.
В числе минусов назовём прибавившиеся сантиметры и расход энергии, выросший по сравнению с моделью Hades Canyon. Большой размер блока питания и цена более 1000 долларов, это за платформу без SSD и RAM, не радуют тоже. Этот NUC, вероятно, купят только истинные фанаты неттопов NUC, ценящие и дизайн, и компактность, и качество, которое в Intel держат хорошим давно. Потому что за сравнимые деньги можно купить бюджетный игровой ноутбук со сравнимой мощью, но с SSD, RAM, экраном и всем прочим, что причитается.
Price comparison

