Notebookcheck Logo

Обзор мини-компьютера Zotac ZBOX Magnus в конфигурации с GeForce RTX 2080

Мал, да удал. Сегодняшний ZBOX Magnus очень близок по духу к Ghost Canyon, игровому NUC от Intel. Мы детально изучили возможности мини-компьютера Zotac и встретили несколько приятных сюрпризов. О них и не только - далее.

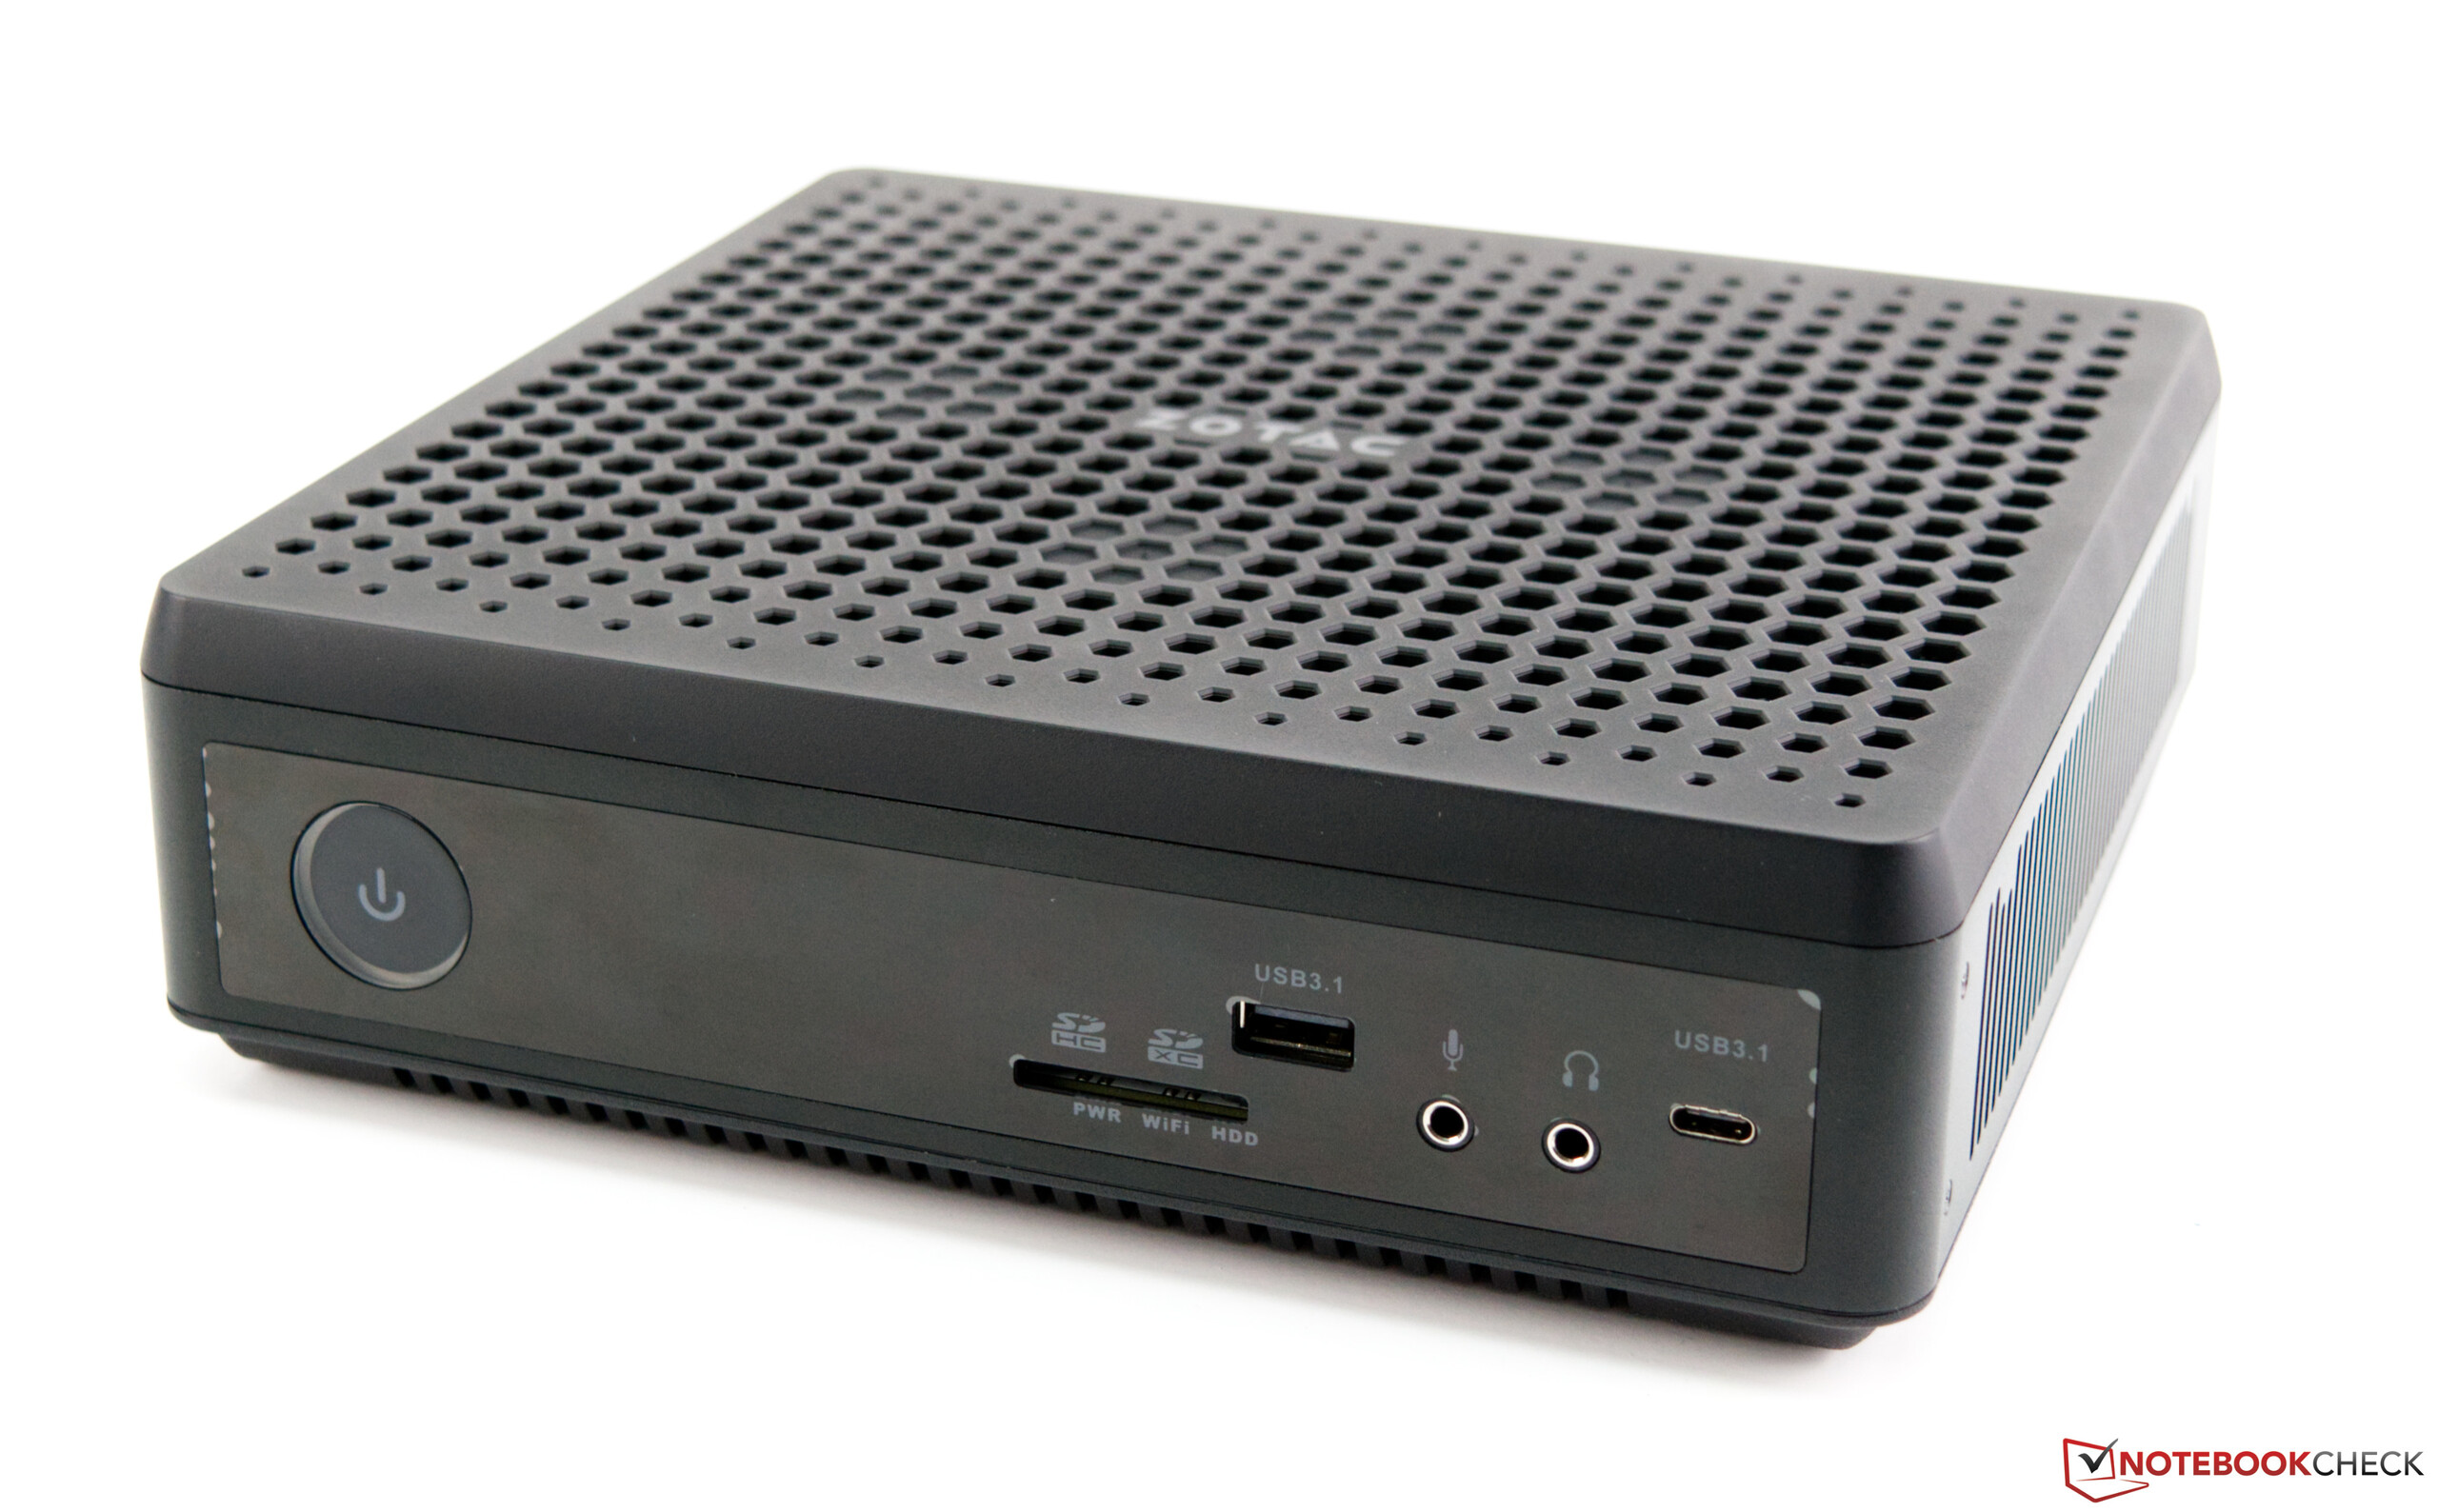
Компьютеры ZBOX присутствуют в продаже давно и не являются чем-то уникальным. В самой новой ревизии производитель сочетает девятитысячные процессоры Intel Core и видеокарты Nvidia архитектуры Turing. Речь идёт о компонентах, ориентированных на ноутбуки - так проще удержать потребление и нагрев в комфортных рамках. Ведь мини-компьютер должен быть компактным, и он есть, всего 21 на 20.3 сантиметра. Сравнительно мала и высота: 6.22 сантиметра.

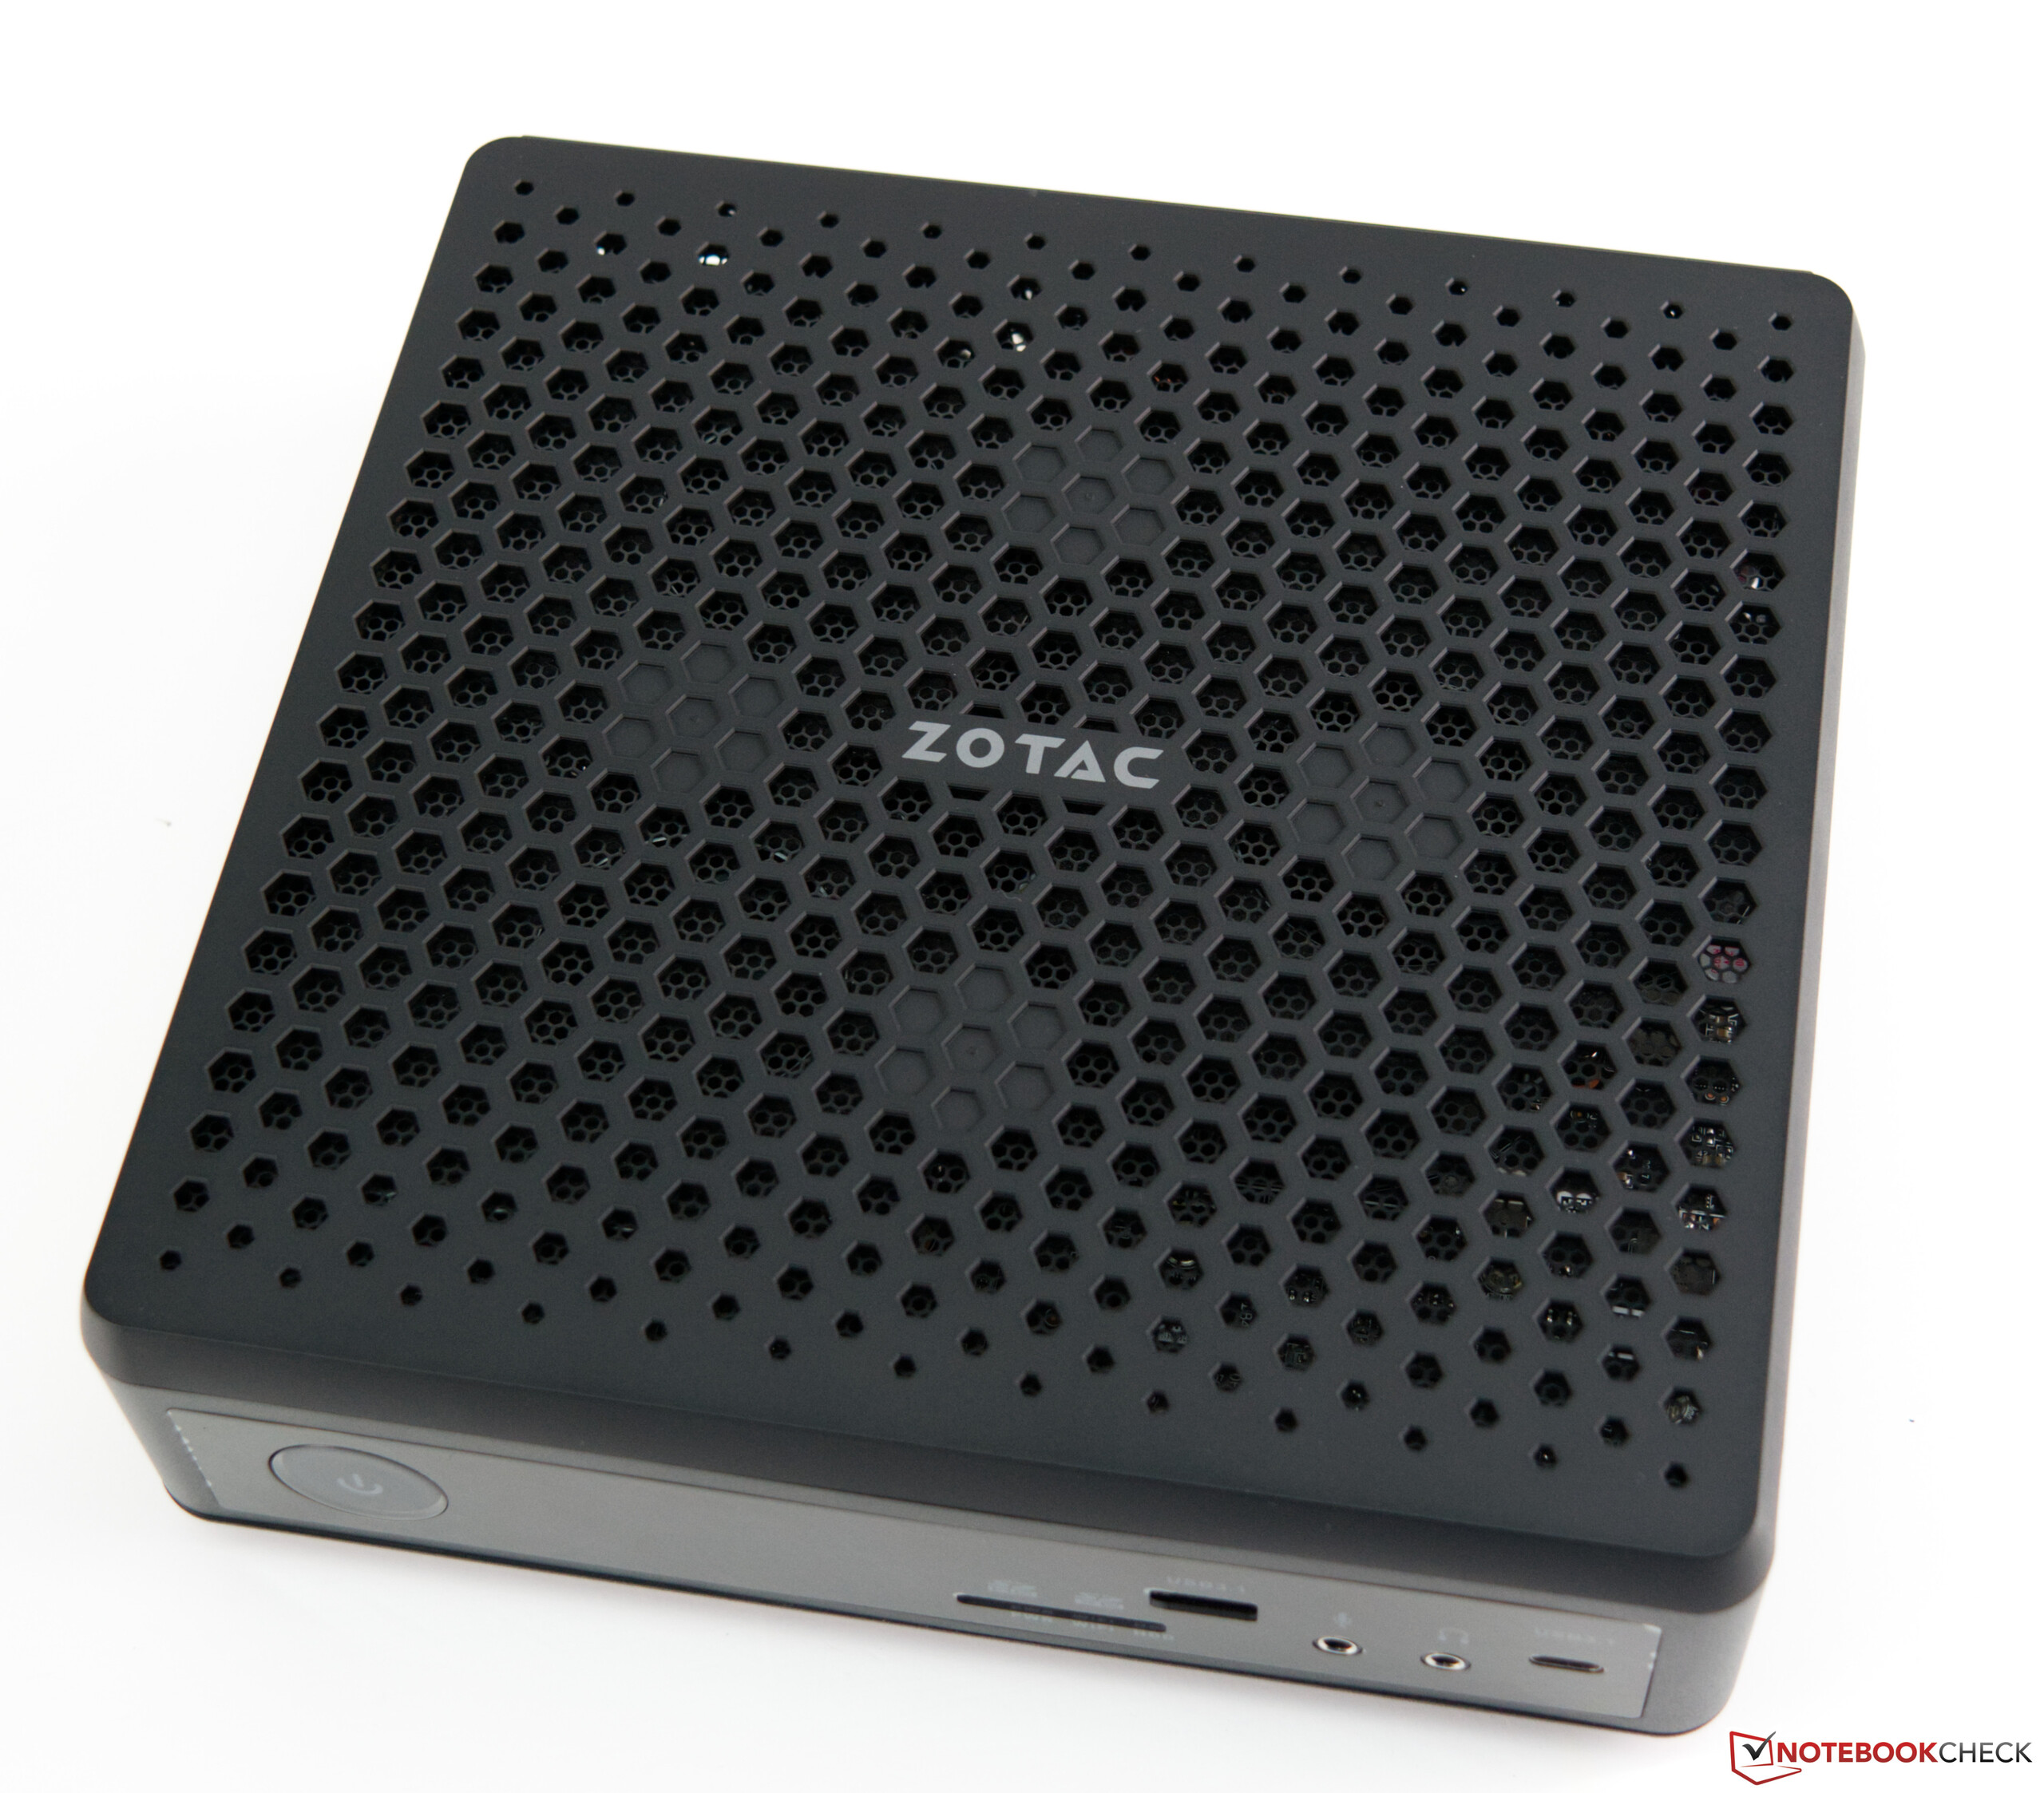
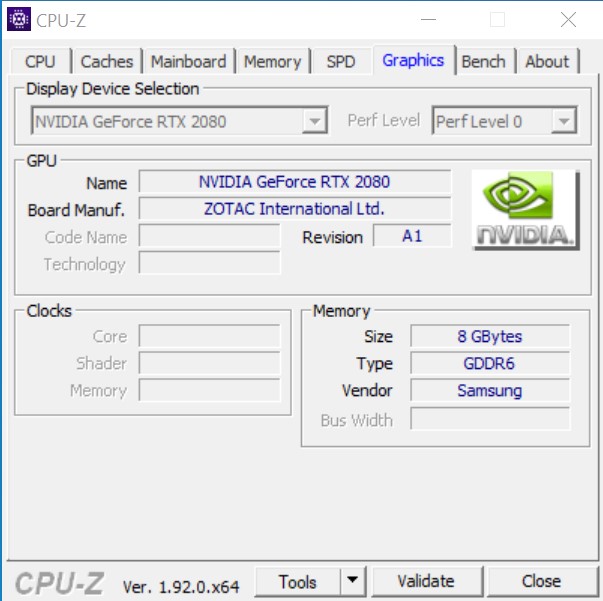
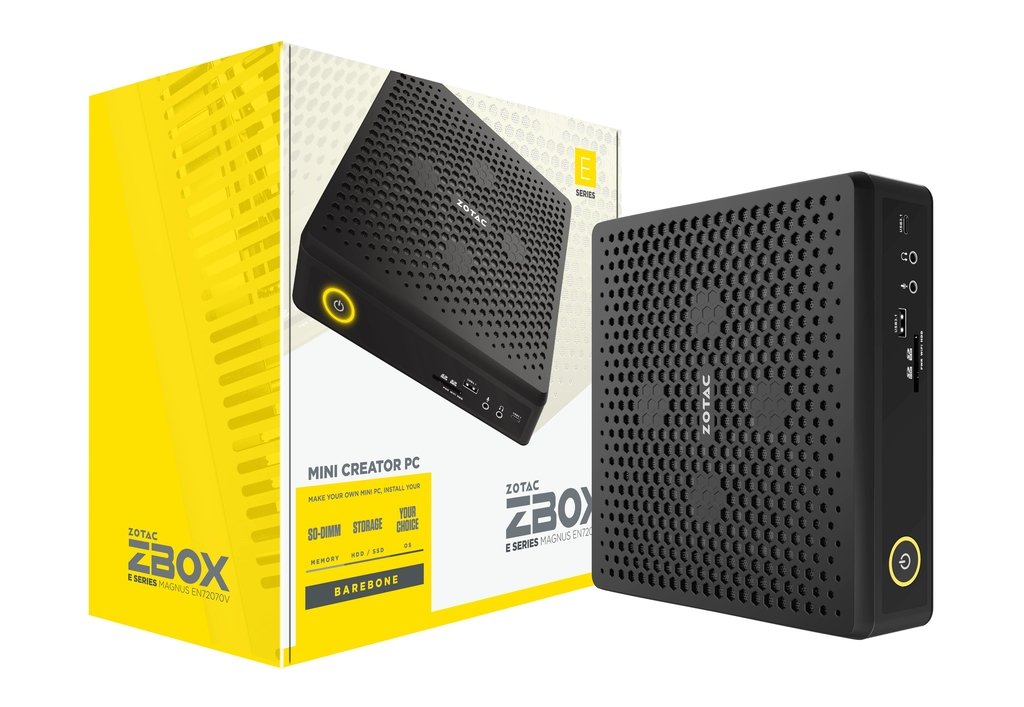
Корпус выглядит качественным, прочным и надёжным. Он целиком чёрный, без ярких или подсвечиваемых элементов. Они есть в Zotac MEK MINI, именно он больше подойдёт для тех, кто любит цветовую феерию. Сегодняшний ZBOX Magnus располагает процессором Intel Core i7-9750H с достаточной для современных игр производительностью, особенно в паре с GeForce RTX 2080 (для ноутбука), все компоненты которой распаяны на той же материнской плате, что и сам процессор. Подробнее о том, как местные компоненты справляются с играми, мы расскажем далее.

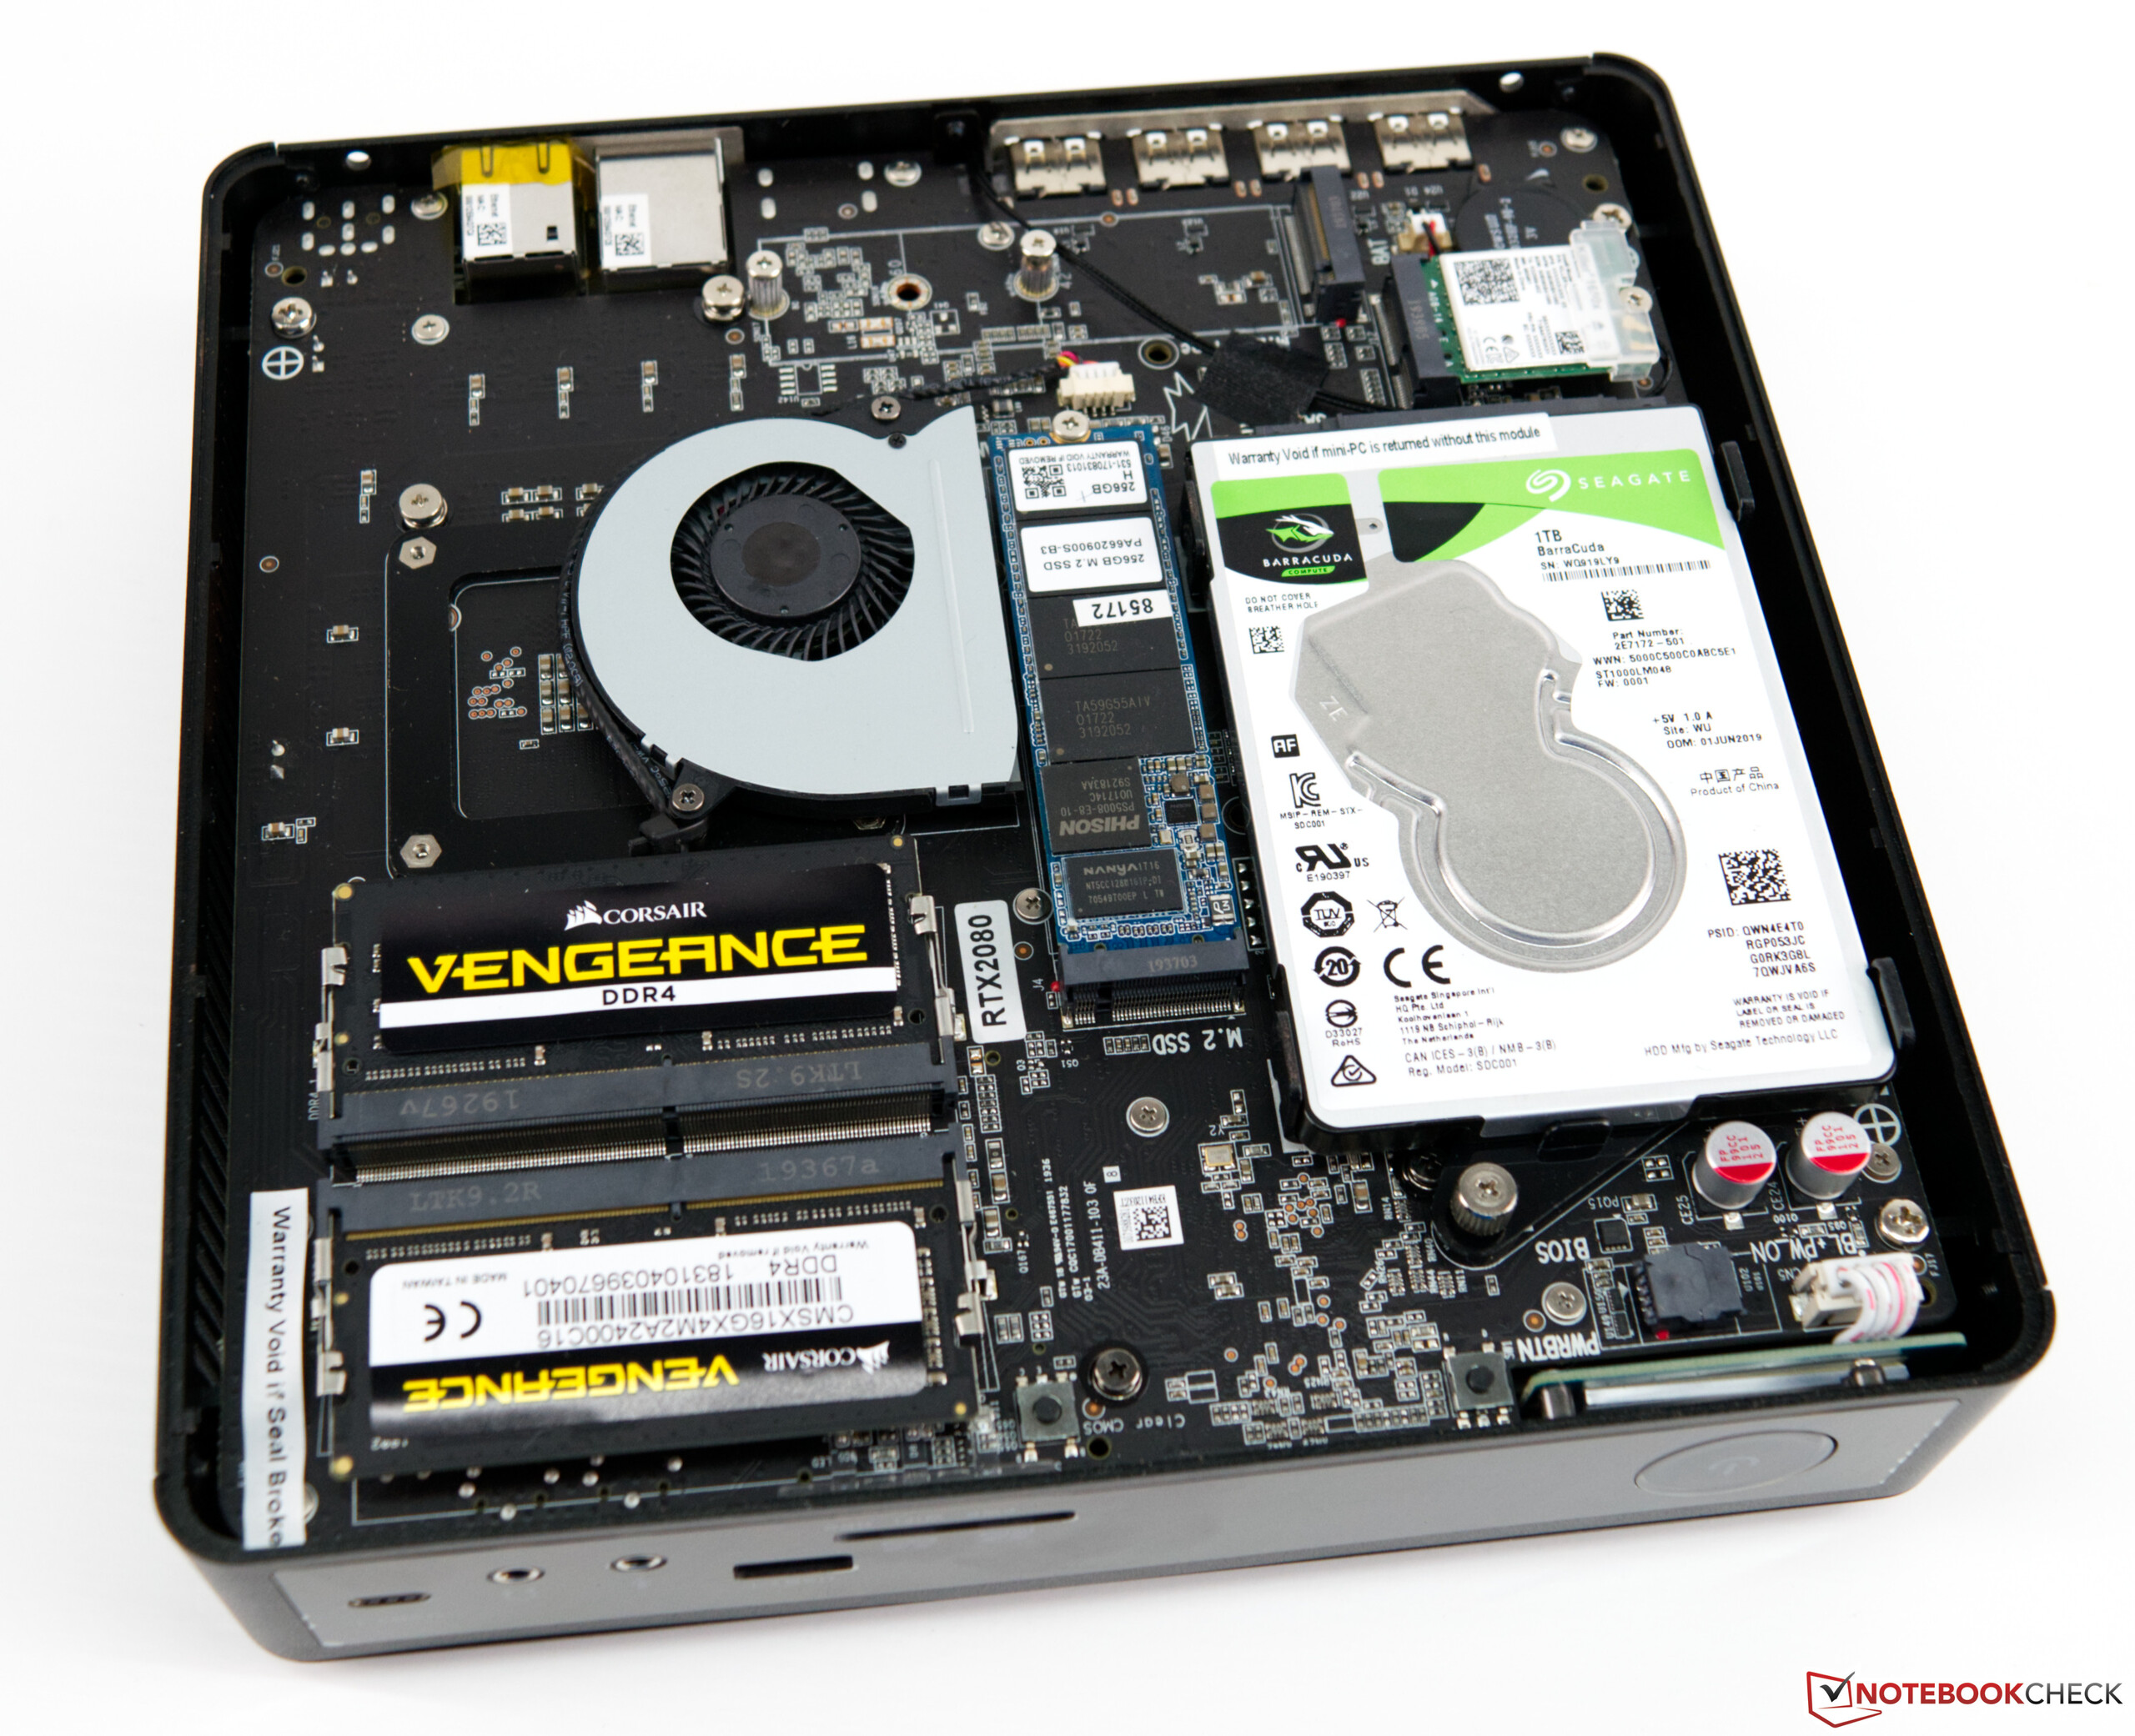
Сегодняшний ZBOX поставляется в виде баребона, иными словами, платформы. Он не несёт в себе оперативной и постоянной памяти, пользователю предоставляется возможность выбрать и установить эти компоненты самостоятельно, а не зависеть от выбора производителя.

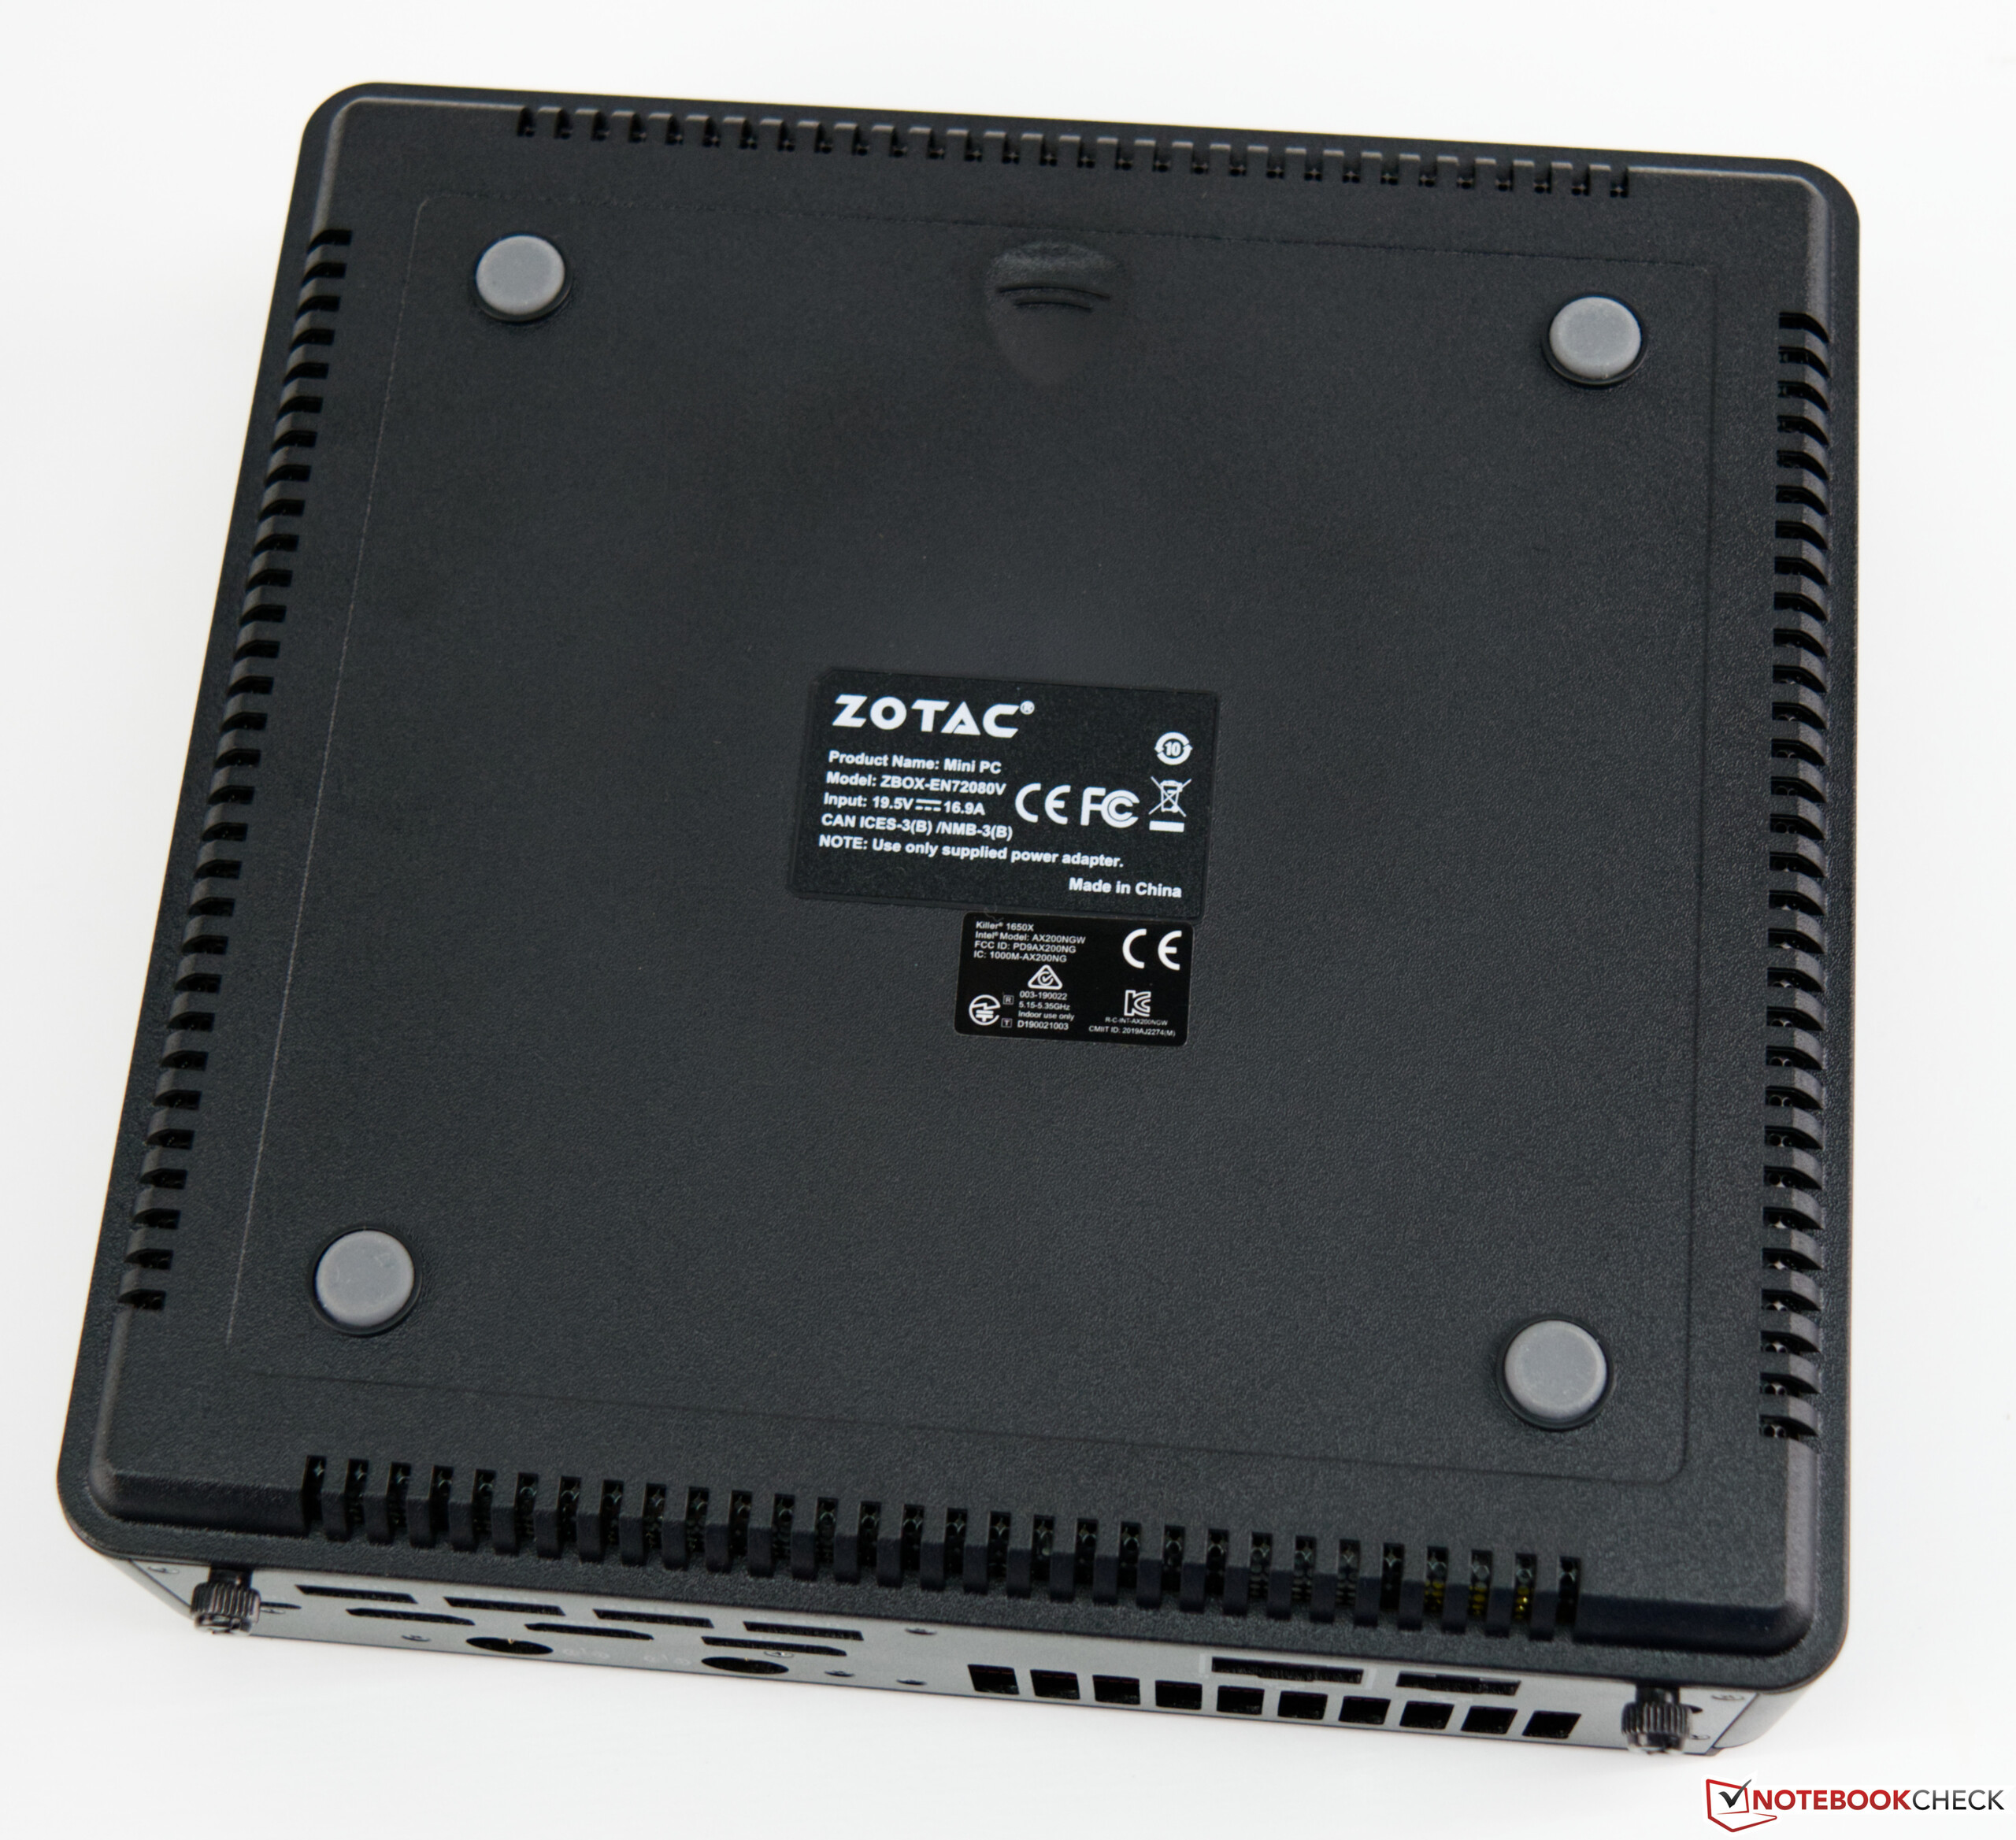
Стоимость модели EN72080V [в Германии] примерно равна 1700 евро.

Zotac ZBOX Magnus
Zotac ZBOX Magnus
Zotac ZBOX Magnus
Zotac ZBOX Magnus
Zotac ZBOX Magnus
Zotac ZBOX Magnus

Дизайн и особенности

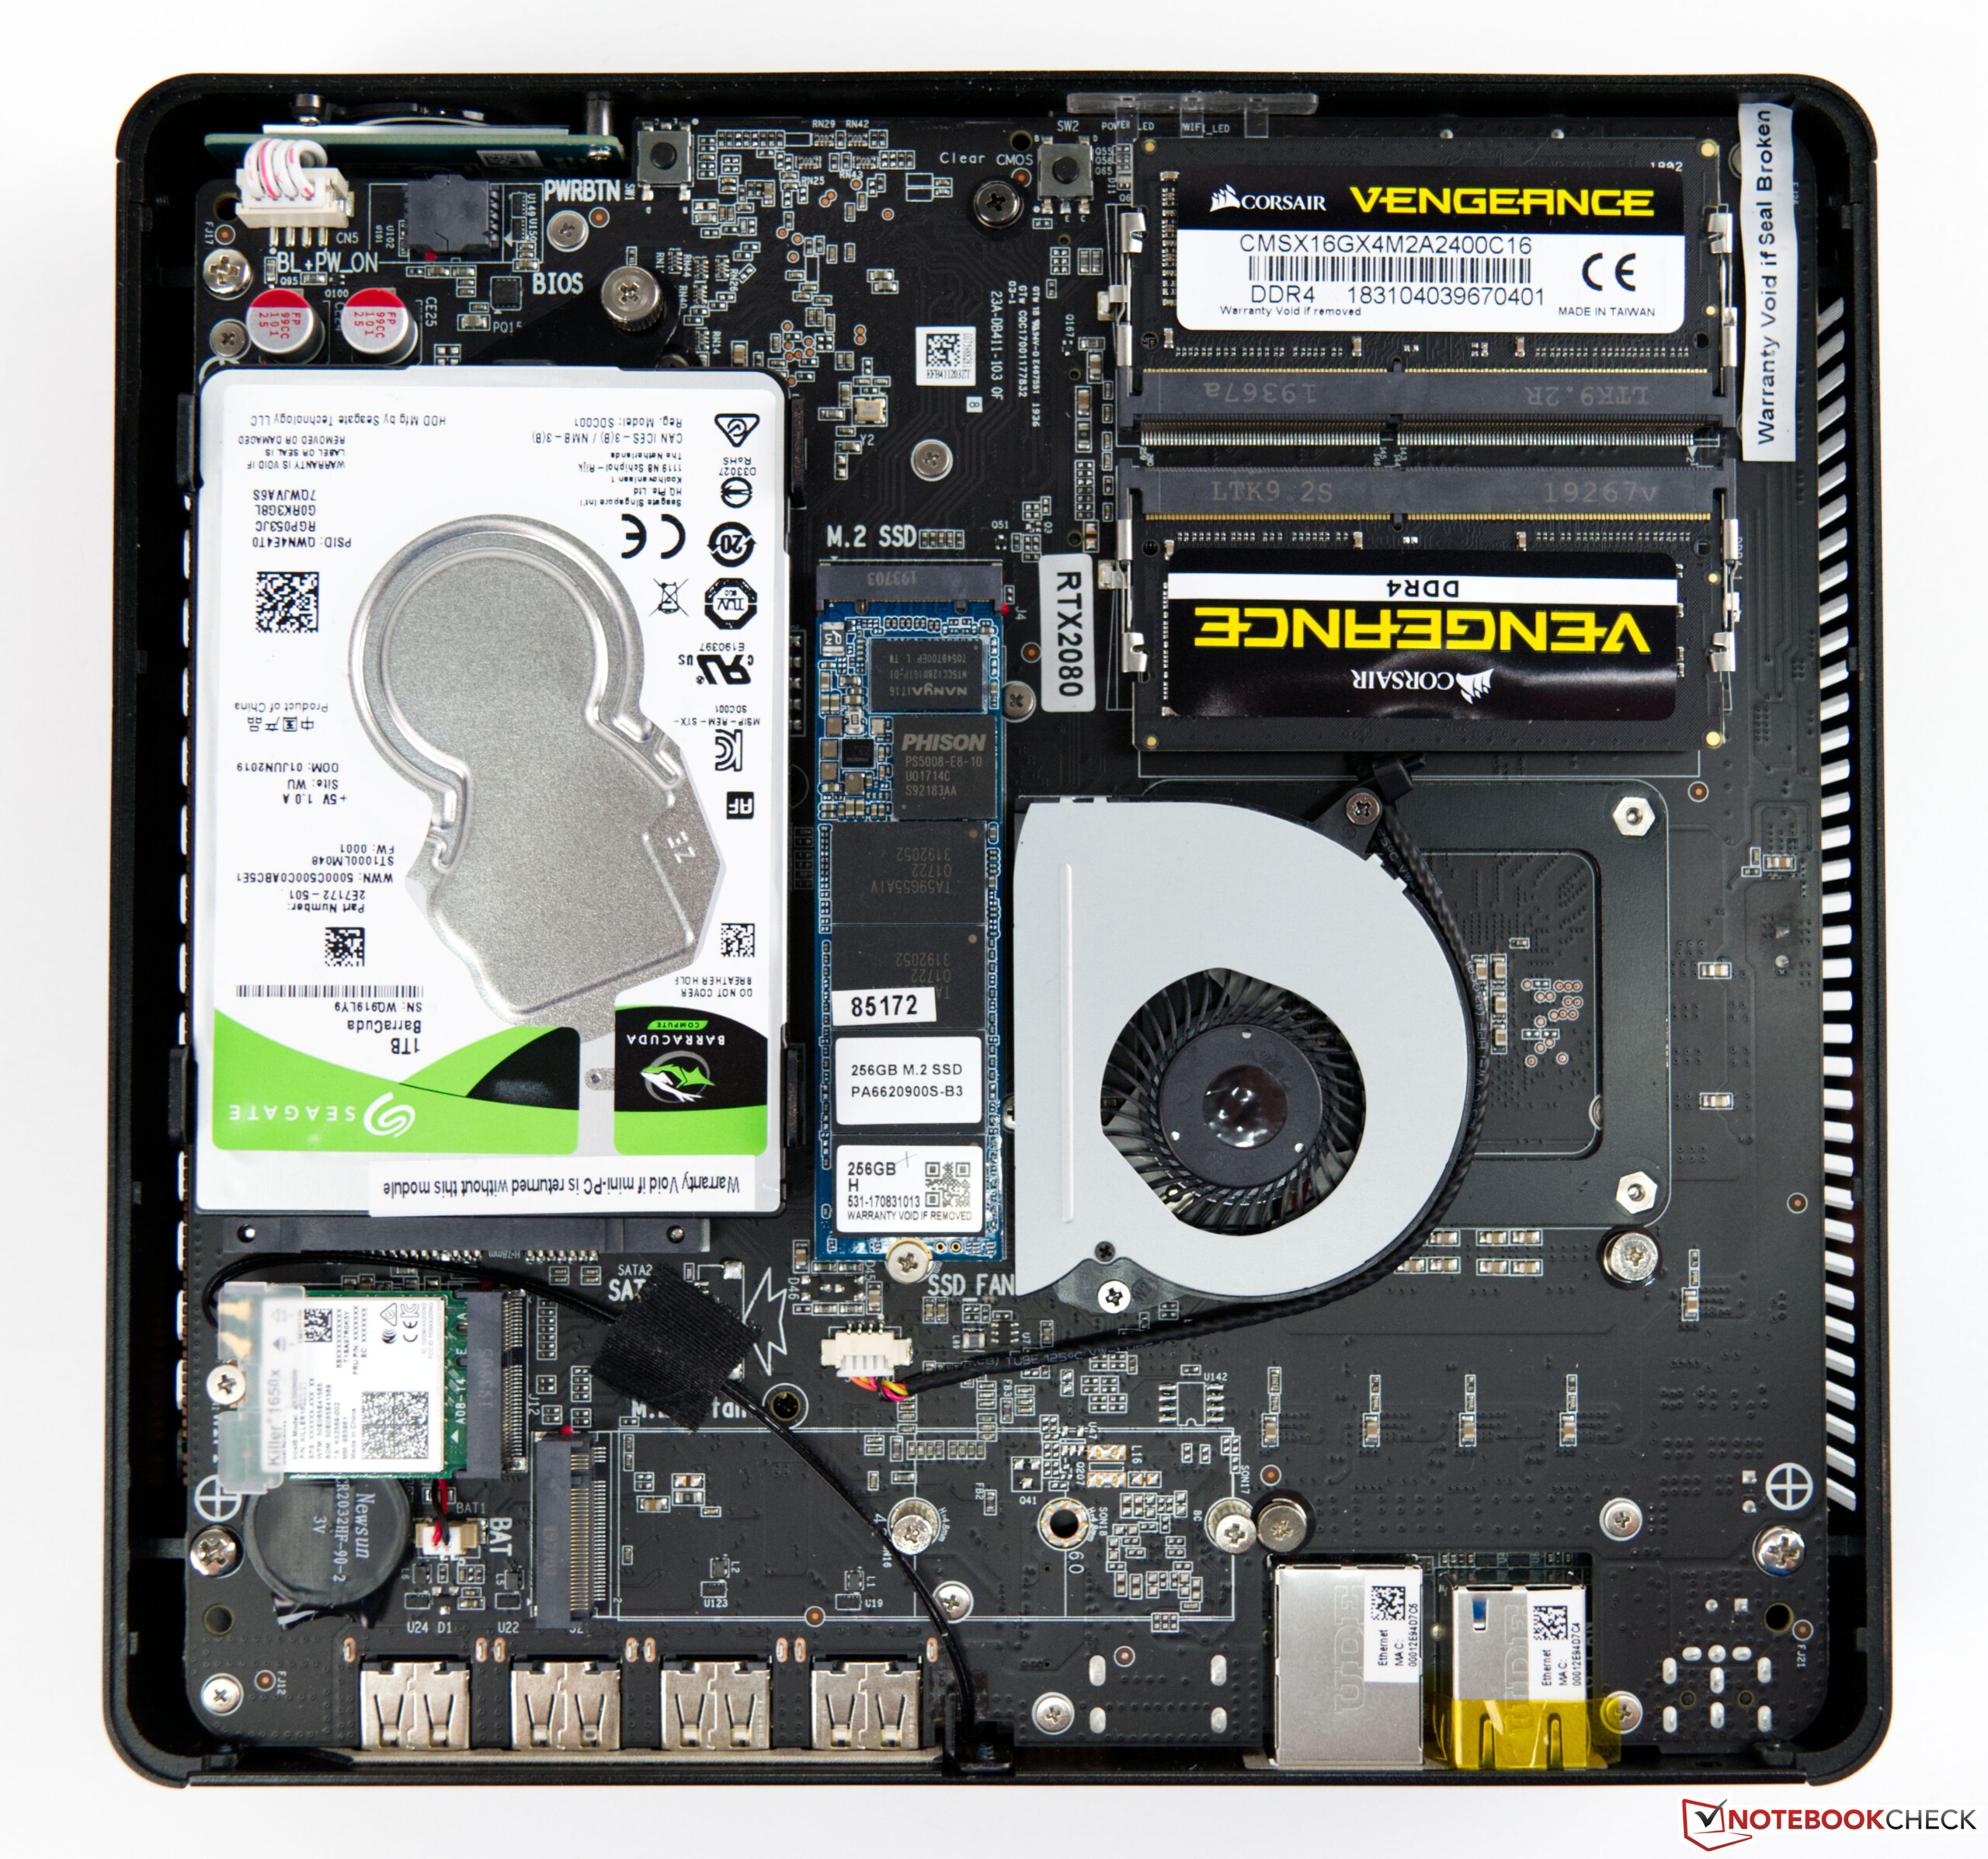
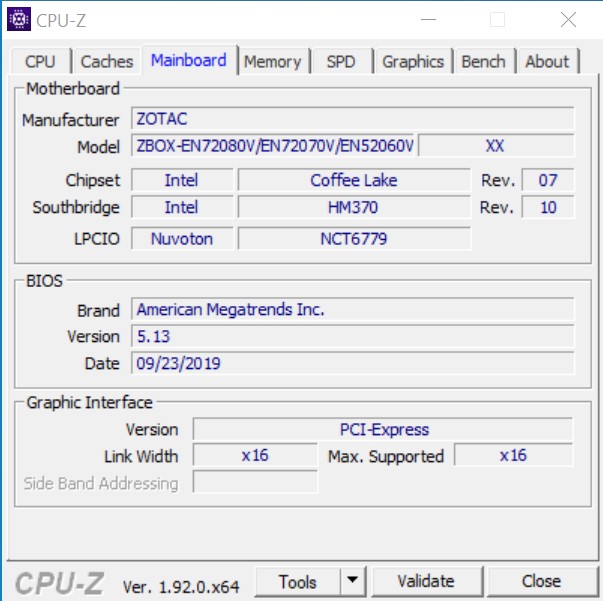
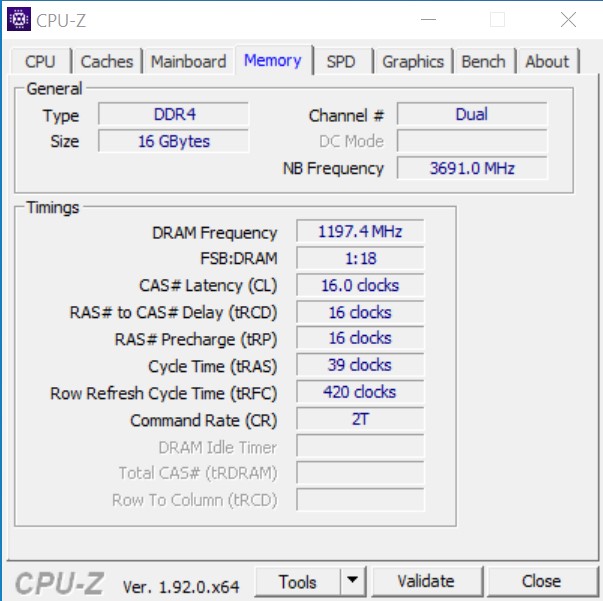
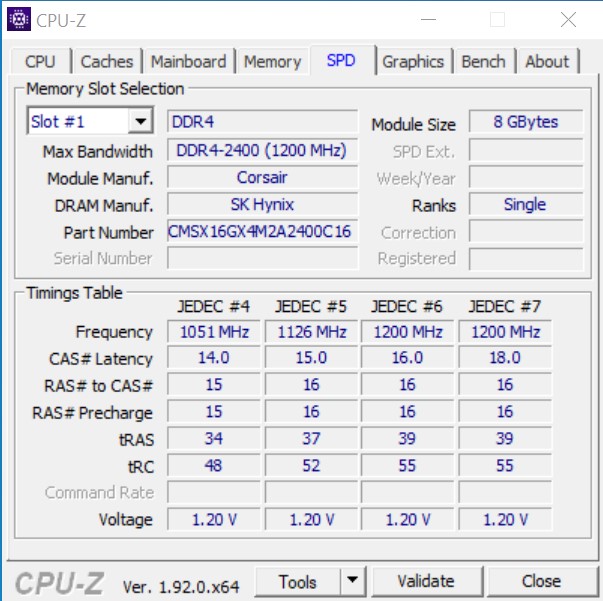
Zotac ZBOX Magnus поставляется в виде платформы. Право выбрать постоянную и оперативную память предоставляется пользователю, а всё остальное уже включено в комплектацию. Ключевые вычислительные компоненты тестового образца - это 9750H, процессор мобильного сегмента, и видеокарта RTX 2080 в издании для ноутбука. Порты сконцентрированы с задней и передней сторон компьютера, для организации сети есть Wi-Fi 6, Bluetooth 5 и два RJ-45 Ethernet.

SSD типоразмера M.2, а также жёсткий диск и оперативная память для этого обзора были предоставлены компанией Zotac. Максимальный рекомендуемый ими объём RAM равен 32 ГБ. [Отметим, Intel в официальных параметрах процессора 9750H говорит о 128 ГБ.]

Производительность

Процессор

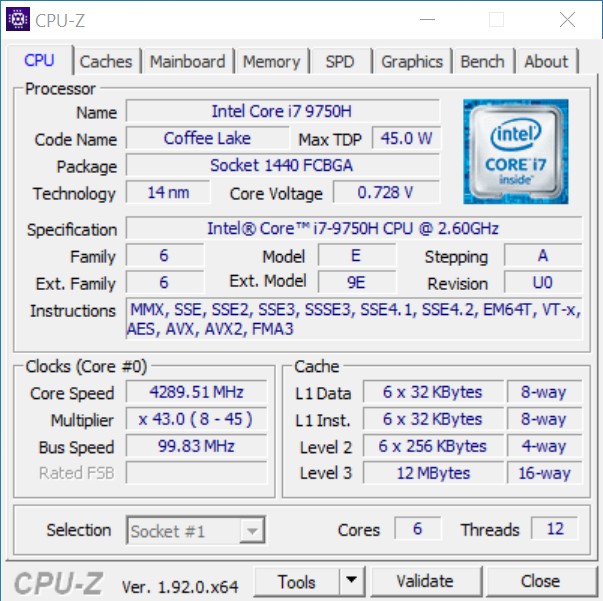
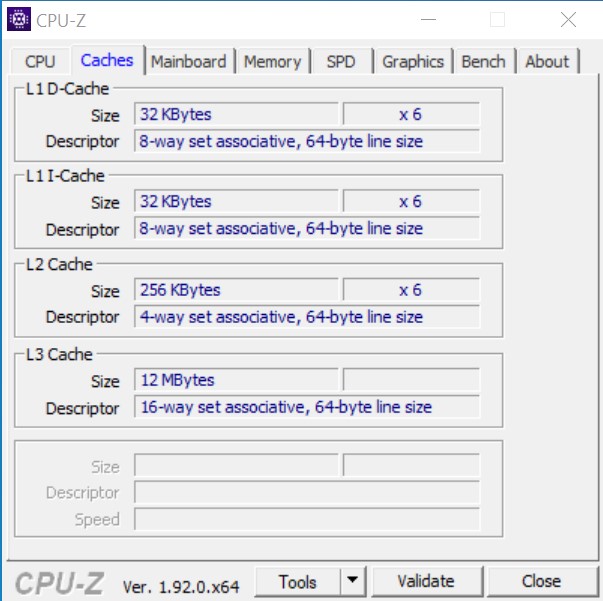
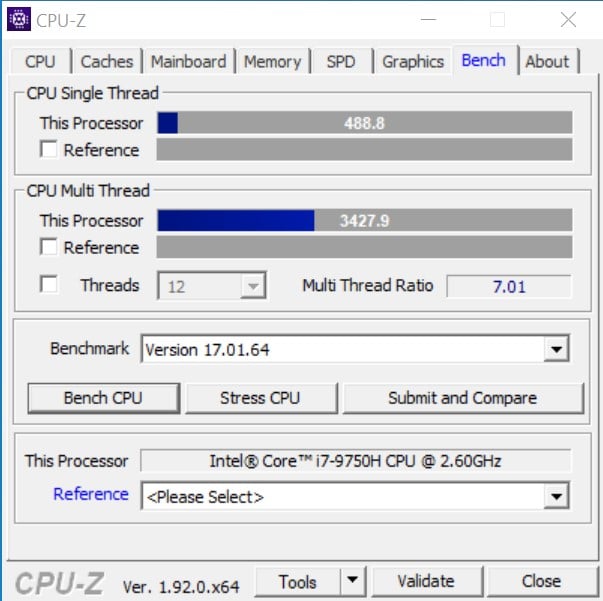
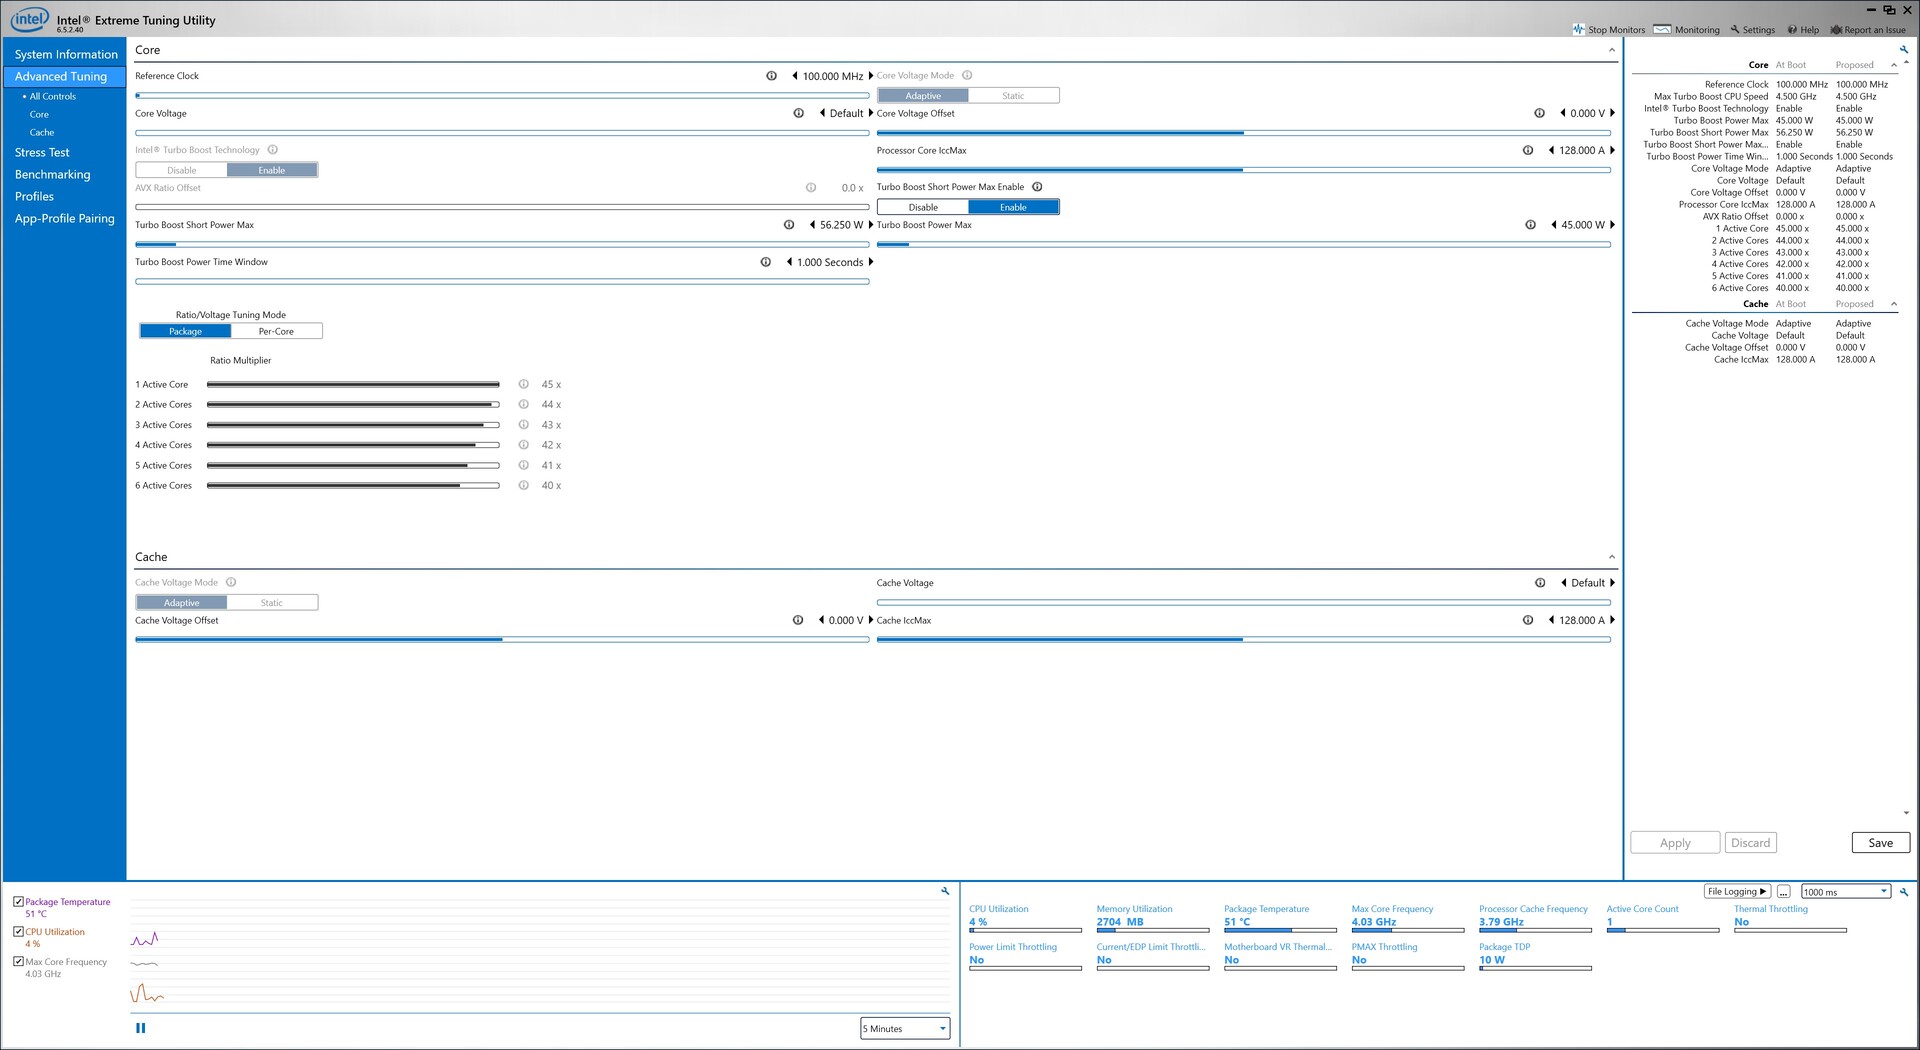
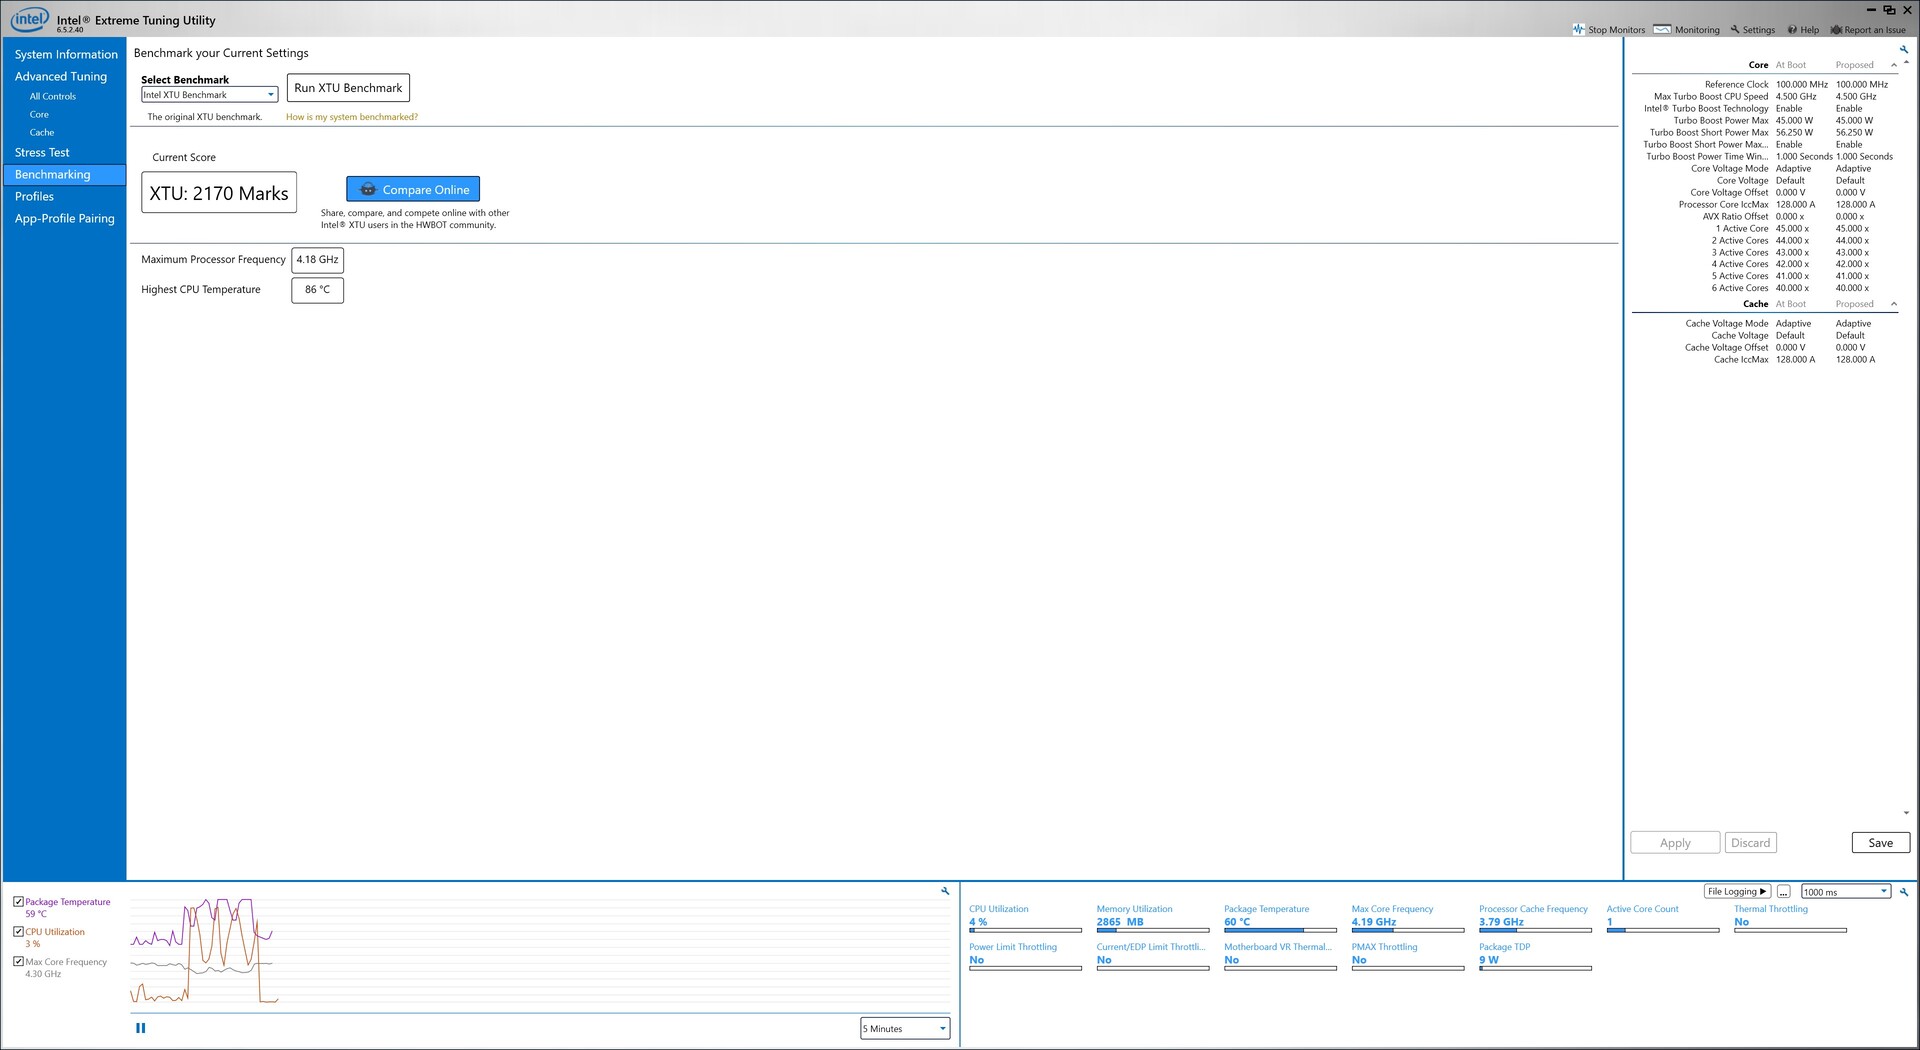
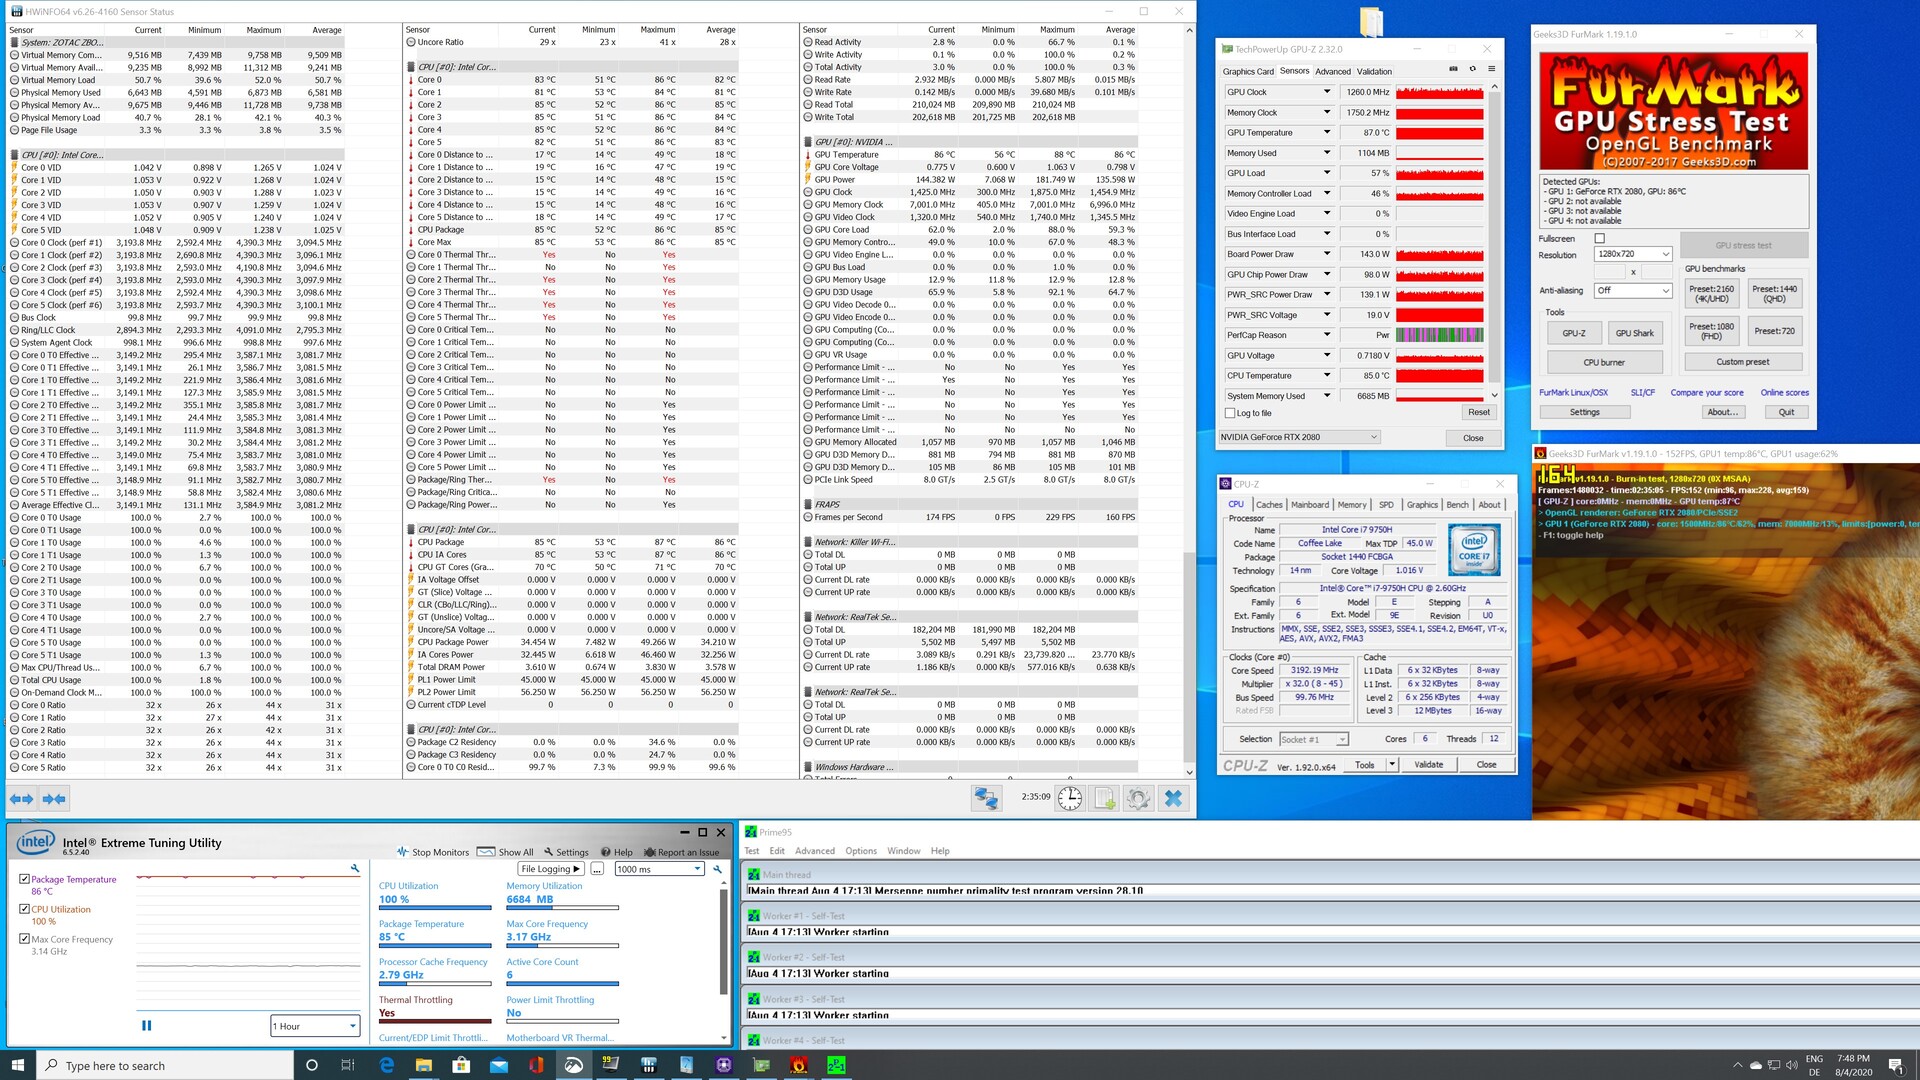
Шестиядерный Intel Core i7-9750H относится к верхнему уровню производительности и обычно используется в игровых ноутбуках. Разработчики Zotac выбрали его, а не i5-9400 или другой шестиядерный процессор настольного сегмента, из-за уменьшения габаритов [припаянный процессор занимает меньше места, чем установленный в сокет] и сниженного потребления энергии. Местный Core i7-9750H однозначно поставлен на хорошее довольствие в плане охлаждения и питания, так как его оценки в тестах на производительность опережают оценки усреднённого 9750H из нашей базы данных. Однако, прямое сравнение между тестовым образцом и Intel Ghost Canyon NUC выигрывает всё же последний, в нём установлен Core i9-9980HK с более высокими частотами и 8 ядрами.

CPU-Z
CPU-Z
CPU-Z
CPU-Z
CPU-Z
CPU-Z
CPU-Z
XTU
XTU - Тест на производительность
Cinebench R15
CPU Single 64Bit
Intel Core i9-10900K, NVIDIA Titan RTX
i9-10900K, 3700 МГц
224 Points +16%
Intel Core i9-9980HK, NVIDIA GeForce RTX 2070 (Desktop)
i9-9980HK, 2400 МГц
215 Points +11%
Intel Core i5-10600K, NVIDIA Titan RTX
i5-10600K, 4100 МГц
205 Points +6%
Усредн. модель с Intel Core i9-9980HK
  (181 - 215, n=13)
198.8 Points +3%
Intel Core i7-9750H, NVIDIA GeForce RTX 2080 Mobile
i7-9750H, 2600 МГц
193 Points
Усредн. модель с Intel Core i7-9750H
  (170 - 194, n=82)
183.7 Points -5%
Intel Core i5-9400F, NVIDIA Titan RTX
i5-9400F, 2900 МГц
173 Points -10%
Усредн. модель с Intel Core i5-9300H
  (169 - 176, n=11)
172.6 Points -11%
CPU Multi 64Bit
Intel Core i9-10900K, NVIDIA Titan RTX
i9-10900K, 3700 МГц
2620 Points +122%
Усредн. модель с Intel Core i9-9980HK
  (1327 - 1930, n=14)
1656 Points +40%
Intel Core i9-9980HK, NVIDIA GeForce RTX 2070 (Desktop)
i9-9980HK, 2400 МГц
1607 Points +36%
Intel Core i5-10600K, NVIDIA Titan RTX
i5-10600K, 4100 МГц
1452 Points +23%
Усредн. модель с Intel Core i7-9750H
  (952 - 1306, n=85)
1182 Points 0%
Intel Core i7-9750H, NVIDIA GeForce RTX 2080 Mobile
i7-9750H, 2600 МГц
1180 Points
Intel Core i5-9400F, NVIDIA Titan RTX
i5-9400F, 2900 МГц
984 Points -17%
Усредн. модель с Intel Core i5-9300H
  (717 - 850, n=11)
784 Points -34%
Cinebench R20
CPU (Single Core)
Intel Core i9-10900K, NVIDIA Titan RTX
i9-10900K, 3700 МГц
532 Points +9%
Intel Core i9-9980HK, NVIDIA GeForce RTX 2070 (Desktop)
i9-9980HK, 2400 МГц
504 Points +4%
Intel Core i7-9750H, NVIDIA GeForce RTX 2080 Mobile
i7-9750H, 2600 МГц
486 Points
Усредн. модель с Intel Core i9-9980HK
  (431 - 505, n=10)
471 Points -3%
Intel Core i5-10600K, NVIDIA Titan RTX
i5-10600K, 4100 МГц
464 Points -5%
Усредн. модель с Intel Core i7-9750H
  (416 - 486, n=55)
443 Points -9%
Intel Core i5-9400F, NVIDIA Titan RTX
i5-9400F, 2900 МГц
416 Points -14%
Усредн. модель с Intel Core i5-9300H
  (398 - 427, n=9)
415 Points -15%
CPU (Multi Core)
Intel Core i9-10900K, NVIDIA Titan RTX
i9-10900K, 3700 МГц
6381 Points +138%
Усредн. модель с Intel Core i9-9980HK
  (2974 - 4150, n=10)
3530 Points +32%
Intel Core i5-10600K, NVIDIA Titan RTX
i5-10600K, 4100 МГц
3443 Points +29%
Intel Core i9-9980HK, NVIDIA GeForce RTX 2070 (Desktop)
i9-9980HK, 2400 МГц
3357 Points +25%
Intel Core i7-9750H, NVIDIA GeForce RTX 2080 Mobile
i7-9750H, 2600 МГц
2679 Points
Усредн. модель с Intel Core i7-9750H
  (2017 - 3133, n=55)
2564 Points -4%
Intel Core i5-9400F, NVIDIA Titan RTX
i5-9400F, 2900 МГц
2378 Points -11%
Усредн. модель с Intel Core i5-9300H
  (1530 - 1877, n=9)
1727 Points -36%
Cinebench R11.5
CPU Single 64Bit
Intel Core i9-10900K, NVIDIA Titan RTX
i9-10900K, 3700 МГц
2.56 Points +17%
Intel Core i9-9980HK, NVIDIA GeForce RTX 2070 (Desktop)
i9-9980HK, 2400 МГц
2.4 Points +10%
Усредн. модель с Intel Core i9-9980HK
  (2.25 - 2.4, n=3)
2.31 Points +5%
Intel Core i5-10600K, NVIDIA Titan RTX
i5-10600K, 4100 МГц
2.19 Points 0%
Intel Core i7-9750H, NVIDIA GeForce RTX 2080 Mobile
i7-9750H, 2600 МГц
2.19 Points
Усредн. модель с Intel Core i7-9750H
  (1.96 - 2.19, n=10)
2.1 Points -4%
Intel Core i5-9400F, NVIDIA Titan RTX
i5-9400F, 2900 МГц
1.95 Points -11%
CPU Multi 64Bit
Intel Core i9-10900K, NVIDIA Titan RTX
i9-10900K, 3700 МГц
29.03 Points +124%
Intel Core i9-9980HK, NVIDIA GeForce RTX 2070 (Desktop)
i9-9980HK, 2400 МГц
18.04 Points +39%
Усредн. модель с Intel Core i9-9980HK
  (14.8 - 18, n=3)
16.7 Points +29%
Intel Core i5-10600K, NVIDIA Titan RTX
i5-10600K, 4100 МГц
15.76 Points +22%
Усредн. модель с Intel Core i7-9750H
  (11.3 - 14.1, n=10)
13 Points 0%
Intel Core i7-9750H, NVIDIA GeForce RTX 2080 Mobile
i7-9750H, 2600 МГц
12.96 Points
Intel Core i5-9400F, NVIDIA Titan RTX
i5-9400F, 2900 МГц
11.27 Points -13%
Cinebench R10
Rendering Single CPUs 64Bit
Intel Core i9-10900K, NVIDIA Titan RTX
i9-10900K, 3700 МГц
10625 Points +14%
Intel Core i9-9980HK, NVIDIA GeForce RTX 2070 (Desktop)
i9-9980HK, 2400 МГц
10359 Points +11%
Усредн. модель с Intel Core i9-9980HK
  ()
10359 Points +11%
Intel Core i5-10600K, NVIDIA Titan RTX
i5-10600K, 4100 МГц
9594 Points +3%
Intel Core i7-9750H, NVIDIA GeForce RTX 2080 Mobile
i7-9750H, 2600 МГц
9346 Points
Усредн. модель с Intel Core i7-9750H
  (9069 - 9346, n=3)
9165 Points -2%
Intel Core i5-9400F, NVIDIA Titan RTX
i5-9400F, 2900 МГц
8182 Points -12%
Rendering Multiple CPUs 64Bit
Intel Core i9-10900K, NVIDIA Titan RTX
i9-10900K, 3700 МГц
80495 Points +82%
Intel Core i9-9980HK, NVIDIA GeForce RTX 2070 (Desktop)
i9-9980HK, 2400 МГц
55742 Points +26%
Усредн. модель с Intel Core i9-9980HK
  ()
55742 Points +26%
Intel Core i5-10600K, NVIDIA Titan RTX
i5-10600K, 4100 МГц
51816 Points +17%
Intel Core i7-9750H, NVIDIA GeForce RTX 2080 Mobile
i7-9750H, 2600 МГц
44238 Points
Усредн. модель с Intel Core i7-9750H
  (37188 - 44238, n=3)
40129 Points -9%
Intel Core i5-9400F, NVIDIA Titan RTX
i5-9400F, 2900 МГц
40065 Points -9%
Blender - v2.79 BMW27 CPU
Усредн. модель с Intel Core i5-9300H
  (588 - 643, n=3)
611 Seconds * -49%
Intel Core i5-9400F, NVIDIA Titan RTX
i5-9400F, 2900 МГц
468.5 Seconds * -14%
Усредн. модель с Intel Core i7-9750H
  (342 - 495, n=21)
433 Seconds * -6%
Intel Core i7-9750H, NVIDIA GeForce RTX 2080 Mobile
i7-9750H, 2600 МГц
409.6 Seconds *
Усредн. модель с Intel Core i9-9980HK
  (317 - 527, n=3)
398 Seconds * +3%
Intel Core i9-9980HK, NVIDIA GeForce RTX 2070 (Desktop)
i9-9980HK, 2400 МГц
317.4 Seconds * +23%
Intel Core i5-10600K, NVIDIA Titan RTX
i5-10600K, 4100 МГц
302.4 Seconds * +26%
Intel Core i9-10900K, NVIDIA Titan RTX
i9-10900K, 3700 МГц
167.3 Seconds * +59%
wPrime 2.10
32m
Intel Core i5-9400F, NVIDIA Titan RTX
i5-9400F, 2900 МГц
6.757 s * -37%
Intel Core i7-9750H, NVIDIA GeForce RTX 2080 Mobile
i7-9750H, 2600 МГц
4.932 s *
Усредн. модель с Intel Core i7-9750H
  ()
4.93 s * -0%
Intel Core i5-10600K, NVIDIA Titan RTX
i5-10600K, 4100 МГц
4.648 s * +6%
Усредн. модель с Intel Core i9-9980HK
  (3.79 - 4.94, n=2)
4.36 s * +12%
Intel Core i9-9980HK, NVIDIA GeForce RTX 2070 (Desktop)
i9-9980HK, 2400 МГц
3.788 s * +23%
Intel Core i9-10900K, NVIDIA Titan RTX
i9-10900K, 3700 МГц
3.582 s * +27%
1024m
Intel Core i5-9400F, NVIDIA Titan RTX
i5-9400F, 2900 МГц
198.7 s * -29%
Intel Core i7-9750H, NVIDIA GeForce RTX 2080 Mobile
i7-9750H, 2600 МГц
154.4 s *
Усредн. модель с Intel Core i7-9750H
  ()
154.4 s * -0%
Intel Core i9-9980HK, NVIDIA GeForce RTX 2070 (Desktop)
i9-9980HK, 2400 МГц
120.2 s * +22%
Усредн. модель с Intel Core i9-9980HK
  (110.4 - 120.2, n=2)
115.3 s * +25%
Intel Core i5-10600K, NVIDIA Titan RTX
i5-10600K, 4100 МГц
113.2 s * +27%
Intel Core i9-10900K, NVIDIA Titan RTX
i9-10900K, 3700 МГц
66.3 s * +57%
X264 HD Benchmark 4.0
Pass 1
Intel Core i9-10900K, NVIDIA Titan RTX
i9-10900K, 3700 МГц
289.5 (289min - 291max) fps +37%
Intel Core i5-10600K, NVIDIA Titan RTX
i5-10600K, 4100 МГц
251.5 (250min - 253max) fps +19%
Усредн. модель с Intel Core i9-9980HK
  (238 - 239, n=2)
238 fps +13%
Intel Core i9-9980HK, NVIDIA GeForce RTX 2070 (Desktop)
i9-9980HK, 2400 МГц
237.5 (236min - 239max) fps +13%
Intel Core i5-9400F, NVIDIA Titan RTX
i5-9400F, 2900 МГц
234 (233min - 234max) fps +11%
Усредн. модель с Intel Core i7-9750H
  (211 - 219, n=2)
215 fps +2%
Intel Core i7-9750H, NVIDIA GeForce RTX 2080 Mobile
i7-9750H, 2600 МГц
211 (208min - 214max) fps
Усредн. модель с Intel Core i5-9300H
  ()
193.7 fps -8%
Pass 2
Intel Core i9-10900K, NVIDIA Titan RTX
i9-10900K, 3700 МГц
149 (149min - 149max) fps +110%
Усредн. модель с Intel Core i9-9980HK
  (92.8 - 94.8, n=2)
93.8 fps +32%
Intel Core i9-9980HK, NVIDIA GeForce RTX 2070 (Desktop)
i9-9980HK, 2400 МГц
92.8 (89.1min - 100max) fps +31%
Intel Core i5-10600K, NVIDIA Titan RTX
i5-10600K, 4100 МГц
88.2 (88min - 88.2max) fps +24%
Intel Core i7-9750H, NVIDIA GeForce RTX 2080 Mobile
i7-9750H, 2600 МГц
70.9 (70min - 71.6max) fps
Усредн. модель с Intel Core i7-9750H
  (69.6 - 70.9, n=2)
70.3 fps -1%
Intel Core i5-9400F, NVIDIA Titan RTX
i5-9400F, 2900 МГц
64 (63.9min - 64.1max) fps -10%
Усредн. модель с Intel Core i5-9300H
  ()
49.4 fps -30%
WinRAR - Result
Intel Core i9-10900K, NVIDIA Titan RTX
i9-10900K, 3700 МГц
9739 KB/s +58%
Усредн. модель с Intel Core i9-9980HK
  (7266 - 7436, n=2)
7351 KB/s +19%
Intel Core i9-9980HK, NVIDIA GeForce RTX 2070 (Desktop)
i9-9980HK, 2400 МГц
7266 KB/s +18%
Intel Core i5-10600K, NVIDIA Titan RTX
i5-10600K, 4100 МГц
6536 KB/s +6%
Усредн. модель с Intel Core i7-9750H
  (6160 - 6631, n=2)
6396 KB/s +4%
Intel Core i7-9750H, NVIDIA GeForce RTX 2080 Mobile
i7-9750H, 2600 МГц
6160 KB/s
Intel Core i5-9400F, NVIDIA Titan RTX
i5-9400F, 2900 МГц
5794 KB/s -6%
Усредн. модель с Intel Core i5-9300H
  ()
5663 KB/s -8%
TrueCrypt
AES Mean 100MB
Intel Core i9-10900K, NVIDIA Titan RTX
i9-10900K, 3700 МГц
14.6 GB/s +97%
Усредн. модель с Intel Core i9-9980HK
  (10.1 - 10.3, n=2)
10.2 GB/s +38%
Intel Core i9-9980HK, NVIDIA GeForce RTX 2070 (Desktop)
i9-9980HK, 2400 МГц
10.1 GB/s +36%
Intel Core i5-10600K, NVIDIA Titan RTX
i5-10600K, 4100 МГц
8 GB/s +8%
Intel Core i7-9750H, NVIDIA GeForce RTX 2080 Mobile
i7-9750H, 2600 МГц
7.4 GB/s
Усредн. модель с Intel Core i7-9750H
  (7.3 - 7.4, n=2)
7.35 GB/s -1%
Intel Core i5-9400F, NVIDIA Titan RTX
i5-9400F, 2900 МГц
5.2 GB/s -30%
Усредн. модель с Intel Core i5-9300H
  ()
4.7 GB/s -36%
Twofish Mean 100MB
Intel Core i9-10900K, NVIDIA Titan RTX
i9-10900K, 3700 МГц
2.6 GB/s +117%
Intel Core i9-9980HK, NVIDIA GeForce RTX 2070 (Desktop)
i9-9980HK, 2400 МГц
1.7 GB/s +42%
Усредн. модель с Intel Core i9-9980HK
  (1.7 - 1.7, n=2)
1.7 GB/s +42%
Intel Core i5-10600K, NVIDIA Titan RTX
i5-10600K, 4100 МГц
1.4 GB/s +17%
Усредн. модель с Intel Core i7-9750H
  (1.2 - 1.3, n=2)
1.25 GB/s +4%
Intel Core i7-9750H, NVIDIA GeForce RTX 2080 Mobile
i7-9750H, 2600 МГц
1.2 GB/s
Intel Core i5-9400F, NVIDIA Titan RTX
i5-9400F, 2900 МГц
0.86 GB/s -28%
Усредн. модель с Intel Core i5-9300H
  ()
0.84 GB/s -30%
Serpent Mean 100MB
Intel Core i9-10900K, NVIDIA Titan RTX
i9-10900K, 3700 МГц
1.5 GB/s +114%
Intel Core i9-9980HK, NVIDIA GeForce RTX 2070 (Desktop)
i9-9980HK, 2400 МГц
1 GB/s +43%
Усредн. модель с Intel Core i9-9980HK
  (1 - 1, n=2)
1 GB/s +43%
Intel Core i5-10600K, NVIDIA Titan RTX
i5-10600K, 4100 МГц
0.82 GB/s +17%
Усредн. модель с Intel Core i7-9750H
  (0.7 - 0.75, n=2)
0.725 GB/s +4%
Intel Core i7-9750H, NVIDIA GeForce RTX 2080 Mobile
i7-9750H, 2600 МГц
0.7 GB/s
Intel Core i5-9400F, NVIDIA Titan RTX
i5-9400F, 2900 МГц
0.51 GB/s -27%
Усредн. модель с Intel Core i5-9300H
  ()
0.5 GB/s -29%
Geekbench 5.5
Multi-Core
Intel Core i9-10900K, NVIDIA Titan RTX
i9-10900K, 3700 МГц
11414 Points +94%
Intel Core i9-9980HK, NVIDIA GeForce RTX 2070 (Desktop)
i9-9980HK, 2400 МГц
7568 Points +28%
Усредн. модель с Intel Core i9-9980HK
  (6945 - 7703, n=3)
7405 Points +26%
Intel Core i5-10600K, NVIDIA Titan RTX
i5-10600K, 4100 МГц
7248 Points +23%
Intel Core i7-9750H, NVIDIA GeForce RTX 2080 Mobile
i7-9750H, 2600 МГц
5894 Points
Intel Core i5-9400F, NVIDIA Titan RTX
i5-9400F, 2900 МГц
5715 Points -3%
Усредн. модель с Intel Core i7-9750H
  (4859 - 6262, n=13)
5597 Points -5%
Single-Core
Intel Core i9-10900K, NVIDIA Titan RTX
i9-10900K, 3700 МГц
1449 Points +18%
Intel Core i9-9980HK, NVIDIA GeForce RTX 2070 (Desktop)
i9-9980HK, 2400 МГц
1378 Points +12%
Усредн. модель с Intel Core i9-9980HK
  (1314 - 1378, n=2)
1346 Points +10%
Intel Core i5-10600K, NVIDIA Titan RTX
i5-10600K, 4100 МГц
1286 Points +5%
Intel Core i7-9750H, NVIDIA GeForce RTX 2080 Mobile
i7-9750H, 2600 МГц
1225 Points
Усредн. модель с Intel Core i7-9750H
  (1117 - 1251, n=13)
1190 Points -3%
Intel Core i5-9400F, NVIDIA Titan RTX
i5-9400F, 2900 МГц
1139 Points -7%
Geekbench 5.0
5.0 Multi-Core
Intel Core i9-10900K, NVIDIA Titan RTX
i9-10900K, 3700 МГц
11407 Points +94%
Intel Core i9-9980HK, NVIDIA GeForce RTX 2070 (Desktop)
i9-9980HK, 2400 МГц
7540 Points +28%
Усредн. модель с Intel Core i9-9980HK
  (7072 - 7805, n=4)
7421 Points +26%
Intel Core i5-10600K, NVIDIA Titan RTX
i5-10600K, 4100 МГц
7237 Points +23%
Intel Core i7-9750H, NVIDIA GeForce RTX 2080 Mobile
i7-9750H, 2600 МГц
5885 Points
Intel Core i5-9400F, NVIDIA Titan RTX
i5-9400F, 2900 МГц
5698 Points -3%
Усредн. модель с Intel Core i7-9750H
  (4812 - 6230, n=15)
5575 Points -5%
Усредн. модель с Intel Core i5-9300H
  (3697 - 4200, n=3)
4014 Points -32%
5.0 Single-Core
Intel Core i9-10900K, NVIDIA Titan RTX
i9-10900K, 3700 МГц
1440 Points +18%
Intel Core i9-9980HK, NVIDIA GeForce RTX 2070 (Desktop)
i9-9980HK, 2400 МГц
1355 Points +11%
Intel Core i5-10600K, NVIDIA Titan RTX
i5-10600K, 4100 МГц
1281 Points +5%
Усредн. модель с Intel Core i9-9980HK
  (1171 - 1355, n=4)
1273 Points +4%
Intel Core i7-9750H, NVIDIA GeForce RTX 2080 Mobile
i7-9750H, 2600 МГц
1219 Points
Усредн. модель с Intel Core i7-9750H
  (1105 - 1248, n=15)
1179 Points -3%
Intel Core i5-9400F, NVIDIA Titan RTX
i5-9400F, 2900 МГц
1132 Points -7%
Усредн. модель с Intel Core i5-9300H
  (1095 - 1137, n=3)
1118 Points -8%
Geekbench 4.4
64 Bit Single-Core Score
Intel Core i9-10900K, NVIDIA Titan RTX
i9-10900K, 3700 МГц
6348 Points +18%
Intel Core i9-9980HK, NVIDIA GeForce RTX 2070 (Desktop)
i9-9980HK, 2400 МГц
5969 Points +11%
Усредн. модель с Intel Core i9-9980HK
  (5617 - 5972, n=3)
5853 Points +8%
Intel Core i5-10600K, NVIDIA Titan RTX
i5-10600K, 4100 МГц
5821 Points +8%
Intel Core i7-9750H, NVIDIA GeForce RTX 2080 Mobile
i7-9750H, 2600 МГц
5401 Points
Intel Core i5-9400F, NVIDIA Titan RTX
i5-9400F, 2900 МГц
5347 Points -1%
Усредн. модель с Intel Core i7-9750H
  (4440 - 5511, n=27)
5238 Points -3%
Усредн. модель с Intel Core i5-9300H
  (4704 - 5089, n=7)
4898 Points -9%
64 Bit Multi-Core Score
Intel Core i9-10900K, NVIDIA Titan RTX
i9-10900K, 3700 МГц
43058 Points +87%
Усредн. модель с Intel Core i9-9980HK
  (28625 - 30849, n=3)
29620 Points +29%
Intel Core i9-9980HK, NVIDIA GeForce RTX 2070 (Desktop)
i9-9980HK, 2400 МГц
29385 Points +28%
Intel Core i5-10600K, NVIDIA Titan RTX
i5-10600K, 4100 МГц
28391 Points +23%
Intel Core i7-9750H, NVIDIA GeForce RTX 2080 Mobile
i7-9750H, 2600 МГц
23000 Points
Усредн. модель с Intel Core i7-9750H
  (17054 - 25043, n=27)
22076 Points -4%
Intel Core i5-9400F, NVIDIA Titan RTX
i5-9400F, 2900 МГц
21830 Points -5%
Усредн. модель с Intel Core i5-9300H
  (14853 - 17684, n=7)
16246 Points -29%
3DMark 11 - 1280x720 Performance Physics
Intel Core i9-10900K, NVIDIA Titan RTX
i9-10900K, 3700 МГц
22140 Points +71%
Intel Core i9-9980HK, NVIDIA GeForce RTX 2070 (Desktop)
i9-9980HK, 2400 МГц
16422 Points +27%
Intel Core i5-10600K, NVIDIA Titan RTX
i5-10600K, 4100 МГц
15961 Points +23%
Усредн. модель с Intel Core i9-9980HK
  (9056 - 18260, n=12)
15688 Points +21%
Intel Core i7-9750H, NVIDIA GeForce RTX 2080 Mobile
i7-9750H, 2600 МГц
12967 Points
Усредн. модель с Intel Core i7-9750H
  (9704 - 14337, n=80)
12766 Points -2%
Intel Core i5-9400F, NVIDIA Titan RTX
i5-9400F, 2900 МГц
11185 Points -14%
Усредн. модель с Intel Core i5-9300H
  (7499 - 10557, n=12)
8987 Points -31%
7-Zip 18.03
7z b 4
Intel Core i9-10900K, NVIDIA Titan RTX
i9-10900K, 3700 МГц
70968 MIPS +111%
Intel Core i9-9980HK, NVIDIA GeForce RTX 2070 (Desktop)
i9-9980HK, 2400 МГц
44081 MIPS +31%
Усредн. модель с Intel Core i9-9980HK
  (39566 - 44081, n=4)
41756 MIPS +24%
Intel Core i5-10600K, NVIDIA Titan RTX
i5-10600K, 4100 МГц
40379 MIPS +20%
Intel Core i7-9750H, NVIDIA GeForce RTX 2080 Mobile
i7-9750H, 2600 МГц
33556 MIPS
Усредн. модель с Intel Core i7-9750H
  (28512 - 35174, n=21)
32357 MIPS -4%
Intel Core i5-9400F, NVIDIA Titan RTX
i5-9400F, 2900 МГц
25639 MIPS -24%
Усредн. модель с Intel Core i5-9300H
  (20736 - 23155, n=3)
22008 MIPS -34%
7z b 4 -mmt1
Intel Core i9-10900K, NVIDIA Titan RTX
i9-10900K, 3700 МГц
5954 MIPS +17%
Intel Core i9-9980HK, NVIDIA GeForce RTX 2070 (Desktop)
i9-9980HK, 2400 МГц
5642 MIPS +11%
Усредн. модель с Intel Core i9-9980HK
  (5283 - 5642, n=4)
5426 MIPS +7%
Intel Core i5-10600K, NVIDIA Titan RTX
i5-10600K, 4100 МГц
5289 MIPS +4%
Intel Core i7-9750H, NVIDIA GeForce RTX 2080 Mobile
i7-9750H, 2600 МГц
5090 MIPS
Усредн. модель с Intel Core i7-9750H
  (4580 - 5090, n=21)
4846 MIPS -5%
Intel Core i5-9400F, NVIDIA Titan RTX
i5-9400F, 2900 МГц
4678 MIPS -8%
Усредн. модель с Intel Core i5-9300H
  (4542 - 4626, n=3)
4592 MIPS -10%
HWBOT x265 Benchmark v2.2 - 4k Preset
Intel Core i9-10900K, NVIDIA Titan RTX
i9-10900K, 3700 МГц
21 fps +134%
Intel Core i5-10600K, NVIDIA Titan RTX
i5-10600K, 4100 МГц
12.2 fps +36%
Усредн. модель с Intel Core i9-9980HK
  (10.8 - 12.4, n=3)
11.5 fps +28%
Intel Core i9-9980HK, NVIDIA GeForce RTX 2070 (Desktop)
i9-9980HK, 2400 МГц
11.4 fps +27%
Intel Core i5-9400F, NVIDIA Titan RTX
i5-9400F, 2900 МГц
9.07 fps +1%
Intel Core i7-9750H, NVIDIA GeForce RTX 2080 Mobile
i7-9750H, 2600 МГц
8.99 fps
Усредн. модель с Intel Core i7-9750H
  (7.1 - 10.7, n=21)
8.72 fps -3%
Усредн. модель с Intel Core i5-9300H
  (5.7 - 6.5, n=3)
6.07 fps -32%
R Benchmark 2.5 - Overall mean
Intel Core i5-9400F, NVIDIA Titan RTX
i5-9400F, 2900 МГц
0.667 sec * -10%
Усредн. модель с Intel Core i7-9750H
  (0.608 - 0.695, n=14)
0.643 sec * -6%
Intel Core i7-9750H, NVIDIA GeForce RTX 2080 Mobile
i7-9750H, 2600 МГц
0.608 sec *
Intel Core i5-10600K, NVIDIA Titan RTX
i5-10600K, 4100 МГц
0.593 sec * +2%
Intel Core i9-9980HK, NVIDIA GeForce RTX 2070 (Desktop)
i9-9980HK, 2400 МГц
0.541 sec * +11%
Усредн. модель с Intel Core i9-9980HK
  ()
0.541 sec * +11%
Intel Core i9-10900K, NVIDIA Titan RTX
i9-10900K, 3700 МГц
0.528 sec * +13%
LibreOffice - 20 Documents To PDF
Intel Core i9-10900K, NVIDIA Titan RTX
i9-10900K, 3700 МГц
76 s * -31%
Усредн. модель с Intel Core i7-9750H
  (54.5 - 64.7, n=9)
59 s * -2%
Intel Core i5-9400F, NVIDIA Titan RTX
i5-9400F, 2900 МГц
58.9 s * -2%
Intel Core i7-9750H, NVIDIA GeForce RTX 2080 Mobile
i7-9750H, 2600 МГц
57.8 s *
Усредн. модель с Intel Core i9-9980HK
  (45.2 - 57.5, n=2)
51.4 s * +11%
Intel Core i5-10600K, NVIDIA Titan RTX
i5-10600K, 4100 МГц
46.06 s * +20%
Intel Core i9-9980HK, NVIDIA GeForce RTX 2070 (Desktop)
i9-9980HK, 2400 МГц
45.23 s * +22%
WebXPRT 3 - Overall
Intel Core i9-10900K, NVIDIA Titan RTX
i9-10900K, 3700 МГц
255 Points +20%
Intel Core i5-10600K, NVIDIA Titan RTX
i5-10600K, 4100 МГц
239 Points +12%
Intel Core i9-9980HK, NVIDIA GeForce RTX 2070 (Desktop)
i9-9980HK, 2400 МГц
233 Points +9%
Усредн. модель с Intel Core i9-9980HK
  ()
233 Points +9%
Усредн. модель с Intel Core i5-9300H
  ()
222 Points +4%
Intel Core i7-9750H, NVIDIA GeForce RTX 2080 Mobile
i7-9750H, 2600 МГц
213 Points
Intel Core i5-9400F, NVIDIA Titan RTX
i5-9400F, 2900 МГц
211 Points -1%
Усредн. модель с Intel Core i7-9750H
  (199 - 231, n=10)
211 Points -1%
Mozilla Kraken 1.1 - Total
Усредн. модель с Intel Core i5-9300H
  (1079 - 1349, n=8)
1138 ms * -35%
Усредн. модель с Intel Core i7-9750H
  (845 - 1713, n=54)
1048 ms * -24%
Усредн. модель с Intel Core i9-9980HK
  (705 - 999, n=9)
878 ms * -4%
Intel Core i5-9400F, NVIDIA Titan RTX
i5-9400F, 2900 МГц
867 ms * -3%
Intel Core i7-9750H, NVIDIA GeForce RTX 2080 Mobile
i7-9750H, 2600 МГц
845 ms *
Intel Core i5-10600K, NVIDIA Titan RTX
i5-10600K, 4100 МГц
760 ms * +10%
Intel Core i9-9980HK, NVIDIA GeForce RTX 2070 (Desktop)
i9-9980HK, 2400 МГц
754 ms * +11%
Intel Core i9-10900K, NVIDIA Titan RTX
i9-10900K, 3700 МГц
709 ms * +16%
3DMark
3840x2160 Fire Strike Ultra Physics
Intel Core i9-10900K, NVIDIA Titan RTX
i9-10900K, 3700 МГц
29374 Points +67%
Intel Core i9-9980HK, NVIDIA GeForce RTX 2070 (Desktop)
i9-9980HK, 2400 МГц
21864 Points +24%
Усредн. модель с Intel Core i9-9980HK
  (19832 - 22568, n=8)
21323 Points +21%
Intel Core i5-10600K, NVIDIA Titan RTX
i5-10600K, 4100 МГц
19942 Points +13%
Intel Core i7-9750H, NVIDIA GeForce RTX 2080 Mobile
i7-9750H, 2600 МГц
17597 Points
Усредн. модель с Intel Core i7-9750H
  (12628 - 17820, n=51)
16437 Points -7%
Intel Core i5-9400F, NVIDIA Titan RTX
i5-9400F, 2900 МГц
12651 Points -28%
Усредн. модель с Intel Core i5-9300H
  (9749 - 12343, n=6)
11357 Points -35%
1920x1080 Fire Strike Physics
Intel Core i9-10900K, NVIDIA Titan RTX
i9-10900K, 3700 МГц
29805 Points +71%
Intel Core i9-9980HK, NVIDIA GeForce RTX 2070 (Desktop)
i9-9980HK, 2400 МГц
21706 Points +25%
Intel Core i5-10600K, NVIDIA Titan RTX
i5-10600K, 4100 МГц
20040 Points +15%
Усредн. модель с Intel Core i9-9980HK
  (11758 - 22463, n=11)
19893 Points +14%
Intel Core i7-9750H, NVIDIA GeForce RTX 2080 Mobile
i7-9750H, 2600 МГц
17416 Points
Усредн. модель с Intel Core i7-9750H
  (12438 - 17788, n=76)
16332 Points -6%
Intel Core i5-9400F, NVIDIA Titan RTX
i5-9400F, 2900 МГц
12616 Points -28%
Усредн. модель с Intel Core i5-9300H
  (9387 - 12349, n=12)
11376 Points -35%
2560x1440 Time Spy CPU
Intel Core i9-10900K, NVIDIA Titan RTX
i9-10900K, 3700 МГц
14326 Points +132%
Intel Core i9-9980HK, NVIDIA GeForce RTX 2070 (Desktop)
i9-9980HK, 2400 МГц
9417 Points +53%
Усредн. модель с Intel Core i9-9980HK
  (5540 - 10162, n=12)
8487 Points +38%
Intel Core i5-10600K, NVIDIA Titan RTX
i5-10600K, 4100 МГц
8290 Points +34%
Усредн. модель с Intel Core i7-9750H
  (4620 - 7171, n=70)
6334 Points +3%
Intel Core i7-9750H, NVIDIA GeForce RTX 2080 Mobile
i7-9750H, 2600 МГц
6167 Points
Intel Core i5-9400F, NVIDIA Titan RTX
i5-9400F, 2900 МГц
5777 Points -6%
Усредн. модель с Intel Core i5-9300H
  (3165 - 4861, n=10)
4074 Points -34%

* ... меньше = лучше

Испытание зацикленным многопоточным CB R15

Мысль о качественно организованном, особенно если вспомнить о компактности корпуса, питании и охлаждении подтвердилась. Cinebench R15, запущенный в бесконечном повторении [не менее тридцати раз], от прогона к прогону даёт почти одинаковый результат.

10801130118012301280133013801430148015301580Tooltip
Zotac ZBOX Magnus EN72070V Intel Core i7-9750H, Intel Core i7-9750H: Ø1107 (1097.27-1166.52)
Intel Ghost Canyon NUC (RTX 2070) Intel Core i9-9980HK, Intel Core i9-9980HK: Ø1463 (1410.79-1593.44)

Общесистемная производительность

Тесты семейства PCMark пройдены без неожиданностей и с хорошими итогами. Оценки 72080V не так высоки, как у полноразмерных игровых компьютеров и полноразмерных компонентов, но в реальном повседневном использовании он будеь примерно настолько же отзывчив, как они. Некоторую слабость можно видеть при анализе результатов местной GeForce RTX 2080 в издании для ноутбука, но, надо заметить, GeForce RTX 2070 внутри Ghost Canyon NUC работает не лучше.

PCMark 10 - Score
AMD Ryzen 9 3950X, AMD Ryzen 9 3950X
NVIDIA Titan RTX
7869 Points +28%
Intel Core i9-10900K, Intel Core i9-10900K
NVIDIA Titan RTX
7641 Points +24%
Corsair One i160, Intel Core i9-9900K
NVIDIA GeForce RTX 2080 Ti (Desktop)
7329 Points +19%
Intel Core i5-10600K, Intel Core i5-10600K
NVIDIA Titan RTX
7279 Points +18%
Intel Ghost Canyon NUC (RTX 2070), Intel Core i9-9980HK
NVIDIA GeForce RTX 2070 (Desktop)
6939 Points +13%
Zotac ZBOX Magnus EN72070V, Intel Core i7-9750H
NVIDIA GeForce RTX 2080 Mobile
6159 Points
Усредн. модель с Intel Core i7-9750H
  (4395 - 6453, n=72)
5533 Points -10%
PCMark 8
Work Score Accelerated v2
Усредн. модель с Intel Core i7-9750H
  (4241 - 6593, n=57)
5461 Points +11%
AMD Ryzen 9 3950X, AMD Ryzen 9 3950X
NVIDIA Titan RTX
5388 Points +9%
Corsair One i160, Intel Core i9-9900K
NVIDIA GeForce RTX 2080 Ti (Desktop)
5296 Points +7%
Intel Core i5-10600K, Intel Core i5-10600K
NVIDIA Titan RTX
5148 Points +4%
Intel Core i9-10900K, Intel Core i9-10900K
NVIDIA Titan RTX
5115 Points +4%
Intel Ghost Canyon NUC (RTX 2070), Intel Core i9-9980HK
NVIDIA GeForce RTX 2070 (Desktop)
5066 Points +3%
Zotac ZBOX Magnus EN72070V, Intel Core i7-9750H
NVIDIA GeForce RTX 2080 Mobile
4927 Points
Creative Score Accelerated v2
Corsair One i160, Intel Core i9-9900K
NVIDIA GeForce RTX 2080 Ti (Desktop)
10550 Points +21%
AMD Ryzen 9 3950X, AMD Ryzen 9 3950X
NVIDIA Titan RTX
10402 Points +19%
Intel Core i5-10600K, Intel Core i5-10600K
NVIDIA Titan RTX
10349 Points +19%
Intel Core i9-10900K, Intel Core i9-10900K
NVIDIA Titan RTX
10245 Points +17%
Intel Ghost Canyon NUC (RTX 2070), Intel Core i9-9980HK
NVIDIA GeForce RTX 2070 (Desktop)
8969 Points +3%
Zotac ZBOX Magnus EN72070V, Intel Core i7-9750H
NVIDIA GeForce RTX 2080 Mobile
8733 Points
Усредн. модель с Intel Core i7-9750H
  (3753 - 8733, n=22)
6192 Points -29%
Home Score Accelerated v2
Corsair One i160, Intel Core i9-9900K
NVIDIA GeForce RTX 2080 Ti (Desktop)
5418 Points +8%
AMD Ryzen 9 3950X, AMD Ryzen 9 3950X
NVIDIA Titan RTX
5404 Points +8%
Intel Ghost Canyon NUC (RTX 2070), Intel Core i9-9980HK
NVIDIA GeForce RTX 2070 (Desktop)
5247 Points +5%
Intel Core i5-10600K, Intel Core i5-10600K
NVIDIA Titan RTX
5212 Points +4%
Intel Core i9-10900K, Intel Core i9-10900K
NVIDIA Titan RTX
5185 Points +4%
Zotac ZBOX Magnus EN72070V, Intel Core i7-9750H
NVIDIA GeForce RTX 2080 Mobile
5009 Points
Усредн. модель с Intel Core i7-9750H
  (3417 - 5661, n=56)
4424 Points -12%
SPECviewperf 12
1900x1060 Solidworks (sw-03)
Intel Core i9-10900K, Intel Core i9-10900K
NVIDIA Titan RTX
172.2 fps +163%
Intel Core i5-10600K, Intel Core i5-10600K
NVIDIA Titan RTX
158.2 fps +142%
AMD Ryzen 9 3950X, AMD Ryzen 9 3950X
NVIDIA Titan RTX
157.6 fps +141%
Усредн. модель с Intel Core i7-9750H
  (44.7 - 149.1, n=15)
95.8 fps +46%
Corsair One i160, Intel Core i9-9900K
NVIDIA GeForce RTX 2080 Ti (Desktop)
83.7 fps +28%
Zotac ZBOX Magnus EN72070V, Intel Core i7-9750H
NVIDIA GeForce RTX 2080 Mobile
65.5 fps
Intel Ghost Canyon NUC (RTX 2070), Intel Core i9-9980HK
NVIDIA GeForce RTX 2070 (Desktop)
59.2 fps -10%
1900x1060 Siemens NX (snx-02)
Intel Core i9-10900K, Intel Core i9-10900K
NVIDIA Titan RTX
263.3 fps +2137%
Intel Core i5-10600K, Intel Core i5-10600K
NVIDIA Titan RTX
259.1 fps +2101%
AMD Ryzen 9 3950X, AMD Ryzen 9 3950X
NVIDIA Titan RTX
254.8 fps +2065%
Усредн. модель с Intel Core i7-9750H
  (7.7 - 186, n=15)
87.5 fps +643%
Corsair One i160, Intel Core i9-9900K
NVIDIA GeForce RTX 2080 Ti (Desktop)
12.72 fps +8%
Zotac ZBOX Magnus EN72070V, Intel Core i7-9750H
NVIDIA GeForce RTX 2080 Mobile
11.77 fps
Intel Ghost Canyon NUC (RTX 2070), Intel Core i9-9980HK
NVIDIA GeForce RTX 2070 (Desktop)
9.08 fps -23%
1900x1060 Showcase (showcase-01)
Intel Core i5-10600K, Intel Core i5-10600K
NVIDIA Titan RTX
196.1 fps +60%
Intel Core i9-10900K, Intel Core i9-10900K
NVIDIA Titan RTX
192.4 fps +57%
AMD Ryzen 9 3950X, AMD Ryzen 9 3950X
NVIDIA Titan RTX
188.3 fps +54%
Corsair One i160, Intel Core i9-9900K
NVIDIA GeForce RTX 2080 Ti (Desktop)
182.3 fps +49%
Zotac ZBOX Magnus EN72070V, Intel Core i7-9750H
NVIDIA GeForce RTX 2080 Mobile
122.4 fps
Intel Ghost Canyon NUC (RTX 2070), Intel Core i9-9980HK
NVIDIA GeForce RTX 2070 (Desktop)
118.5 fps -3%
Усредн. модель с Intel Core i7-9750H
  (25.2 - 122.4, n=15)
79.3 fps -35%
1900x1060 Medical (medical-01)
Intel Core i5-10600K, Intel Core i5-10600K
NVIDIA Titan RTX
94.6 fps +151%
Intel Core i9-10900K, Intel Core i9-10900K
NVIDIA Titan RTX
94.5 fps +151%
AMD Ryzen 9 3950X, AMD Ryzen 9 3950X
NVIDIA Titan RTX
88.1 fps +134%
Corsair One i160, Intel Core i9-9900K
NVIDIA GeForce RTX 2080 Ti (Desktop)
56.6 fps +50%
Усредн. модель с Intel Core i7-9750H
  (14.7 - 65, n=12)
44.9 fps +19%
Intel Ghost Canyon NUC (RTX 2070), Intel Core i9-9980HK
NVIDIA GeForce RTX 2070 (Desktop)
40.14 fps +6%
Zotac ZBOX Magnus EN72070V, Intel Core i7-9750H
NVIDIA GeForce RTX 2080 Mobile
37.71 fps
1900x1060 Maya (maya-04)
Corsair One i160, Intel Core i9-9900K
NVIDIA GeForce RTX 2080 Ti (Desktop)
190.9 fps +19%
Intel Core i9-10900K, Intel Core i9-10900K
NVIDIA Titan RTX
188.7 fps +17%
AMD Ryzen 9 3950X, AMD Ryzen 9 3950X
NVIDIA Titan RTX
172.2 fps +7%
Intel Ghost Canyon NUC (RTX 2070), Intel Core i9-9980HK
NVIDIA GeForce RTX 2070 (Desktop)
171 fps +6%
Intel Core i5-10600K, Intel Core i5-10600K
NVIDIA Titan RTX
169.4 fps +5%
Zotac ZBOX Magnus EN72070V, Intel Core i7-9750H
NVIDIA GeForce RTX 2080 Mobile
160.6 fps
Усредн. модель с Intel Core i7-9750H
  (40.7 - 160.6, n=15)
88.7 fps -45%
1900x1060 Energy (energy-01)
Intel Core i5-10600K, Intel Core i5-10600K
NVIDIA Titan RTX
28.77 fps +148%
Intel Core i9-10900K, Intel Core i9-10900K
NVIDIA Titan RTX
28.72 fps +147%
AMD Ryzen 9 3950X, AMD Ryzen 9 3950X
NVIDIA Titan RTX
28.18 fps +143%
Corsair One i160, Intel Core i9-9900K
NVIDIA GeForce RTX 2080 Ti (Desktop)
16.72 fps +44%
Zotac ZBOX Magnus EN72070V, Intel Core i7-9750H
NVIDIA GeForce RTX 2080 Mobile
11.61 fps
Intel Ghost Canyon NUC (RTX 2070), Intel Core i9-9980HK
NVIDIA GeForce RTX 2070 (Desktop)
11.49 fps -1%
Усредн. модель с Intel Core i7-9750H
  (3.93 - 16.1, n=12)
10.9 fps -6%
1900x1060 Creo (creo-01)
Intel Core i9-10900K, Intel Core i9-10900K
NVIDIA Titan RTX
157.2 fps +173%
Intel Core i5-10600K, Intel Core i5-10600K
NVIDIA Titan RTX
142.7 fps +148%
AMD Ryzen 9 3950X, AMD Ryzen 9 3950X
NVIDIA Titan RTX
134.8 fps +134%
Усредн. модель с Intel Core i7-9750H
  (38.4 - 140.7, n=15)
90.2 fps +57%
Corsair One i160, Intel Core i9-9900K
NVIDIA GeForce RTX 2080 Ti (Desktop)
72.2 fps +26%
Zotac ZBOX Magnus EN72070V, Intel Core i7-9750H
NVIDIA GeForce RTX 2080 Mobile
57.5 fps
Intel Ghost Canyon NUC (RTX 2070), Intel Core i9-9980HK
NVIDIA GeForce RTX 2070 (Desktop)
52.2 fps -9%
1900x1060 Catia (catia-04)
Intel Core i9-10900K, Intel Core i9-10900K
NVIDIA Titan RTX
225.2 fps +126%
AMD Ryzen 9 3950X, AMD Ryzen 9 3950X
NVIDIA Titan RTX
218.4 fps +119%
Intel Core i5-10600K, Intel Core i5-10600K
NVIDIA Titan RTX
215.5 fps +116%
Corsair One i160, Intel Core i9-9900K
NVIDIA GeForce RTX 2080 Ti (Desktop)
120.8 fps +21%
Усредн. модель с Intel Core i7-9750H
  (54.2 - 161.9, n=15)
100.6 fps +1%
Zotac ZBOX Magnus EN72070V, Intel Core i7-9750H
NVIDIA GeForce RTX 2080 Mobile
99.8 fps
Intel Ghost Canyon NUC (RTX 2070), Intel Core i9-9980HK
NVIDIA GeForce RTX 2070 (Desktop)
78.3 fps -22%
1900x1060 3ds Max (3dsmax-05)
Intel Core i9-10900K, Intel Core i9-10900K
NVIDIA Titan RTX
297.4 fps +44%
Intel Core i5-10600K, Intel Core i5-10600K
NVIDIA Titan RTX
296.9 fps +43%
AMD Ryzen 9 3950X, AMD Ryzen 9 3950X
NVIDIA Titan RTX
274.5 fps +32%
Corsair One i160, Intel Core i9-9900K
NVIDIA GeForce RTX 2080 Ti (Desktop)
271.8 fps +31%
Zotac ZBOX Magnus EN72070V, Intel Core i7-9750H
NVIDIA GeForce RTX 2080 Mobile
207.2 fps
Intel Ghost Canyon NUC (RTX 2070), Intel Core i9-9980HK
NVIDIA GeForce RTX 2070 (Desktop)
180.8 fps -13%
Усредн. модель с Intel Core i7-9750H
  (57.5 - 207, n=11)
156 fps -25%
SPECviewperf 13
Solidworks (sw-04)
Intel Core i9-10900K, Intel Core i9-10900K
NVIDIA Titan RTX
166.2 fps +77%
Intel Core i5-10600K, Intel Core i5-10600K
NVIDIA Titan RTX
153.9 fps +64%
AMD Ryzen 9 3950X, AMD Ryzen 9 3950X
NVIDIA Titan RTX
153.2 fps +63%
Corsair One i160, Intel Core i9-9900K
NVIDIA GeForce RTX 2080 Ti (Desktop)
116.3 fps +24%
Усредн. модель с Intel Core i7-9750H
  (64.8 - 125.4, n=15)
101.2 fps +8%
Zotac ZBOX Magnus EN72070V, Intel Core i7-9750H
NVIDIA GeForce RTX 2080 Mobile
93.9 fps
Intel Ghost Canyon NUC (RTX 2070), Intel Core i9-9980HK
NVIDIA GeForce RTX 2070 (Desktop)
85.4 fps -9%
Siemens NX (snx-03)
Intel Core i9-10900K, Intel Core i9-10900K
NVIDIA Titan RTX
472.9 fps +2135%
Intel Core i5-10600K, Intel Core i5-10600K
NVIDIA Titan RTX
469.1 fps +2117%
AMD Ryzen 9 3950X, AMD Ryzen 9 3950X
NVIDIA Titan RTX
460 fps +2074%
Усредн. модель с Intel Core i7-9750H
  (13.9 - 306, n=15)
158.8 fps +650%
Corsair One i160, Intel Core i9-9900K
NVIDIA GeForce RTX 2080 Ti (Desktop)
23.03 fps +9%
Zotac ZBOX Magnus EN72070V, Intel Core i7-9750H
NVIDIA GeForce RTX 2080 Mobile
21.16 fps
Intel Ghost Canyon NUC (RTX 2070), Intel Core i9-9980HK
NVIDIA GeForce RTX 2070 (Desktop)
16.33 fps -23%
Showcase (showcase-02)
Intel Core i5-10600K, Intel Core i5-10600K
NVIDIA Titan RTX
195.1 fps +60%
Intel Core i9-10900K, Intel Core i9-10900K
NVIDIA Titan RTX
194.1 fps +60%
AMD Ryzen 9 3950X, AMD Ryzen 9 3950X
NVIDIA Titan RTX
186.8 fps +54%
Corsair One i160, Intel Core i9-9900K
NVIDIA GeForce RTX 2080 Ti (Desktop)
182.6 fps +50%
Zotac ZBOX Magnus EN72070V, Intel Core i7-9750H
NVIDIA GeForce RTX 2080 Mobile
121.6 fps
Intel Ghost Canyon NUC (RTX 2070), Intel Core i9-9980HK
NVIDIA GeForce RTX 2070 (Desktop)
118.5 fps -3%
Усредн. модель с Intel Core i7-9750H
  (25.2 - 121.6, n=15)
77.4 fps -36%
Medical (medical-02)
AMD Ryzen 9 3950X, AMD Ryzen 9 3950X
NVIDIA Titan RTX
90.3 fps +46%
Intel Core i5-10600K, Intel Core i5-10600K
NVIDIA Titan RTX
89.7 fps +45%
Intel Core i9-10900K, Intel Core i9-10900K
NVIDIA Titan RTX
88.7 fps +44%
Corsair One i160, Intel Core i9-9900K
NVIDIA GeForce RTX 2080 Ti (Desktop)
85 fps +38%
Zotac ZBOX Magnus EN72070V, Intel Core i7-9750H
NVIDIA GeForce RTX 2080 Mobile
61.8 fps
Усредн. модель с Intel Core i7-9750H
  (13.1 - 88.9, n=12)
58.5 fps -5%
Intel Ghost Canyon NUC (RTX 2070), Intel Core i9-9980HK
NVIDIA GeForce RTX 2070 (Desktop)
56.4 fps -9%
Maya (maya-05)
Intel Core i9-10900K, Intel Core i9-10900K
NVIDIA Titan RTX
405.9 fps +38%
Corsair One i160, Intel Core i9-9900K
NVIDIA GeForce RTX 2080 Ti (Desktop)
402 fps +36%
AMD Ryzen 9 3950X, AMD Ryzen 9 3950X
NVIDIA Titan RTX
394.9 fps +34%
Intel Core i5-10600K, Intel Core i5-10600K
NVIDIA Titan RTX
387.5 fps +31%
Zotac ZBOX Magnus EN72070V, Intel Core i7-9750H
NVIDIA GeForce RTX 2080 Mobile
294.9 fps
Intel Ghost Canyon NUC (RTX 2070), Intel Core i9-9980HK
NVIDIA GeForce RTX 2070 (Desktop)
281 fps -5%
Усредн. модель с Intel Core i7-9750H
  (68.8 - 295, n=15)
173.8 fps -41%
Energy (energy-02)
Intel Core i5-10600K, Intel Core i5-10600K
NVIDIA Titan RTX
53.3 fps +146%
Intel Core i9-10900K, Intel Core i9-10900K
NVIDIA Titan RTX
53.2 fps +145%
AMD Ryzen 9 3950X, AMD Ryzen 9 3950X
NVIDIA Titan RTX
52.4 fps +141%
Corsair One i160, Intel Core i9-9900K
NVIDIA GeForce RTX 2080 Ti (Desktop)
31.93 fps +47%
Усредн. модель с Intel Core i7-9750H
  (7.29 - 38, n=12)
24.1 fps +11%
Intel Ghost Canyon NUC (RTX 2070), Intel Core i9-9980HK
NVIDIA GeForce RTX 2070 (Desktop)
21.83 fps +1%
Zotac ZBOX Magnus EN72070V, Intel Core i7-9750H
NVIDIA GeForce RTX 2080 Mobile
21.71 fps
Creo (creo-02)
Intel Core i9-10900K, Intel Core i9-10900K
NVIDIA Titan RTX
336.3 fps +65%
Intel Core i5-10600K, Intel Core i5-10600K
NVIDIA Titan RTX
331.7 fps +62%
AMD Ryzen 9 3950X, AMD Ryzen 9 3950X
NVIDIA Titan RTX
328.8 fps +61%
Corsair One i160, Intel Core i9-9900K
NVIDIA GeForce RTX 2080 Ti (Desktop)
286.1 fps +40%
Zotac ZBOX Magnus EN72070V, Intel Core i7-9750H
NVIDIA GeForce RTX 2080 Mobile
204.3 fps
Intel Ghost Canyon NUC (RTX 2070), Intel Core i9-9980HK
NVIDIA GeForce RTX 2070 (Desktop)
183.8 fps -10%
Усредн. модель с Intel Core i7-9750H
  (67.7 - 218, n=15)
160.3 fps -22%
Catia (catia-05)
Intel Core i9-10900K, Intel Core i9-10900K
NVIDIA Titan RTX
362.1 fps +148%
AMD Ryzen 9 3950X, AMD Ryzen 9 3950X
NVIDIA Titan RTX
355.2 fps +143%
Intel Core i5-10600K, Intel Core i5-10600K
NVIDIA Titan RTX
341.7 fps +134%
Corsair One i160, Intel Core i9-9900K
NVIDIA GeForce RTX 2080 Ti (Desktop)
177.3 fps +21%
Усредн. модель с Intel Core i7-9750H
  (77.1 - 215, n=15)
154.8 fps +6%
Zotac ZBOX Magnus EN72070V, Intel Core i7-9750H
NVIDIA GeForce RTX 2080 Mobile
146.1 fps
Intel Ghost Canyon NUC (RTX 2070), Intel Core i9-9980HK
NVIDIA GeForce RTX 2070 (Desktop)
113.7 fps -22%
3ds Max (3dsmax-06)
Intel Core i5-10600K, Intel Core i5-10600K
NVIDIA Titan RTX
294.4 fps +45%
Intel Core i9-10900K, Intel Core i9-10900K
NVIDIA Titan RTX
292.5 fps +44%
AMD Ryzen 9 3950X, AMD Ryzen 9 3950X
NVIDIA Titan RTX
274.5 fps +35%
Corsair One i160, Intel Core i9-9900K
NVIDIA GeForce RTX 2080 Ti (Desktop)
265.9 fps +31%
Zotac ZBOX Magnus EN72070V, Intel Core i7-9750H
NVIDIA GeForce RTX 2080 Mobile
203 fps
Intel Ghost Canyon NUC (RTX 2070), Intel Core i9-9980HK
NVIDIA GeForce RTX 2070 (Desktop)
178.6 fps -12%
Усредн. модель с Intel Core i7-9750H
  (56.7 - 203, n=15)
145.1 fps -29%

Графика

Основным видеопроцессором в исследуемом компьютере выступает GeForce RTX 2080. Эта видеокарта имеет некоторый запас мощи на будущее, но при прямом сравнении с полноразмерными видеокартами для настольного компьютера оказывается ближе к RTX 2070, чем к RTX 2080. Такой производительности в 2020 году хватает для любых игр в разрешении 1080p и максимальном качестве, а также для почти всех игр в 1440p и таком же максимальном качестве. Трудности начинаются при переключении в 2160p, здесь придётся снижать качество игровых эффектов. Всё то же самое можно сказать и про Nvidia GeForce RTX 2070, наиболее мощную видеокарту из совместимых с Intel Ghost Canyon NUC.

Borderlands 3
1280x720 Very Low Overall Quality (DX11)
Intel Ghost Canyon NUC (RTX 2070)
GeForce RTX 2070 (Desktop), i9-9980HK, Kingston KC2500 1 TB SKC2500M81000G
152 fps +19%
Усредн. модель с NVIDIA GeForce RTX 2080 Mobile
  (128 - 150, n=2)
139 fps +9%
Zotac ZBOX Magnus EN72070V
GeForce RTX 2080 Mobile, i7-9750H
128 fps
1920x1080 Badass Overall Quality (DX11)
Zotac ZBOX Magnus EN72070V
GeForce RTX 2080 Mobile, i7-9750H
84.3 fps
Усредн. модель с NVIDIA GeForce RTX 2080 Mobile
  (79.4 - 89.4, n=4)
83.8 fps -1%
Intel Ghost Canyon NUC (RTX 2070)
GeForce RTX 2070 (Desktop), i9-9980HK, Kingston KC2500 1 TB SKC2500M81000G
70.9 fps -16%
Metro Exodus
1280x720 Low Quality AF:4x
Intel Ghost Canyon NUC (RTX 2070)
GeForce RTX 2070 (Desktop), i9-9980HK, Kingston KC2500 1 TB SKC2500M81000G
181 (100.48min - 268.67max) fps +21%
Усредн. модель с NVIDIA GeForce RTX 2080 Mobile
  (149 - 165, n=2)
157 fps +5%
Zotac ZBOX Magnus EN72070V
GeForce RTX 2080 Mobile, i7-9750H
149 (77.18min - 225.38max) fps
1920x1080 Ultra Quality AF:16x
Усредн. модель с NVIDIA GeForce RTX 2080 Mobile
  (67.7 - 77.4, n=5)
71.8 fps +3%
Zotac ZBOX Magnus EN72070V
GeForce RTX 2080 Mobile, i7-9750H
69.5 (33.32min - 121.08max) fps
Intel Ghost Canyon NUC (RTX 2070)
GeForce RTX 2070 (Desktop), i9-9980HK, Kingston KC2500 1 TB SKC2500M81000G
60.9 (33.61min - 92.62max) fps -12%
Far Cry New Dawn
1280x720 Low Preset
Intel Ghost Canyon NUC (RTX 2070)
GeForce RTX 2070 (Desktop), i9-9980HK, Kingston KC2500 1 TB SKC2500M81000G
128 (92min - 190max) fps +9%
Zotac ZBOX Magnus EN72070V
GeForce RTX 2080 Mobile, i7-9750H
117 (83min - 171max) fps
Усредн. модель с NVIDIA GeForce RTX 2080 Mobile
  (109 - 117, n=2)
113 fps -3%
1920x1080 Ultra Preset
Усредн. модель с NVIDIA GeForce RTX 2080 Mobile
  (82 - 108, n=5)
93 fps +6%
Zotac ZBOX Magnus EN72070V
GeForce RTX 2080 Mobile, i7-9750H
88 (63min - 134max) fps
Intel Ghost Canyon NUC (RTX 2070)
GeForce RTX 2070 (Desktop), i9-9980HK, Kingston KC2500 1 TB SKC2500M81000G
79 (61min - 99max) fps -10%
Forza Horizon 4
1280x720 Very Low Preset
Intel Ghost Canyon NUC (RTX 2070)
GeForce RTX 2070 (Desktop), i9-9980HK, Kingston KC2500 1 TB SKC2500M81000G
198 fps +17%
Zotac ZBOX Magnus EN72070V
GeForce RTX 2080 Mobile, i7-9750H
169 fps
Усредн. модель с NVIDIA GeForce RTX 2080 Mobile
  ()
169 fps 0%
1920x1080 Ultra Preset AA:2xMS
Zotac ZBOX Magnus EN72070V
GeForce RTX 2080 Mobile, i7-9750H
139 fps
Усредн. модель с NVIDIA GeForce RTX 2080 Mobile
  ()
139 fps 0%
Intel Ghost Canyon NUC (RTX 2070)
GeForce RTX 2070 (Desktop), i9-9980HK, Kingston KC2500 1 TB SKC2500M81000G
106 fps -24%
Far Cry 5
1280x720 Low Preset AA:T
Intel Ghost Canyon NUC (RTX 2070)
GeForce RTX 2070 (Desktop), i9-9980HK, Kingston KC2500 1 TB SKC2500M81000G
147 (119min - 193max) fps +20%
Zotac ZBOX Magnus EN72070V
GeForce RTX 2080 Mobile, i7-9750H
123 (94min - 156max) fps
Усредн. модель с NVIDIA GeForce RTX 2080 Mobile
  (123 - 123, n=2)
123 fps 0%
1920x1080 Ultra Preset AA:T
Усредн. модель с NVIDIA GeForce RTX 2080 Mobile
  (73 - 115, n=3)
94.7 fps +30%
Intel Ghost Canyon NUC (RTX 2070)
GeForce RTX 2070 (Desktop), i9-9980HK, Kingston KC2500 1 TB SKC2500M81000G
86 (68min - 111max) fps +18%
Zotac ZBOX Magnus EN72070V
GeForce RTX 2080 Mobile, i7-9750H
73 (59min - 94max) fps
X-Plane 11.11
1280x720 low (fps_test=1)
Intel Ghost Canyon NUC (RTX 2070)
GeForce RTX 2070 (Desktop), i9-9980HK, Kingston KC2500 1 TB SKC2500M81000G
127 fps +11%
Zotac ZBOX Magnus EN72070V
GeForce RTX 2080 Mobile, i7-9750H
114 fps
Усредн. модель с NVIDIA GeForce RTX 2080 Mobile
  (98.2 - 114, n=3)
104.7 fps -8%
1920x1080 high (fps_test=3)
Intel Ghost Canyon NUC (RTX 2070)
GeForce RTX 2070 (Desktop), i9-9980HK, Kingston KC2500 1 TB SKC2500M81000G
92.7 fps +9%
Zotac ZBOX Magnus EN72070V
GeForce RTX 2080 Mobile, i7-9750H
84.7 fps
Усредн. модель с NVIDIA GeForce RTX 2080 Mobile
  (73.1 - 84.7, n=3)
77.6 fps -8%
Final Fantasy XV Benchmark
1280x720 Lite Quality
Intel Ghost Canyon NUC (RTX 2070)
GeForce RTX 2070 (Desktop), i9-9980HK, Kingston KC2500 1 TB SKC2500M81000G
193 (94min - 237max) fps +29%
Zotac ZBOX Magnus EN72070V
GeForce RTX 2080 Mobile, i7-9750H
150 fps
Усредн. модель с NVIDIA GeForce RTX 2080 Mobile
  ()
150 fps 0%
1920x1080 High Quality
Усредн. модель с NVIDIA GeForce RTX 2080 Mobile
  (90.6 - 108, n=3)
99.2 fps +9%
Intel Ghost Canyon NUC (RTX 2070)
GeForce RTX 2070 (Desktop), i9-9980HK, Kingston KC2500 1 TB SKC2500M81000G
90.6 (56min - 138max) fps 0%
Zotac ZBOX Magnus EN72070V
GeForce RTX 2080 Mobile, i7-9750H
90.6 fps
Dota 2 Reborn
1280x720 min (0/3) fastest
Intel Ghost Canyon NUC (RTX 2070)
GeForce RTX 2070 (Desktop), i9-9980HK, Kingston KC2500 1 TB SKC2500M81000G
155.6 (135.2min) fps +7%
Zotac ZBOX Magnus EN72070V
GeForce RTX 2080 Mobile, i7-9750H
145.2 (127.2min) fps
Усредн. модель с NVIDIA GeForce RTX 2080 Mobile
  (134.8 - 152.8, n=3)
144.3 fps -1%
1920x1080 ultra (3/3) best looking
Intel Ghost Canyon NUC (RTX 2070)
GeForce RTX 2070 (Desktop), i9-9980HK, Kingston KC2500 1 TB SKC2500M81000G
130.3 (114.9min) fps +5%
Zotac ZBOX Magnus EN72070V
GeForce RTX 2080 Mobile, i7-9750H
124.6 (108.1min) fps
Усредн. модель с NVIDIA GeForce RTX 2080 Mobile
  (103.9 - 133.8, n=3)
120.8 fps -3%
The Witcher 3
1024x768 Low Graphics & Postprocessing
Zotac ZBOX Magnus EN72070V
GeForce RTX 2080 Mobile, i7-9750H
338 (303min - 379max) fps
Усредн. модель с NVIDIA GeForce RTX 2080 Mobile
  (195.8 - 414, n=9)
322 fps -5%
Intel Ghost Canyon NUC (RTX 2070)
GeForce RTX 2070 (Desktop), i9-9980HK, Kingston KC2500 1 TB SKC2500M81000G
286 (243min - 334max) fps -15%
1920x1080 Ultra Graphics & Postprocessing (HBAO+)
Zotac ZBOX Magnus EN72070V
GeForce RTX 2080 Mobile, i7-9750H
95.9 (87min - 106max) fps
Усредн. модель с NVIDIA GeForce RTX 2080 Mobile
  (82.2 - 105, n=16)
95.6 fps 0%
Intel Ghost Canyon NUC (RTX 2070)
GeForce RTX 2070 (Desktop), i9-9980HK, Kingston KC2500 1 TB SKC2500M81000G
83.1 (72min - 93max) fps -13%
3DMark
Fire Strike Extreme Graphics
Усредн. модель с NVIDIA GeForce RTX 2080 Mobile
  (11133 - 12514, n=2)
11824 Points +6%
Zotac ZBOX Magnus EN72070V
GeForce RTX 2080 Mobile, i7-9750H
11133 Points
Intel Ghost Canyon NUC (RTX 2070)
GeForce RTX 2070 (Desktop), i9-9980HK, Kingston KC2500 1 TB SKC2500M81000G
9979 Points -10%
1920x1080 Fire Strike Graphics
Усредн. модель с NVIDIA GeForce RTX 2080 Mobile
  (22504 - 27319, n=16)
25211 Points +12%
Zotac ZBOX Magnus EN72070V
GeForce RTX 2080 Mobile, i7-9750H
22504 Points
Intel Ghost Canyon NUC (RTX 2070)
GeForce RTX 2070 (Desktop), i9-9980HK, Kingston KC2500 1 TB SKC2500M81000G
20775 Points -8%
2560x1440 Time Spy Graphics
Усредн. модель с NVIDIA GeForce RTX 2080 Mobile
  (9411 - 10992, n=15)
10046 Points +7%
Zotac ZBOX Magnus EN72070V
GeForce RTX 2080 Mobile, i7-9750H
9411 Points
Intel Ghost Canyon NUC (RTX 2070)
GeForce RTX 2070 (Desktop), i9-9980HK, Kingston KC2500 1 TB SKC2500M81000G
8631 Points -8%
3DMark 11
1280x720 Performance GPU
Усредн. модель с NVIDIA GeForce RTX 2080 Mobile
  (31826 - 38809, n=17)
35286 Points +11%
Zotac ZBOX Magnus EN72070V
GeForce RTX 2080 Mobile, i7-9750H
31877 Points
Intel Ghost Canyon NUC (RTX 2070)
GeForce RTX 2070 (Desktop), i9-9980HK, Kingston KC2500 1 TB SKC2500M81000G
28828 Points -10%
1280x720 Performance
Усредн. модель с NVIDIA GeForce RTX 2080 Mobile
  (20224 - 29759, n=19)
26032 Points +12%
Intel Ghost Canyon NUC (RTX 2070)
GeForce RTX 2070 (Desktop), i9-9980HK, Kingston KC2500 1 TB SKC2500M81000G
24131 Points +4%
Zotac ZBOX Magnus EN72070V
GeForce RTX 2080 Mobile, i7-9750H
23165 Points
мин. сред. выс. макс.QHD4K
The Witcher 3 (2015) 338 279 175 95.9 63.9
Dota 2 Reborn (2015) 145.2 135.5 130.5 124.6 119
Final Fantasy XV Benchmark (2018) 150 117 90.6 67.7 39.5
X-Plane 11.11 (2018) 114 102 84.7 73
Far Cry 5 (2018) 123 72 84 73 67 52
Forza Horizon 4 (2018) 169 147 145 139 122 82
Far Cry New Dawn (2019) 117 102 97 88 82 54
Metro Exodus (2019) 149 112 88.1 69.5 54.8 35.1
Borderlands 3 (2019) 128 117 93.4 84.3 61.4 33.2

Шумовые и температурные показатели. Энергопотребление

Нагрев Zotac ZBOX Magnus EN72070V при стресс-тесте (Prime95 плюс FurMark)

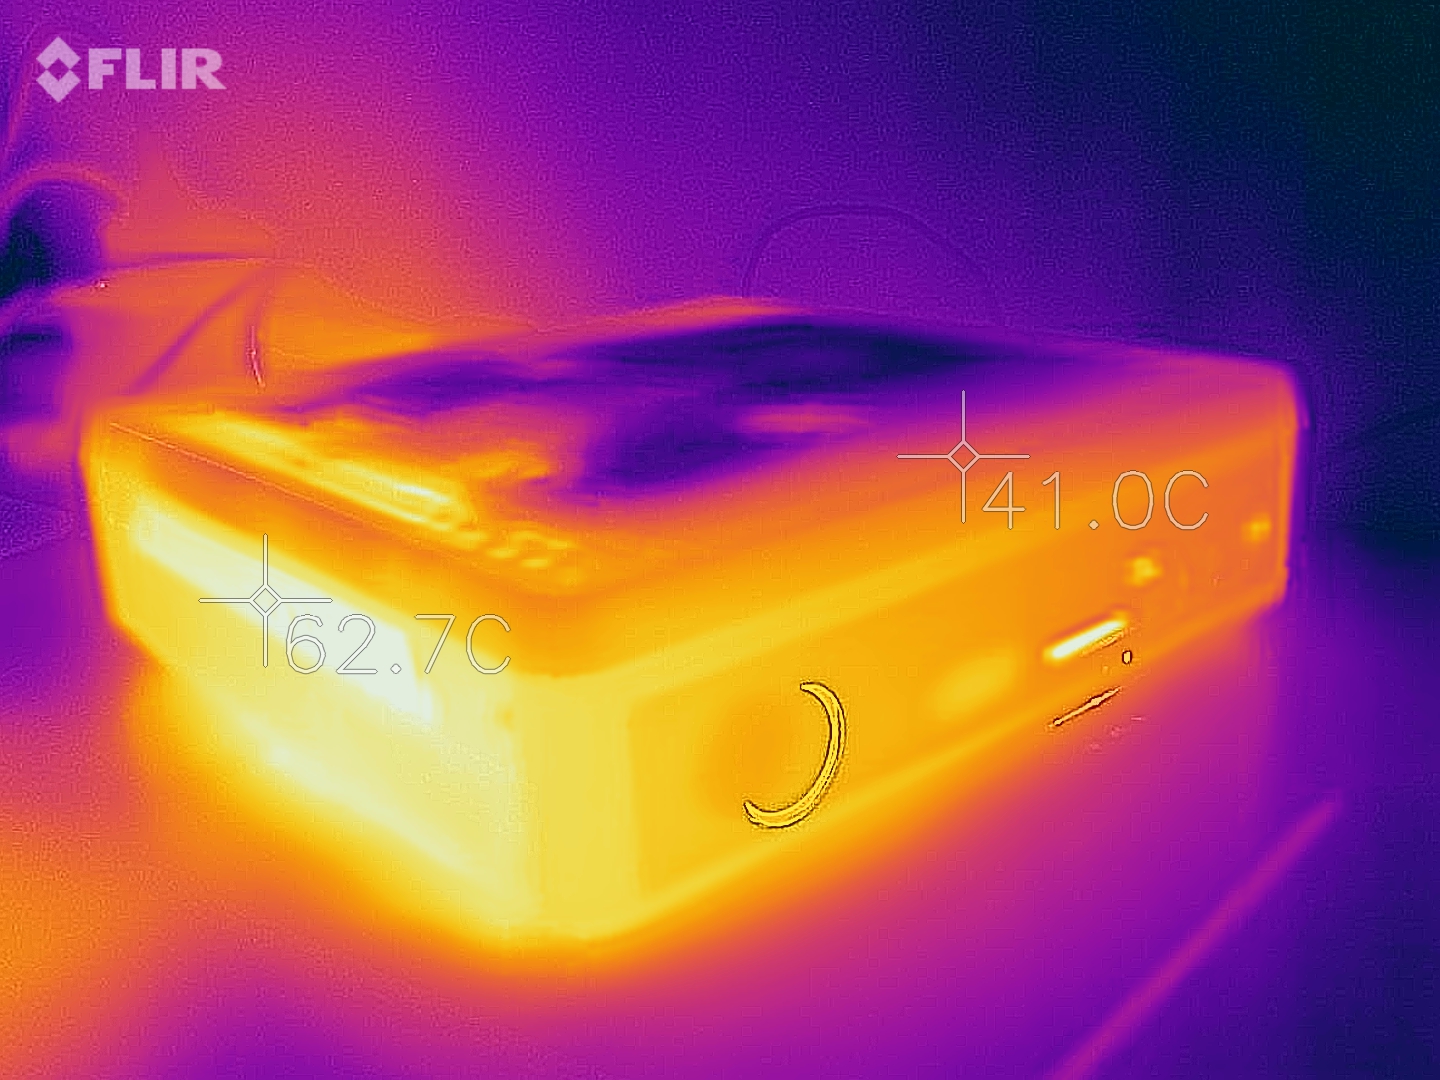
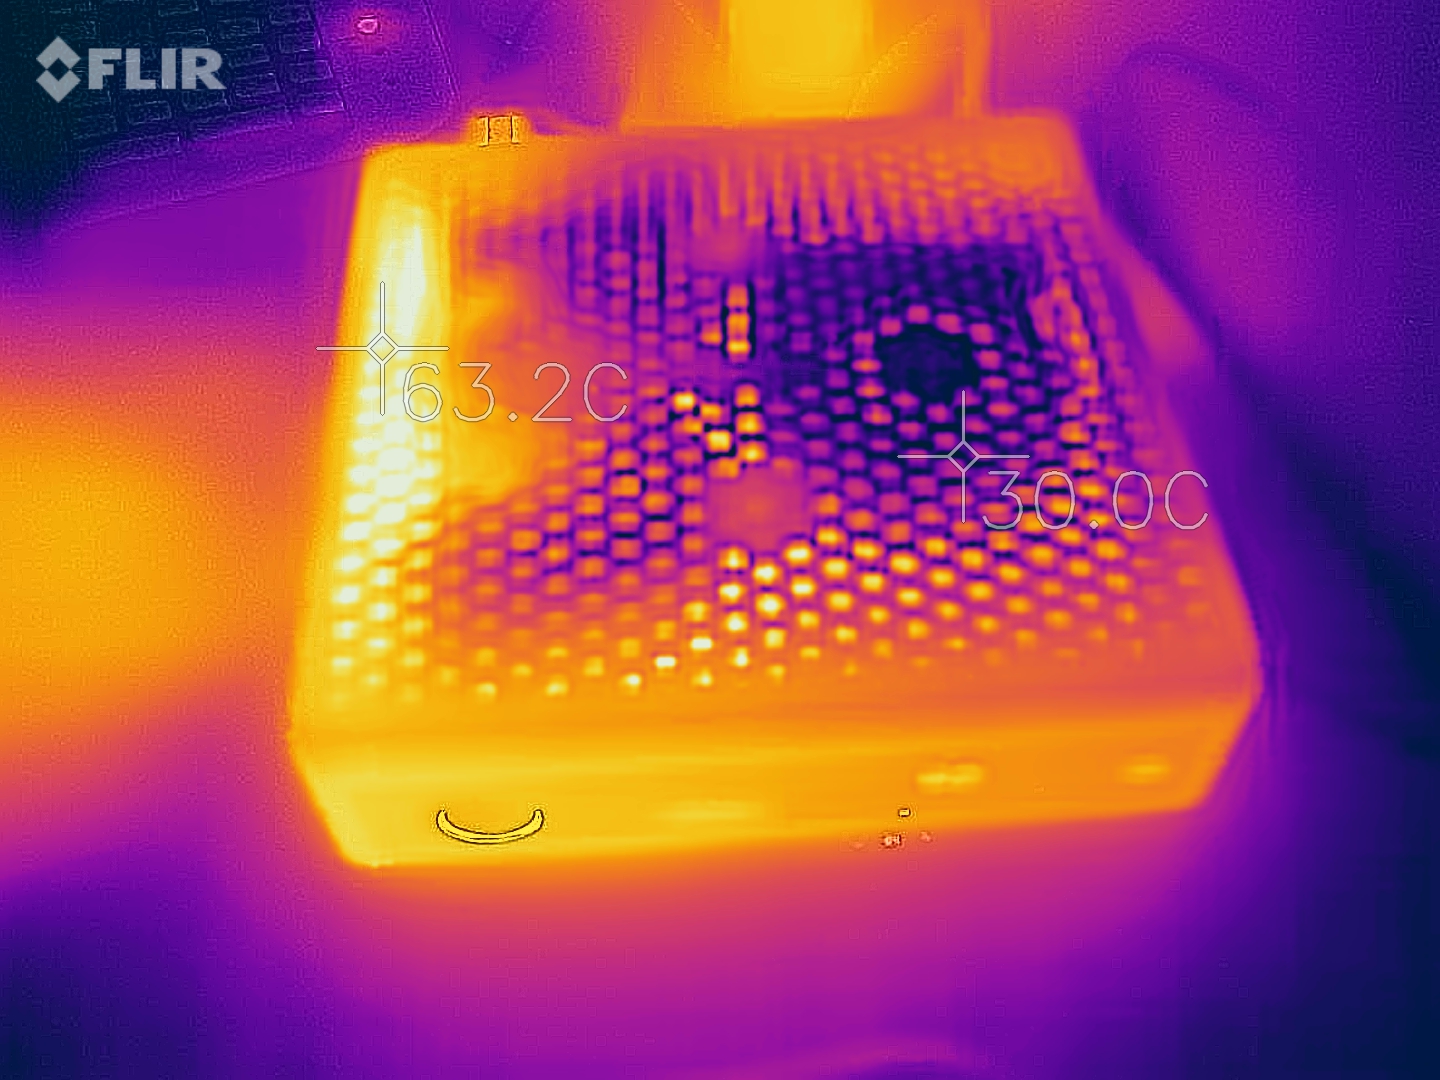
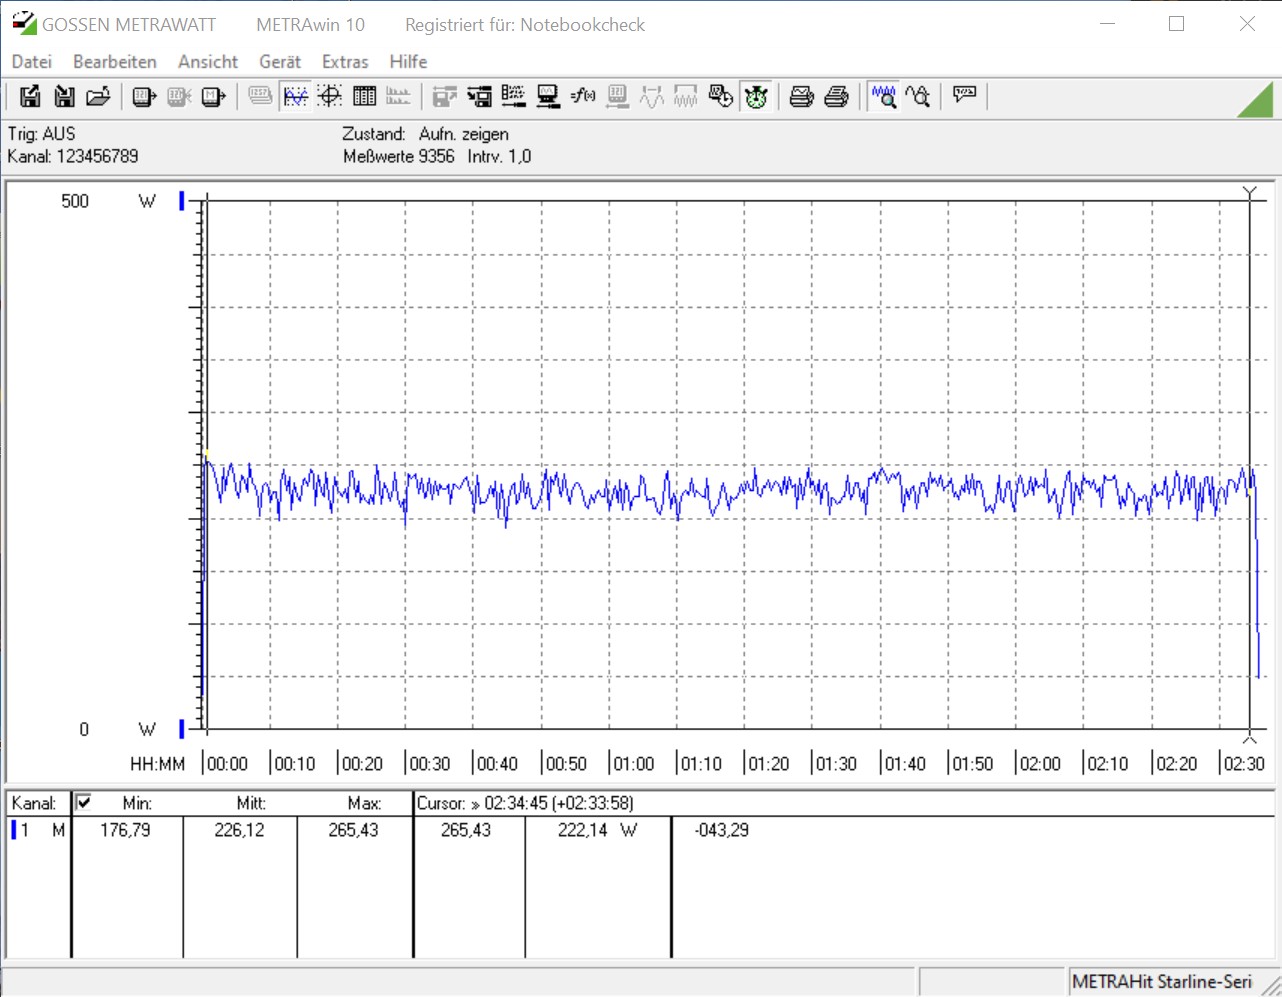
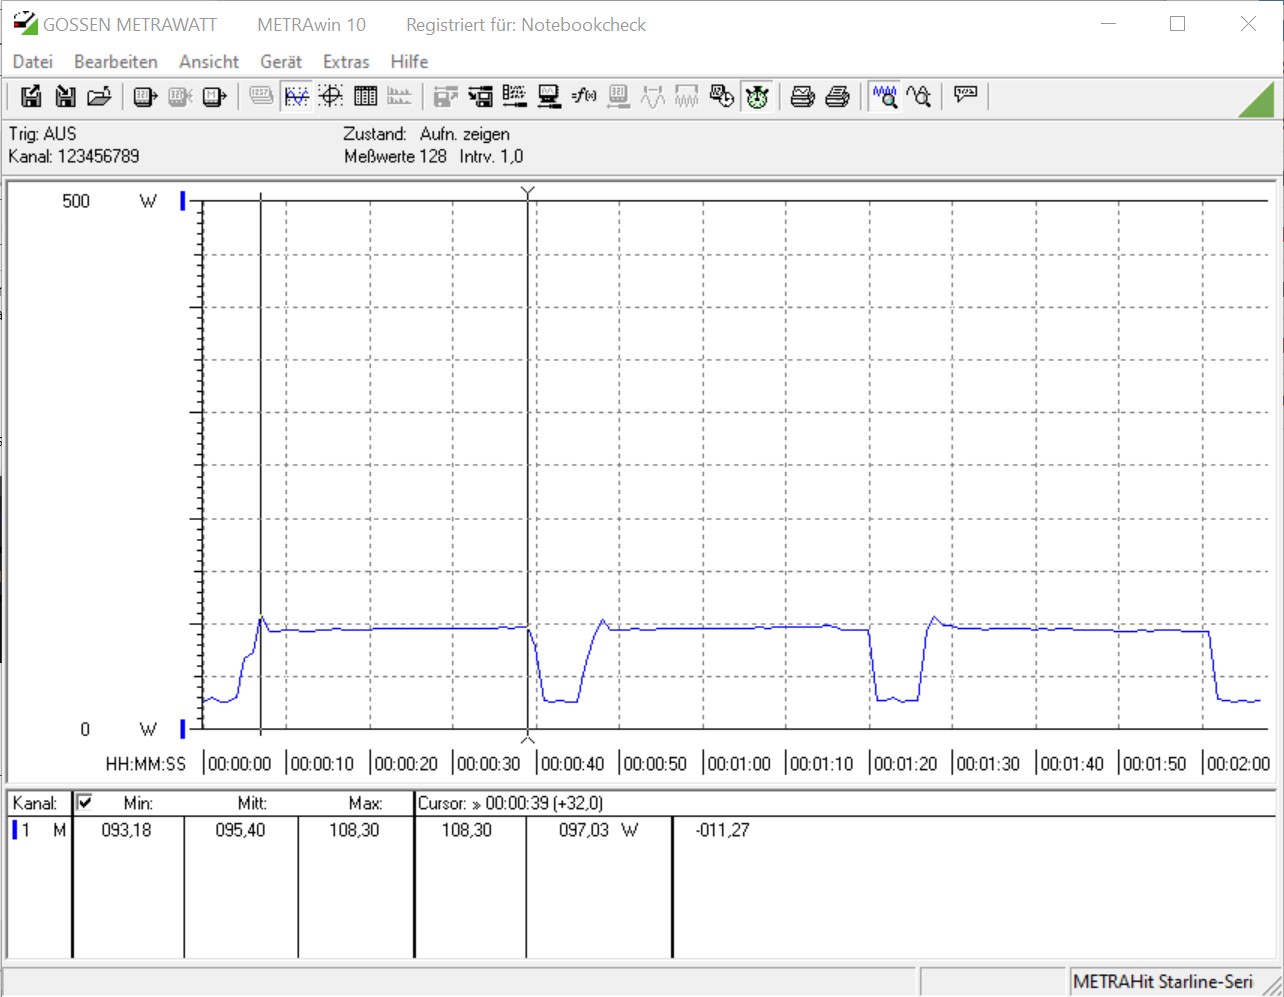
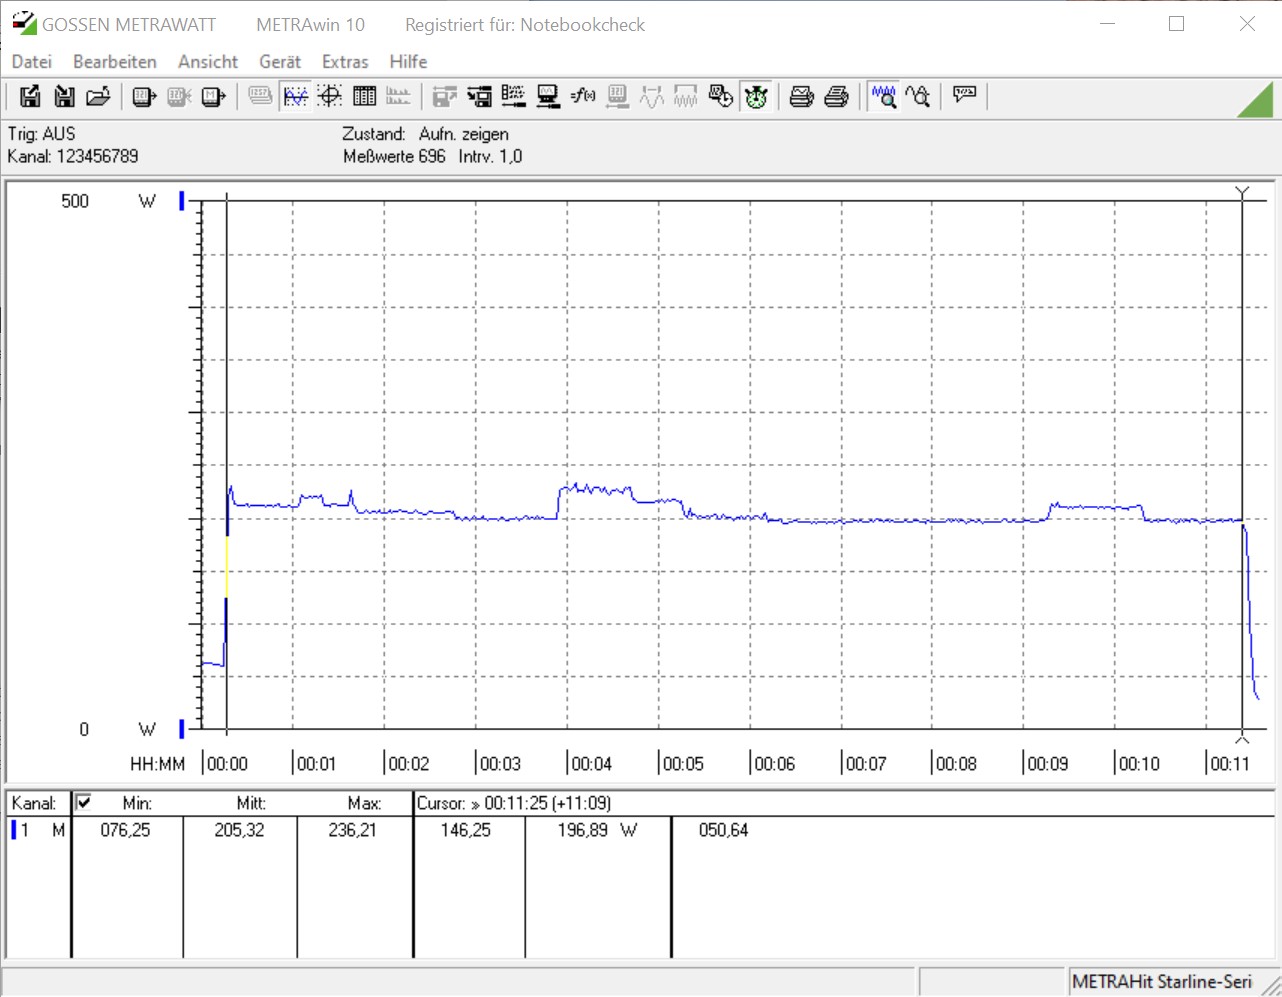
Исследуемый ZBox отличается хорошей, эффективной системой охлаждения. Она выдувает излишки тепла с боков и сзади корпуса. Уровень шума под максимальной вычислительной нагрузкой можно без преувеличения назвать приятным, всего 38.6 акустических децибела. Профиль звучания вентилятора не отличается высокотональностью или другими неприятными характеристиками. Нагрузка реальной игрой создаёт гудение с громкостью 37.2 децибела. Можно сказать, что разработчики немного пожертвовали температурами ради комфорта ушей пользователя, потому что при стресс-тестировании процессор Intel и видеопроцессор Nvidia греются до 90 °C. С другой стороны, до критических значений остаётся ещё около десяти градусов.

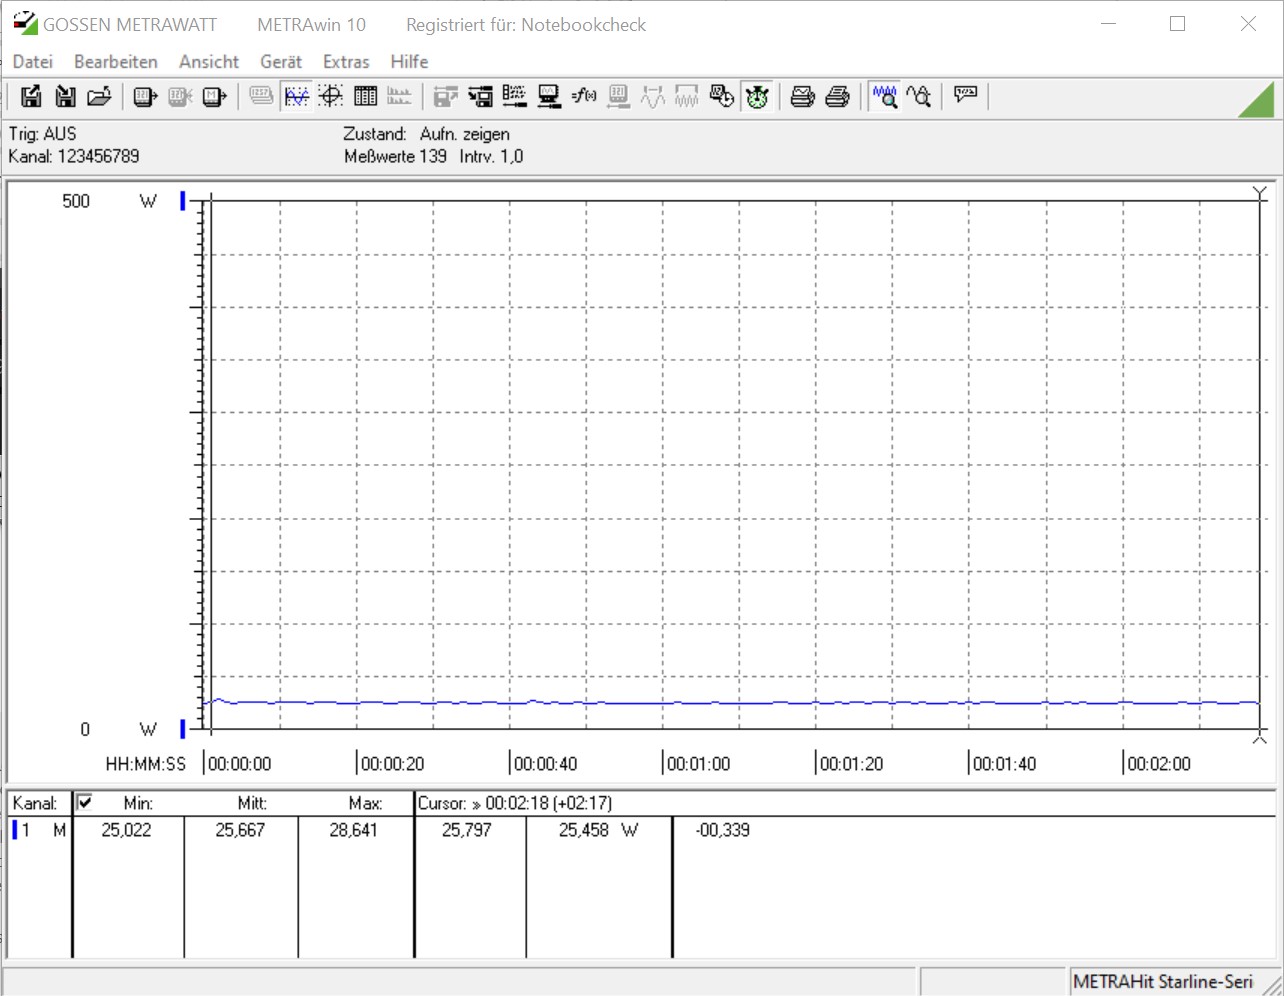
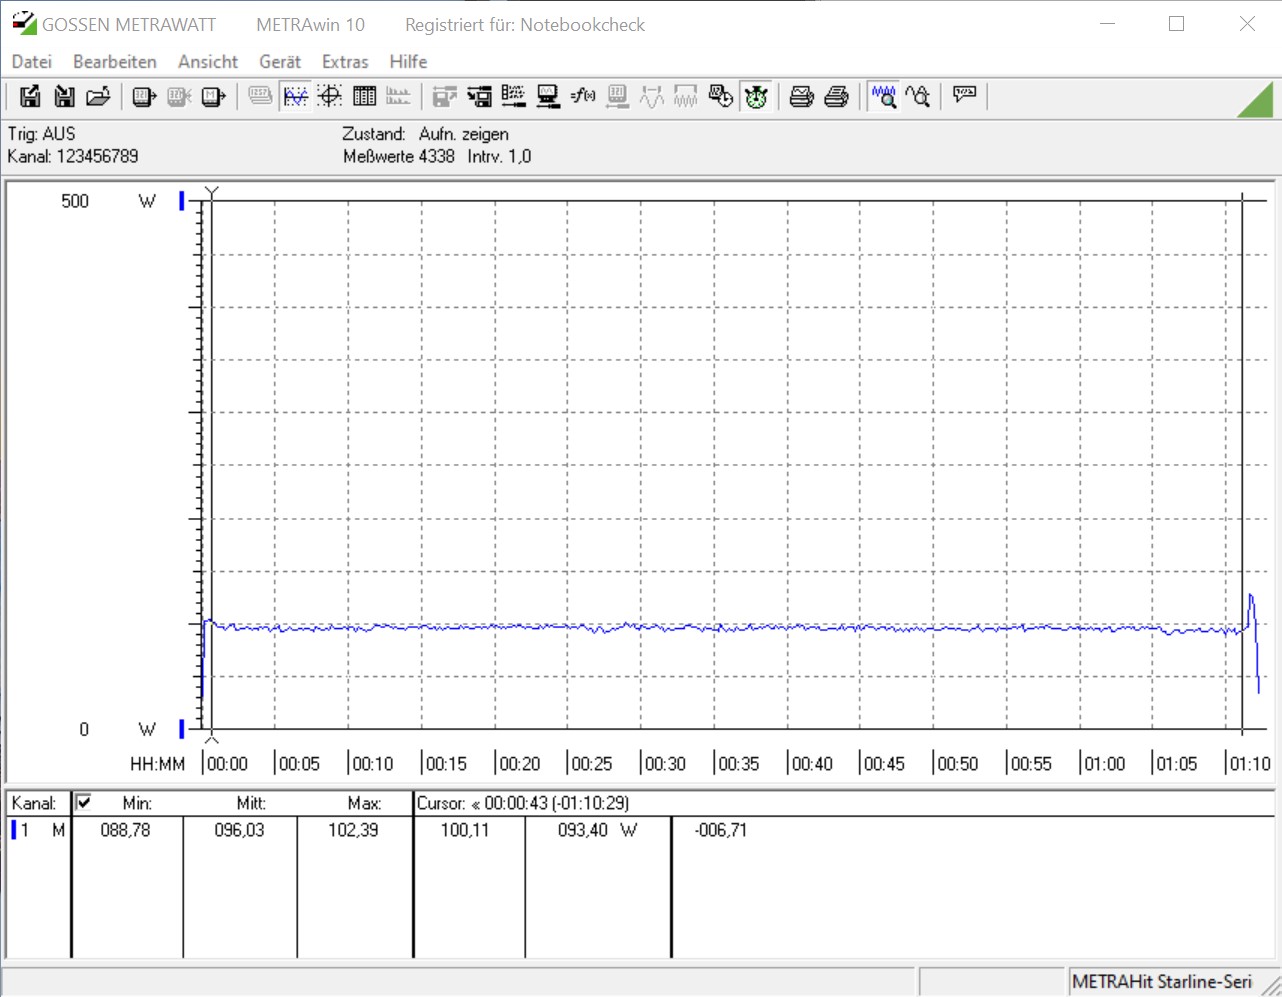
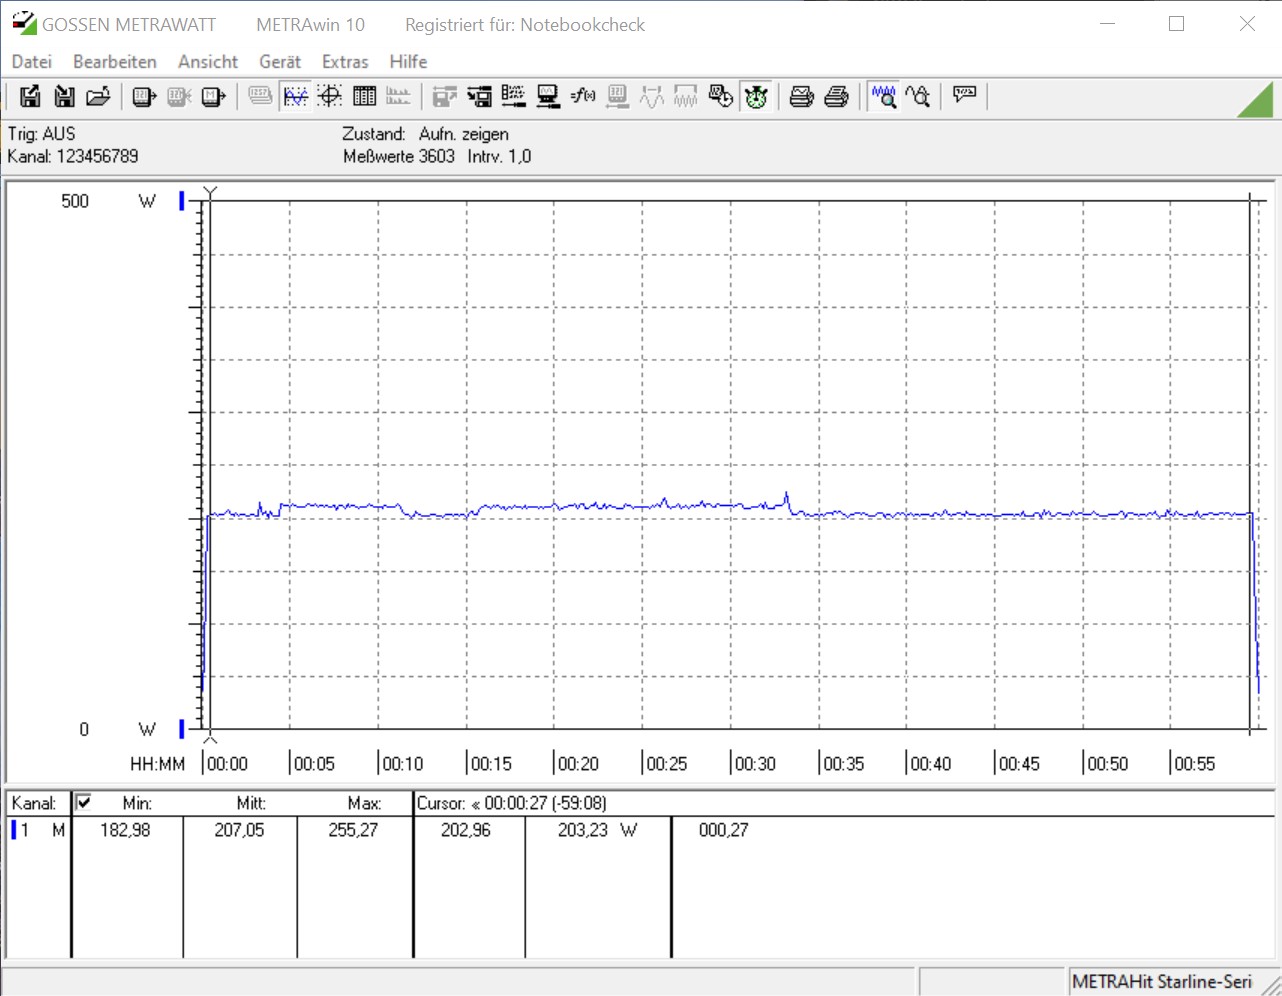
Что точно стоит записать в заслуги этого компьютера? Низкий расход энергии. Он положительно смотрится в сравнении с обычным игровым компьютером в корпусе Full Tower и с соответствующими компонентами, да и на фоне Ghost Canyon NUC тоже не хромает. Максимальный аппетит компьютера при реальной игровой нагрузке ограничен 236 ваттами, а мощность адаптера питания - 330 ватт, он точно справится.

Power Consumption
1920x1080 The Witcher 3 ultra (external Monitor)
AMD Ryzen 9 3950X
NVIDIA Titan RTX, R9 3950X, Intel Optane 905P 480GB 2.5 (Idle: 95 W)
423.6 (400min - 442max) Watt * -106%
Intel Core i9-10900K
NVIDIA Titan RTX, i9-10900K, WDC PC SN720 SDAQNTW-512G (Idle: 52.3 W)
396.2 (380min - 475max) Watt * -93%
Intel Core i5-10600K
NVIDIA Titan RTX, i5-10600K (Idle: 52.2 W)
386.9 (380min - 404max) Watt * -88%
Intel Core i5 9400F
NVIDIA Titan RTX, i5-9400F (Idle: 57 W)
379.5 (292min - 402max) Watt * -85%
Intel Ghost Canyon NUC (RTX 2070)
GeForce RTX 2070 (Desktop), i9-9980HK, Kingston KC2500 1 TB SKC2500M81000G (Idle: 33.1 W)
237.1 (227min - 263max) Watt * -15%
Zotac ZBOX Magnus EN72070V
GeForce RTX 2080 Mobile, i7-9750H (Idle: 25.7 W)
205.3 (76min - 236max) Watt *
Prime95 V2810 Stress (external Monitor)
Intel Core i9-10900K
NVIDIA Titan RTX, i9-10900K, WDC PC SN720 SDAQNTW-512G (Idle: 52.3 W)
275.7 (254min - 385max) Watt * -187%
Intel Core i5-10600K
NVIDIA Titan RTX, i5-10600K (Idle: 52.2 W)
204.4 (191min - 261max) Watt * -113%
AMD Ryzen 9 3950X
NVIDIA Titan RTX, R9 3950X, Intel Optane 905P 480GB 2.5 (Idle: 95 W)
198.8 (185min - 240max) Watt * -107%
Intel Core i5 9400F
NVIDIA Titan RTX, i5-9400F (Idle: 57 W)
131.6 (122min - 187max) Watt * -37%
Intel Ghost Canyon NUC (RTX 2070)
GeForce RTX 2070 (Desktop), i9-9980HK, Kingston KC2500 1 TB SKC2500M81000G (Idle: 33.1 W)
109.4 (107min - 151max) Watt * -14%
Zotac ZBOX Magnus EN72070V
GeForce RTX 2080 Mobile, i7-9750H (Idle: 25.7 W)
96 (89min - 102max) Watt *
Cinebench R15 Multi (external Monitor)
Intel Core i9-10900K
NVIDIA Titan RTX, i9-10900K, WDC PC SN720 SDAQNTW-512G (Idle: 52.3 W)
268.5 (265min - 270max) Watt * -181%
AMD Ryzen 9 3950X
NVIDIA Titan RTX, R9 3950X, Intel Optane 905P 480GB 2.5 (Idle: 95 W)
219.5 (218min - 225max) Watt * -130%
Intel Core i5-10600K
NVIDIA Titan RTX, i5-10600K (Idle: 52.2 W)
172.5 (170min - 176max) Watt * -81%
Intel Core i5 9400F
NVIDIA Titan RTX, i5-9400F (Idle: 57 W)
122.5 (121min - 125max) Watt * -28%
Zotac ZBOX Magnus EN72070V
GeForce RTX 2080 Mobile, i7-9750H (Idle: 25.7 W)
95.4 (93min - 108max) Watt *
Temperatures - CPU Temperature Prime95
Intel Core i9-10900K
NVIDIA Titan RTX, i9-10900K, WDC PC SN720 SDAQNTW-512G
88 °C +2%
Zotac ZBOX Magnus EN72070V
GeForce RTX 2080 Mobile, i7-9750H
86 °C
AMD Ryzen 9 3950X
NVIDIA Titan RTX, R9 3950X, Intel Optane 905P 480GB 2.5
83.8 °C -3%
Intel Core i5-10600K
NVIDIA Titan RTX, i5-10600K
70 °C -19%
Intel Core i5 9400F
NVIDIA Titan RTX, i5-9400F
61 °C -29%

* ... меньше = лучше

Энергопотребление ZBOX Magnus простое
Prime95, энергопотребление
FurMark, энергопотребление
Prime95 плюс FurMark, энергопотребление
Многопоточный Cinebench R15, энергопотребление
Ведьмак 3, качество "Ultra"
Prime95
FurMark
Prime95 плюс FurMark


За

+ очень компактен
+ качественный корпус
+ справляется с играми
+ под нагрузкой не шумит сильно
+ много портов
+ хорошее общесистемное быстродействие
+ место для трёх накопителей - два M.2 22x80 и один 2.5"
+ Wi-Fi 6

Против

- высокая цена
- не готов к работе сразу, RAM и SSD покупаются отдельно
- ограниченные перспективы апгрейда, процессор и видеокарта распаяны

Вердикт - Тишина и мощь

Протестировано: Zotac ZBOX Magnus. Выразим благодарность за тестовый образец представительству Zotac в Германии

Сегодняшний ZBOX Magnus - это не просто уже готовый, собранный кем-то компьютер. Это платформа, которая позволит выбрать компоненты на свой вкус, чтобы собрать компьютер своей мечты. Речь идёт о свободе выбора RAM и накопителя данных. В плане выбора процессора и видеокарты свободы уже меньше - они припаяны, их замена после покупки не предполагается.

В наш Magnus встроен процессор Intel Core i7-9750H и дискретная видеокарта Nvidia GeForce RTX 2080 (для ноутбука). Эта пара радостно справится с любыми играми, и отнюдь не в низком качестве. Разумным потолком в плане разрешения выглядит WQHD, другими словами, 1440p. Какие-то игры хорошо работают в разрешении UHD 2160p, но обычно со сниженными параметрами качества. В итоге выходит, что мобильная RTX 2080 обеспечивает тот же уровень быстродействия, что настольная GeForce RTX 2070.

Zotac ZBOX Magnus миниатюрен, но обладает достаточной для современных игр мощью. Главное, это до покупки ознакомиться с его особенностями.

Изученный сегодня компьютер занимает очень мало места. Компактные модели обычно шумят и греются, но в Zotac смогли избежать чужих ошибок. Шум системы охлаждения при нагрузке ограничен лишь 39 акустическими децибелами, и нагрев тоже выглядит умеренно.

На этом мы заканчиваем рассказ о плюсах и минусах модели ZBOX-EN72080V-BE. Она стоит около 1700 евро, почти столько же стоит и Intel Ghost Canyon NUC. Но последний поставляется без дискретной видеокарты и потому преимущество, несомненно, остаётся за товаром Zotac.

Этот важный материал точно понравится твоим друзьям в социальных сетях!
'
> Обзоры Ноутбуков, Смартфонов, Планшетов. Тесты и Новости > Обзоры > Обзор мини-компьютера Zotac ZBOX Magnus в конфигурации с GeForce RTX 2080
Sebastian Bade, 2020-08-17 (Update: 2021-03-12)