Обзор ноутбука Dell Inspiron 16 Plus 7630

Dell Inspiron 16 Plus 7630 пришел на смену Inspiron 16 Plus 7620 2022 года выпуска, получив полное обновление дизайна и внутренних компонентов. К слову, прошлогодняя модель и без того была радикально изменена со времен Inspiron 16 Plus 7610 2021. Такая спешность Dell в ежегодных обновлениях удивляет на фоне прочих производителей, которые используют один и тот же корпус по несколько лет подряд. Как бы там ни было, подобно прочим ноутбука 2023 года Inspiron 16 Plus 7630 несет на борту процессоры Intel 13 поколения Raptor Lake-H и видеокарты Nvidia Ada Lovelace.
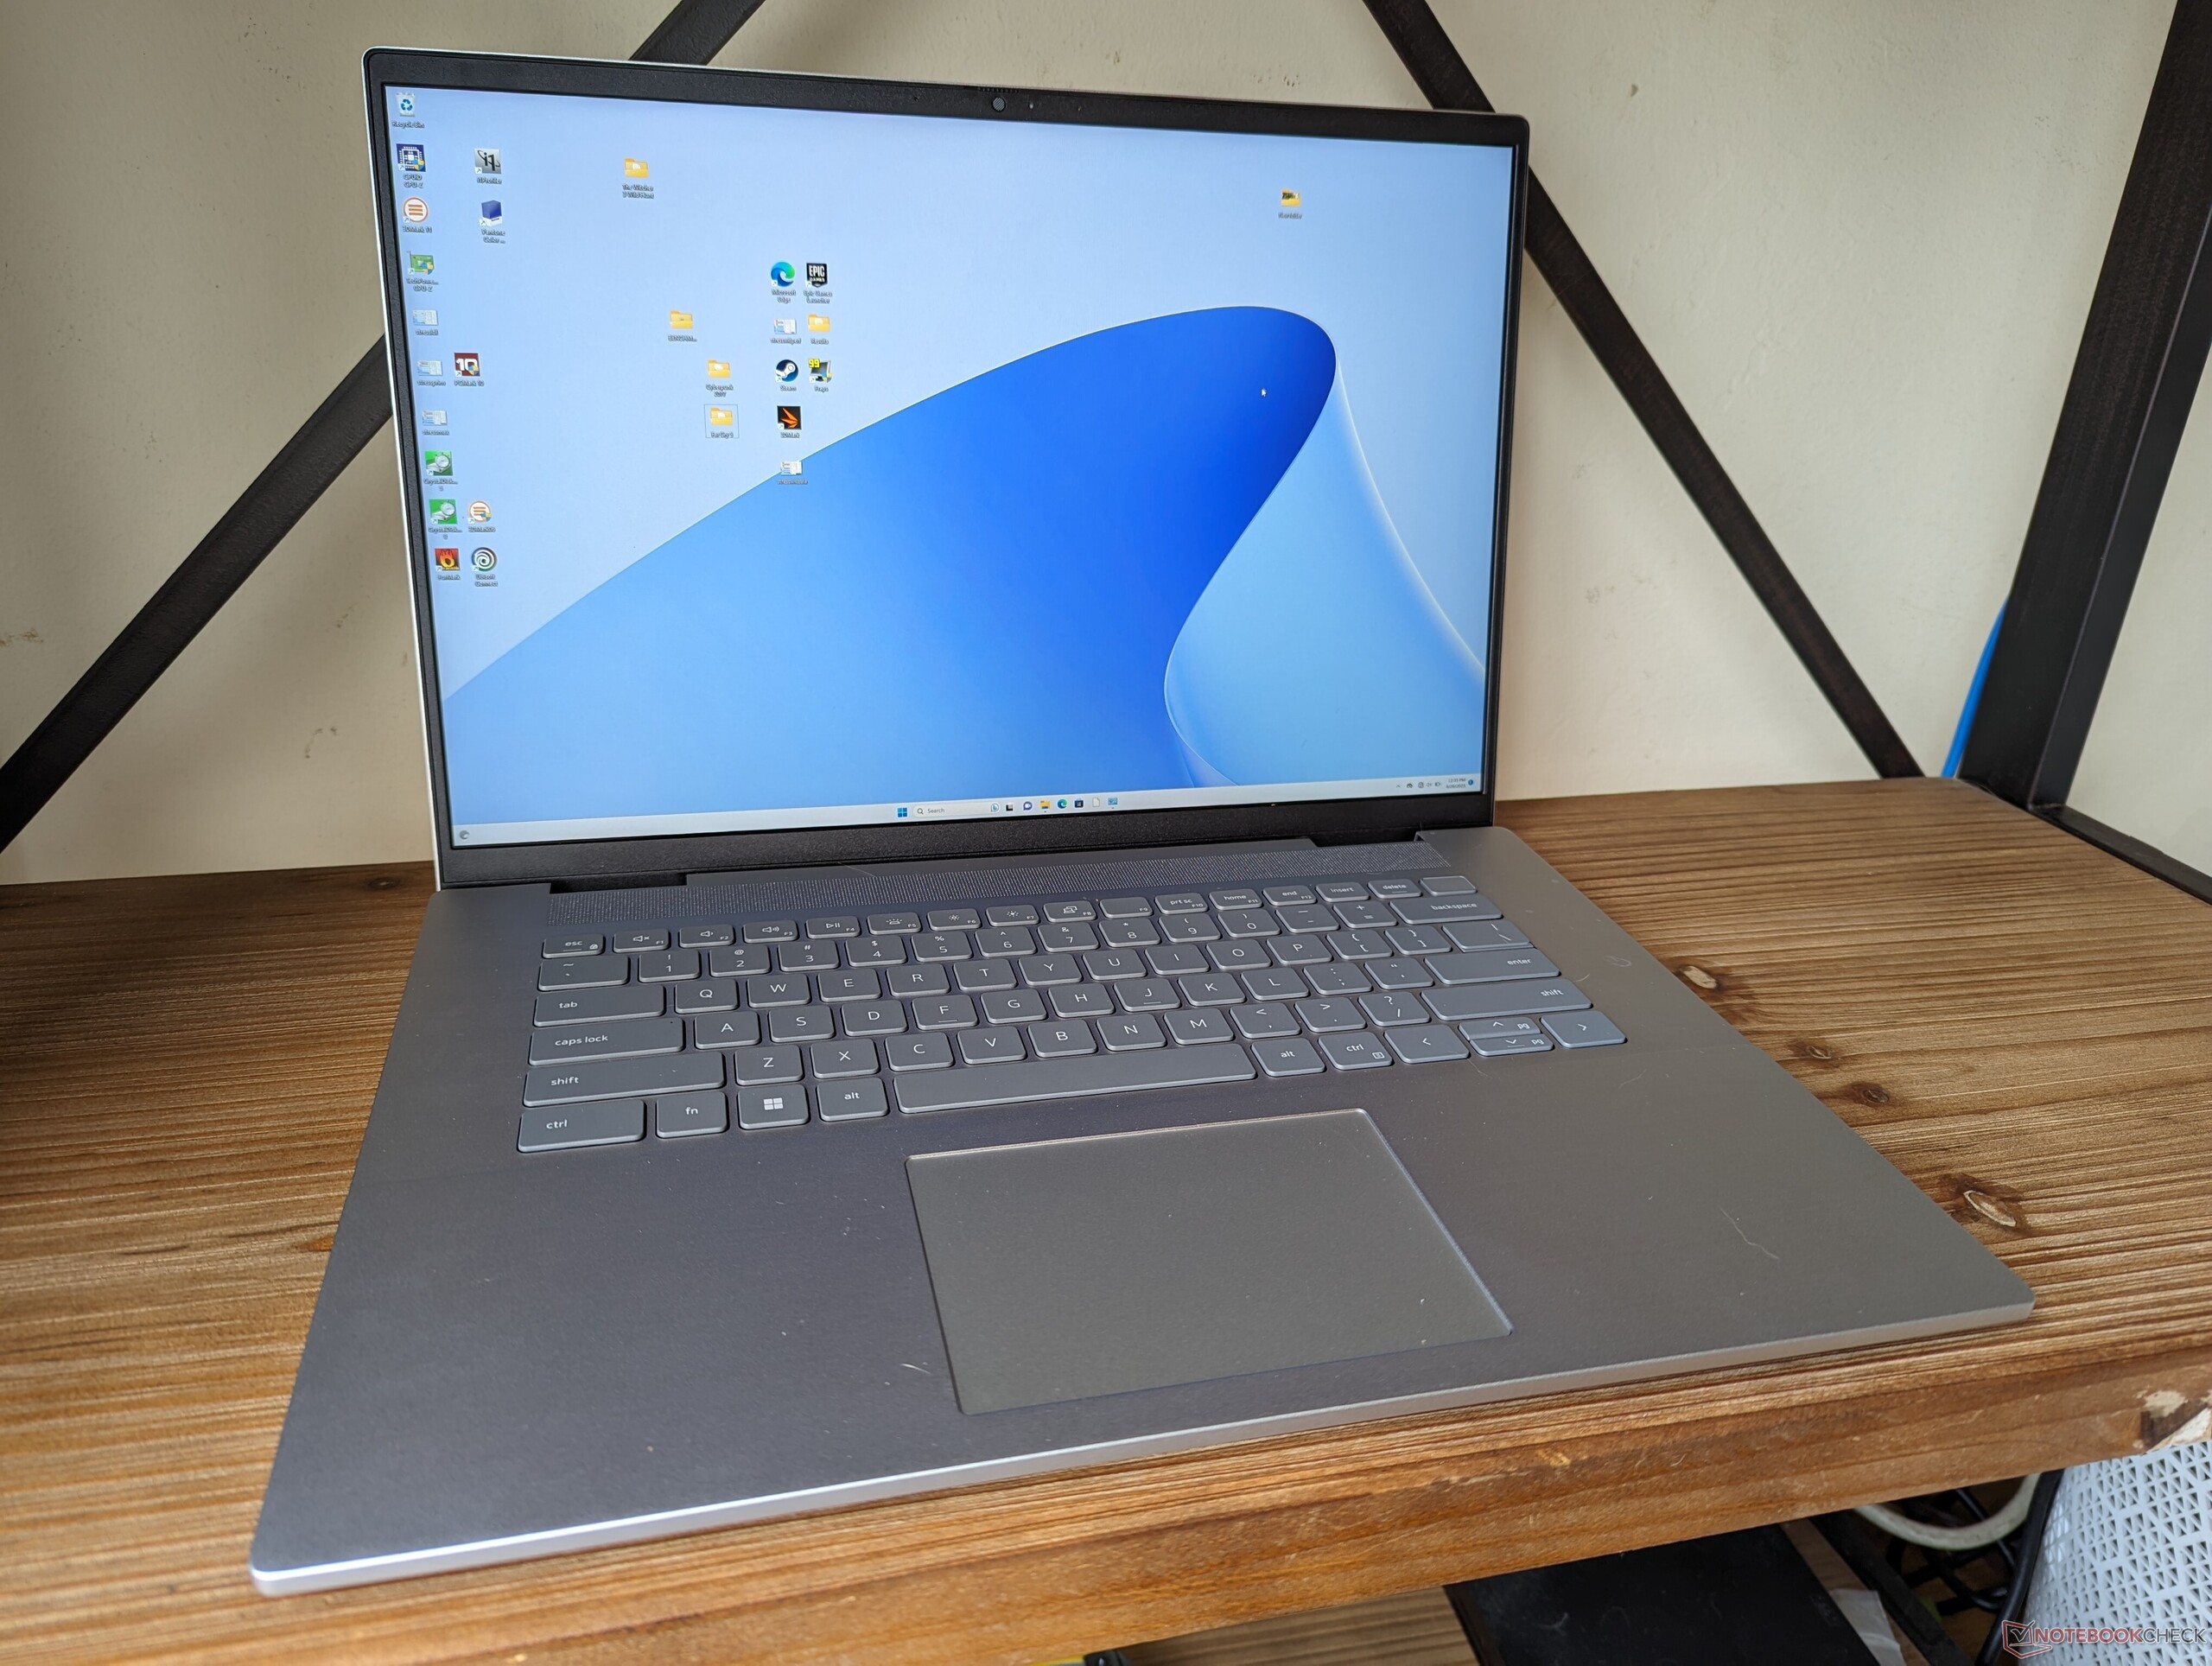
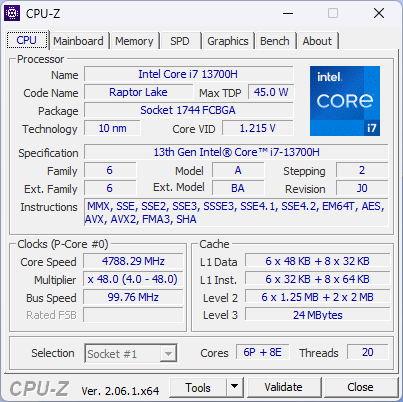
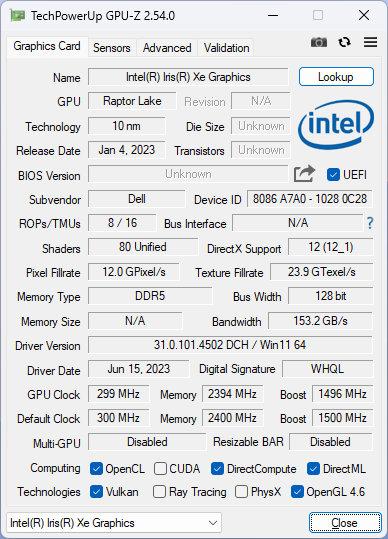
Наш тестовый образец - конфигурация высокого уровня с Core i7-13700H, RTX 4060 GPU и 120-Гц IPS дисплеем (2560 x 1600) на борту; цена данной версии составляет $1250, что уже на $400 ниже официального ценника на момент запуска модели в продажу. Для модели также доступны Core i5-13500H, Iris Xe, RTX 3050, RTX 4050 и 60-Гц 1200p экран. В продажу должна выйти и модель на AMD Ryzen 5 7640HS/Ryzen 7 7840HS - Inspiron 16 Plus 7635.
Конкурентами Inspiron 16 Plus 7630 мы можем назвать 16-дюймовые мультимедийные ноутбуки: Lenovo Slim Pro 9i 16, Asus VivoBook Pro 16X, HP Envy 16, MSI Summit E16 Flip. Inspiron 16 Plus 7630 не стоит путать со стандартным Inspiron 16 и трансформером Inspiron 16 Plus 7630 2-in-1 - оба они имеют иные характеристики и особенности, несмотря на схожее название.
Соперники
Рейтинг | Дата | Модель | Вес | Height | Размер | Разрешение | Цена |
|---|---|---|---|---|---|---|---|
| 87.1 % v7 (old) | September 2023 | Dell Inspiron 16 Plus 7630 i7-13700H, GeForce RTX 4060 Laptop GPU | 2.2 килог. | 19.95 мм | 16.00" | 2560x1600 | |
| 87.4 % v7 (old) | September 2022 | Dell Inspiron 16 Plus 7620 i7-12700H, GeForce RTX 3050 Ti Laptop GPU | 2.1 килог. | 18.99 мм | 16.00" | 3072x1920 | |
| 88 % v7 (old) | August 2023 | Lenovo Slim Pro 9i 16IRP8 i9-13905H, GeForce RTX 4050 Laptop GPU | 2.2 килог. | 18.2 мм | 16.00" | 3200x2000 | |
| 86.2 % v7 (old) | July 2023 | Asus Vivobook Pro 16X K6604JV-MX016W i9-13980HX, GeForce RTX 4060 Laptop GPU | 2.1 килог. | 22.8 мм | 16.00" | 3200x2000 | |
| 86.9 % v7 (old) | September 2022 | HP Envy 16 h0112nr i7-12700H, GeForce RTX 3060 Laptop GPU | 2.3 килог. | 19.8 мм | 16.00" | 3840x2400 | |
| 84.2 % v7 (old) | November 2022 | MSI Summit E16 Flip A12UDT-031 i7-1280P, GeForce RTX 3050 Ti Laptop GPU | 1.9 килог. | 16.85 мм | 16.00" | 2560x1600 |
Дизайн и особенности
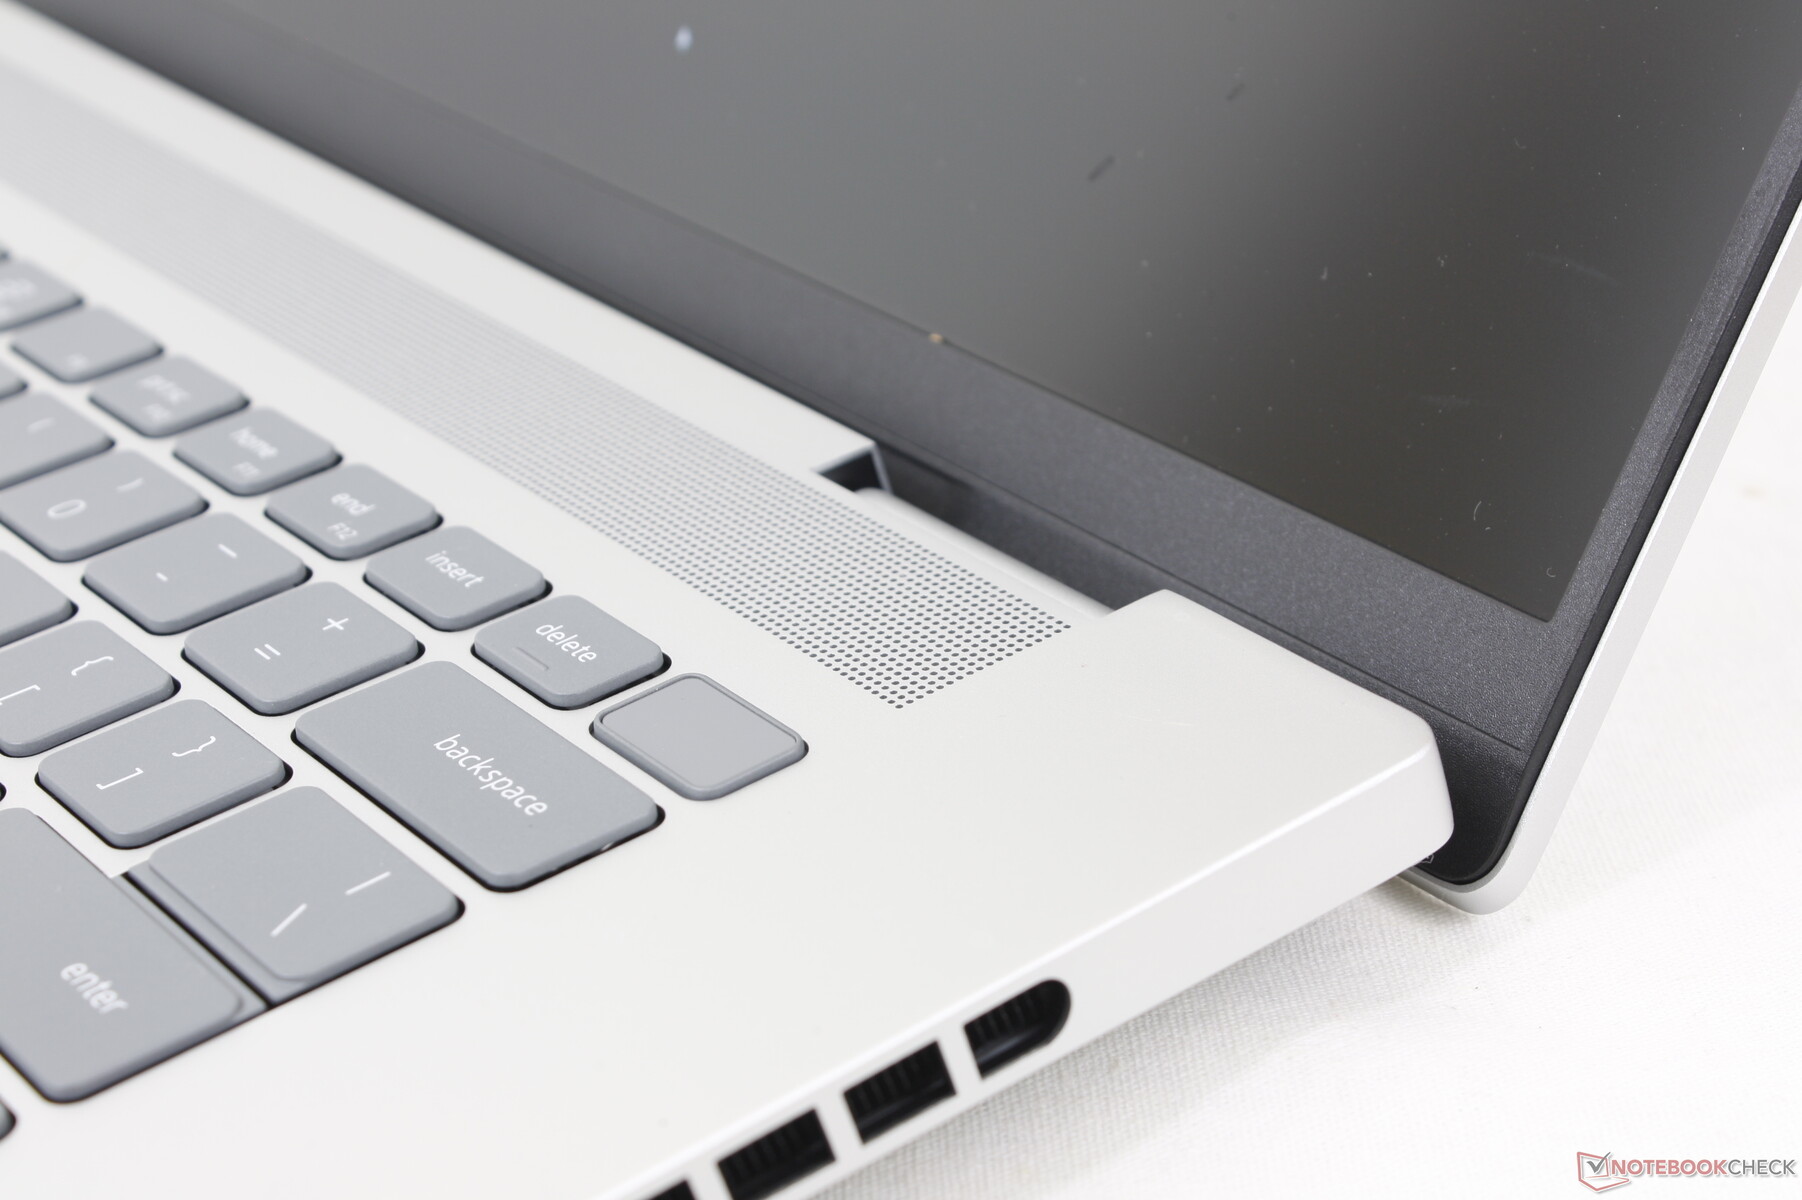
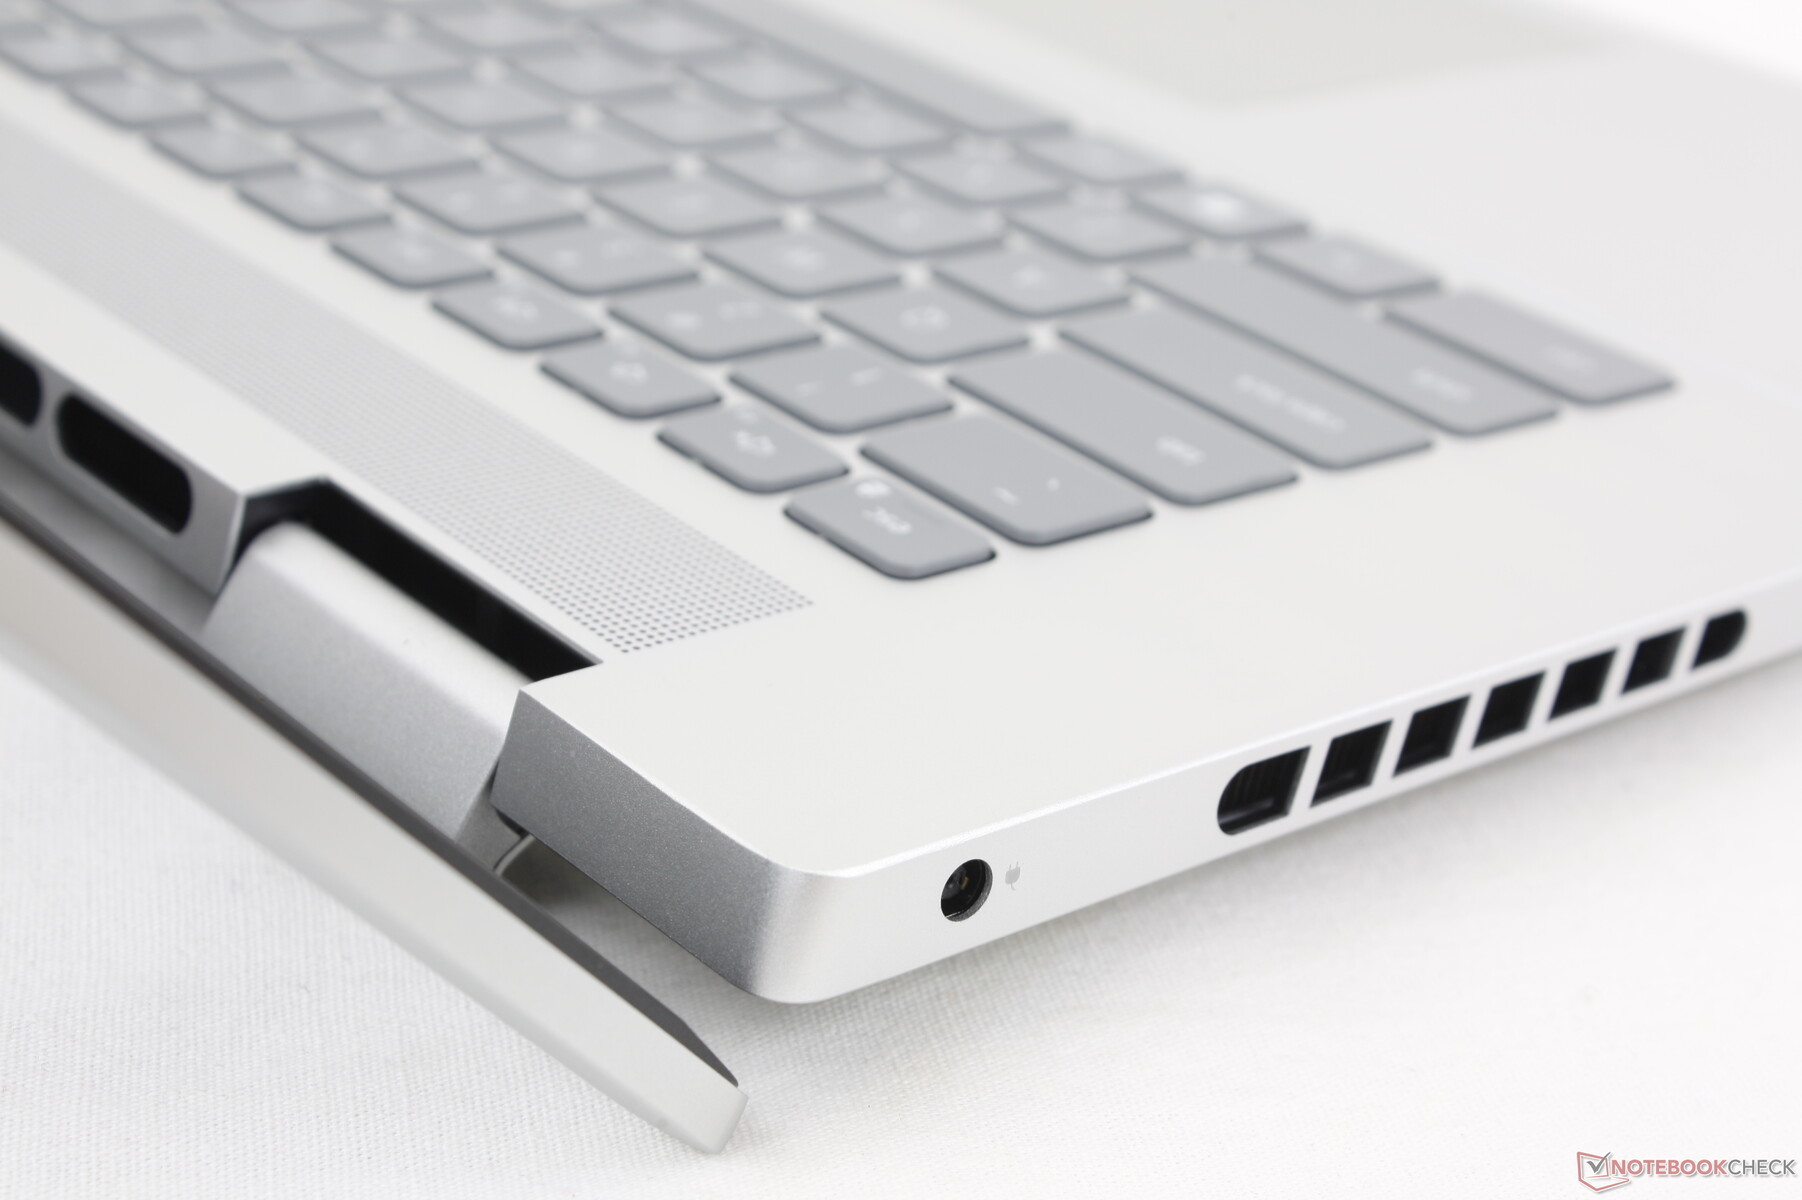
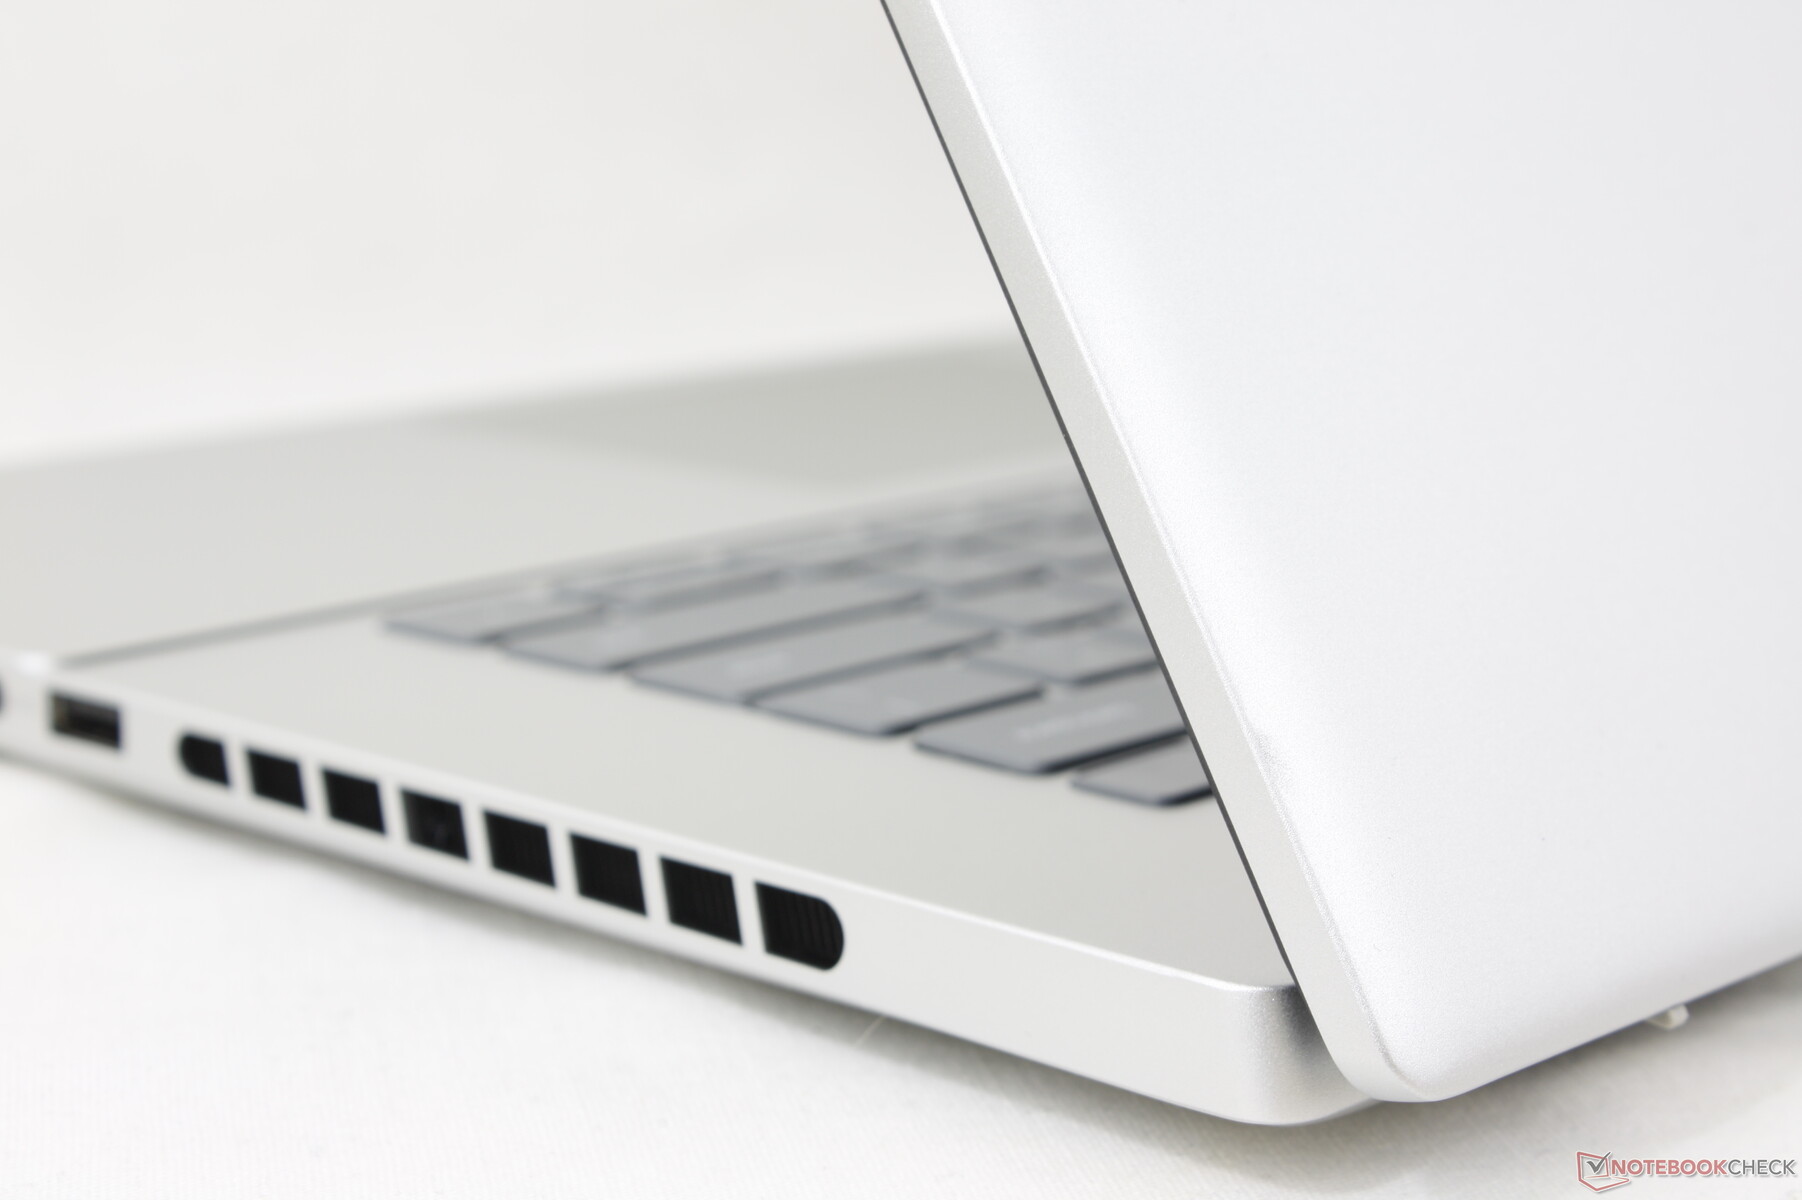
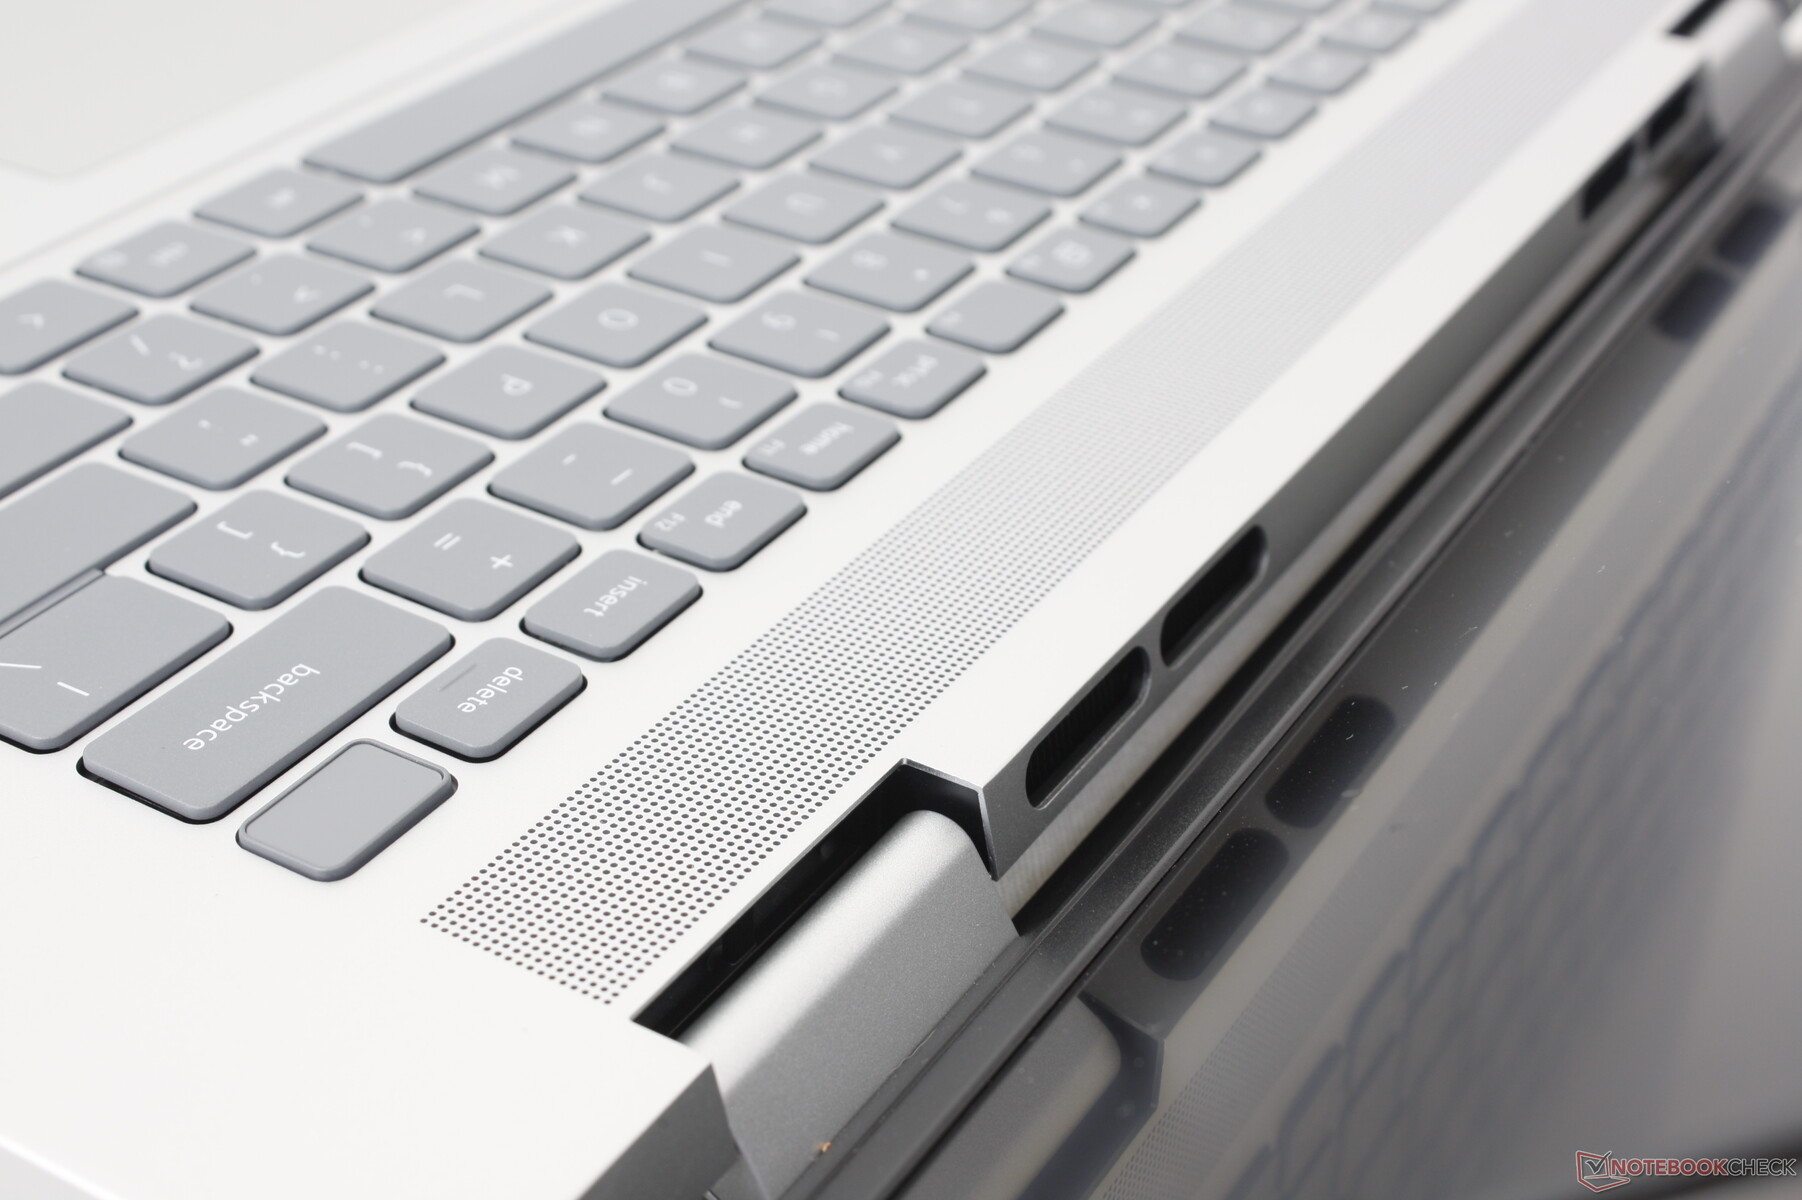
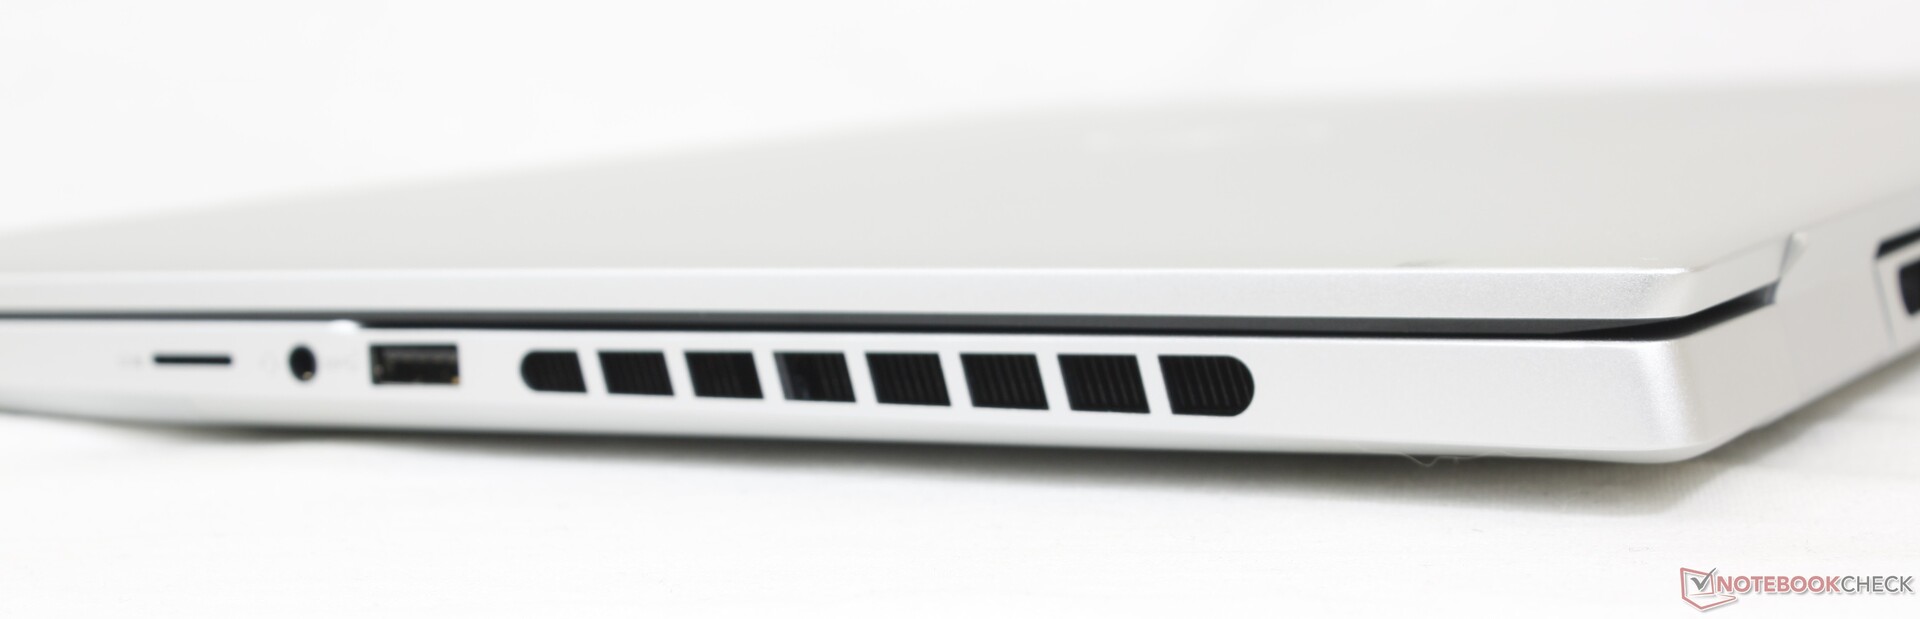
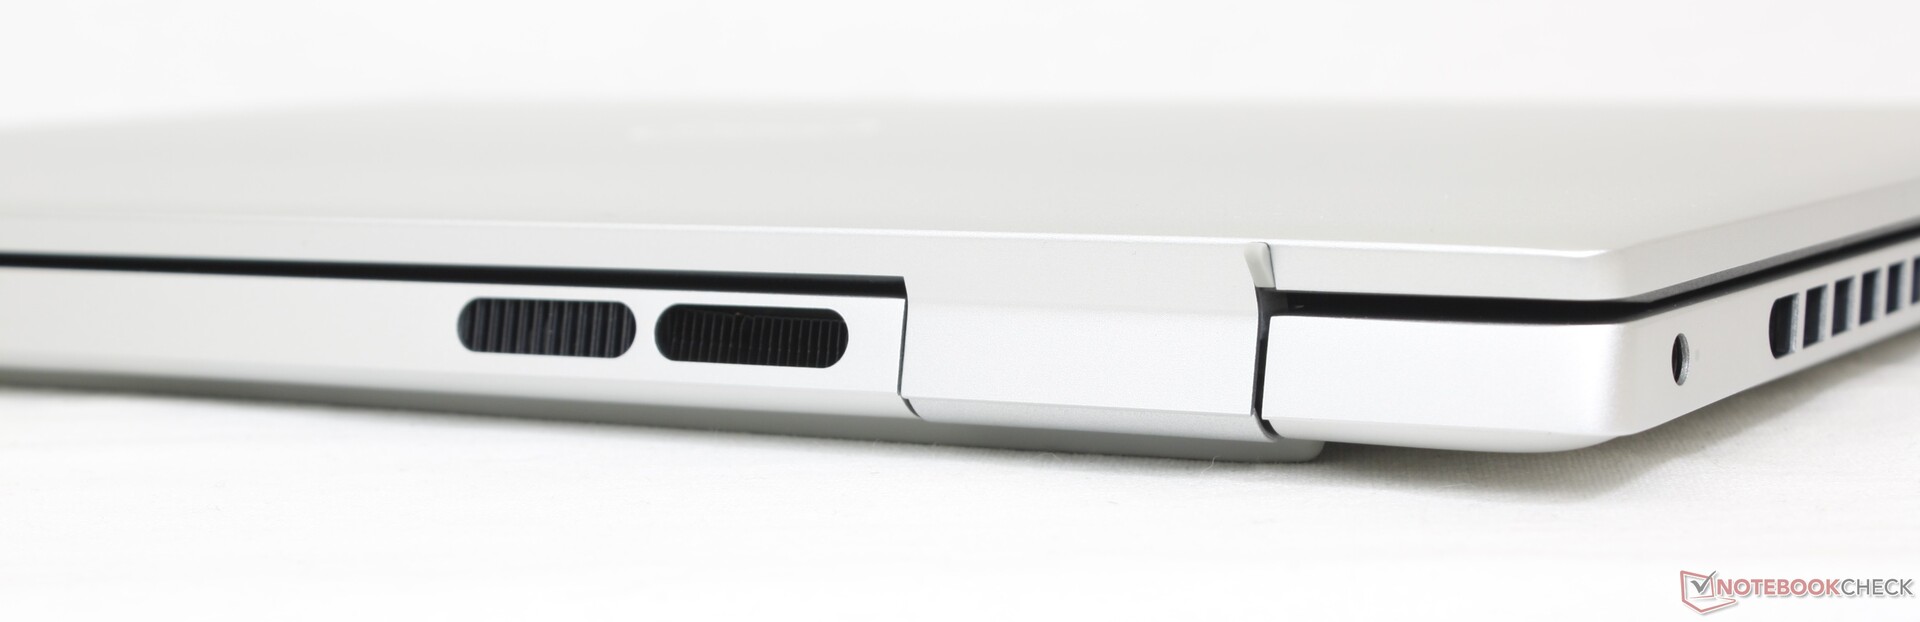
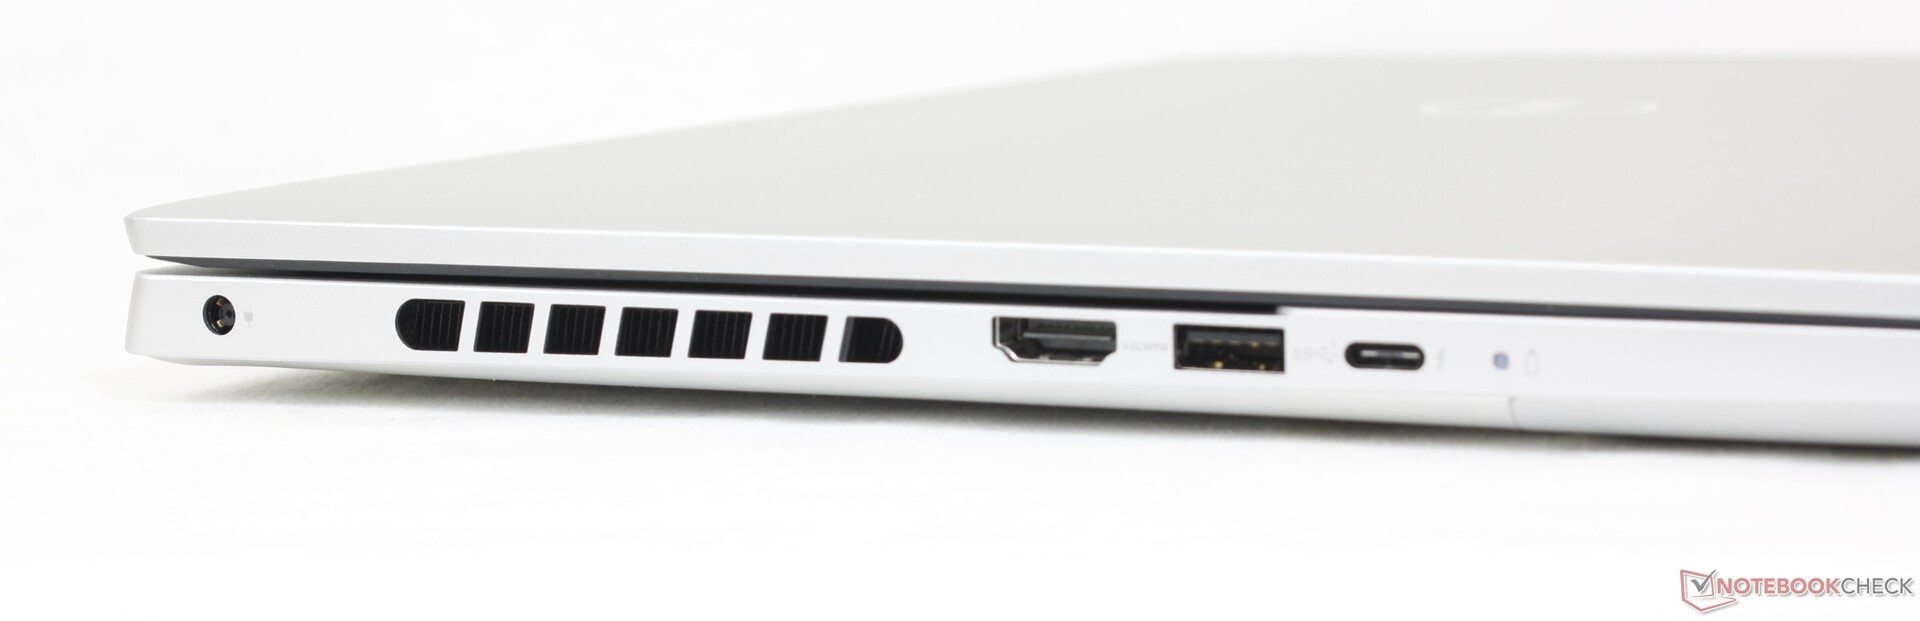
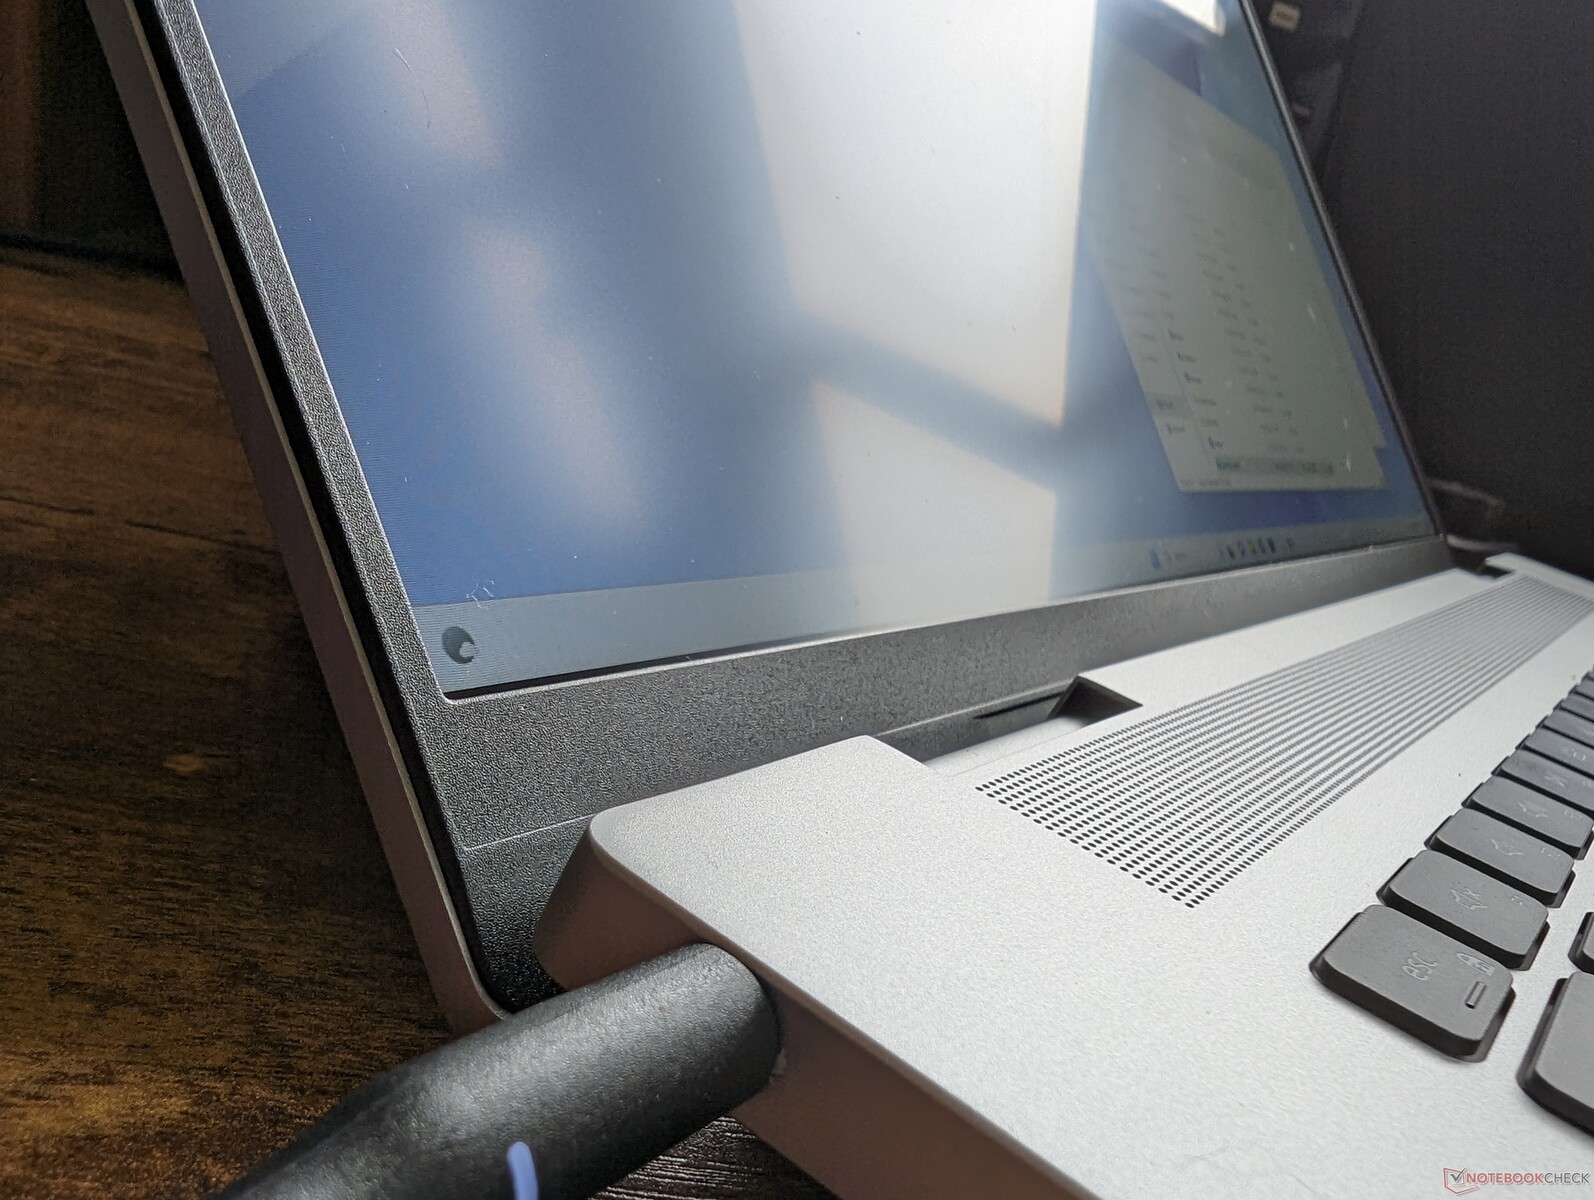
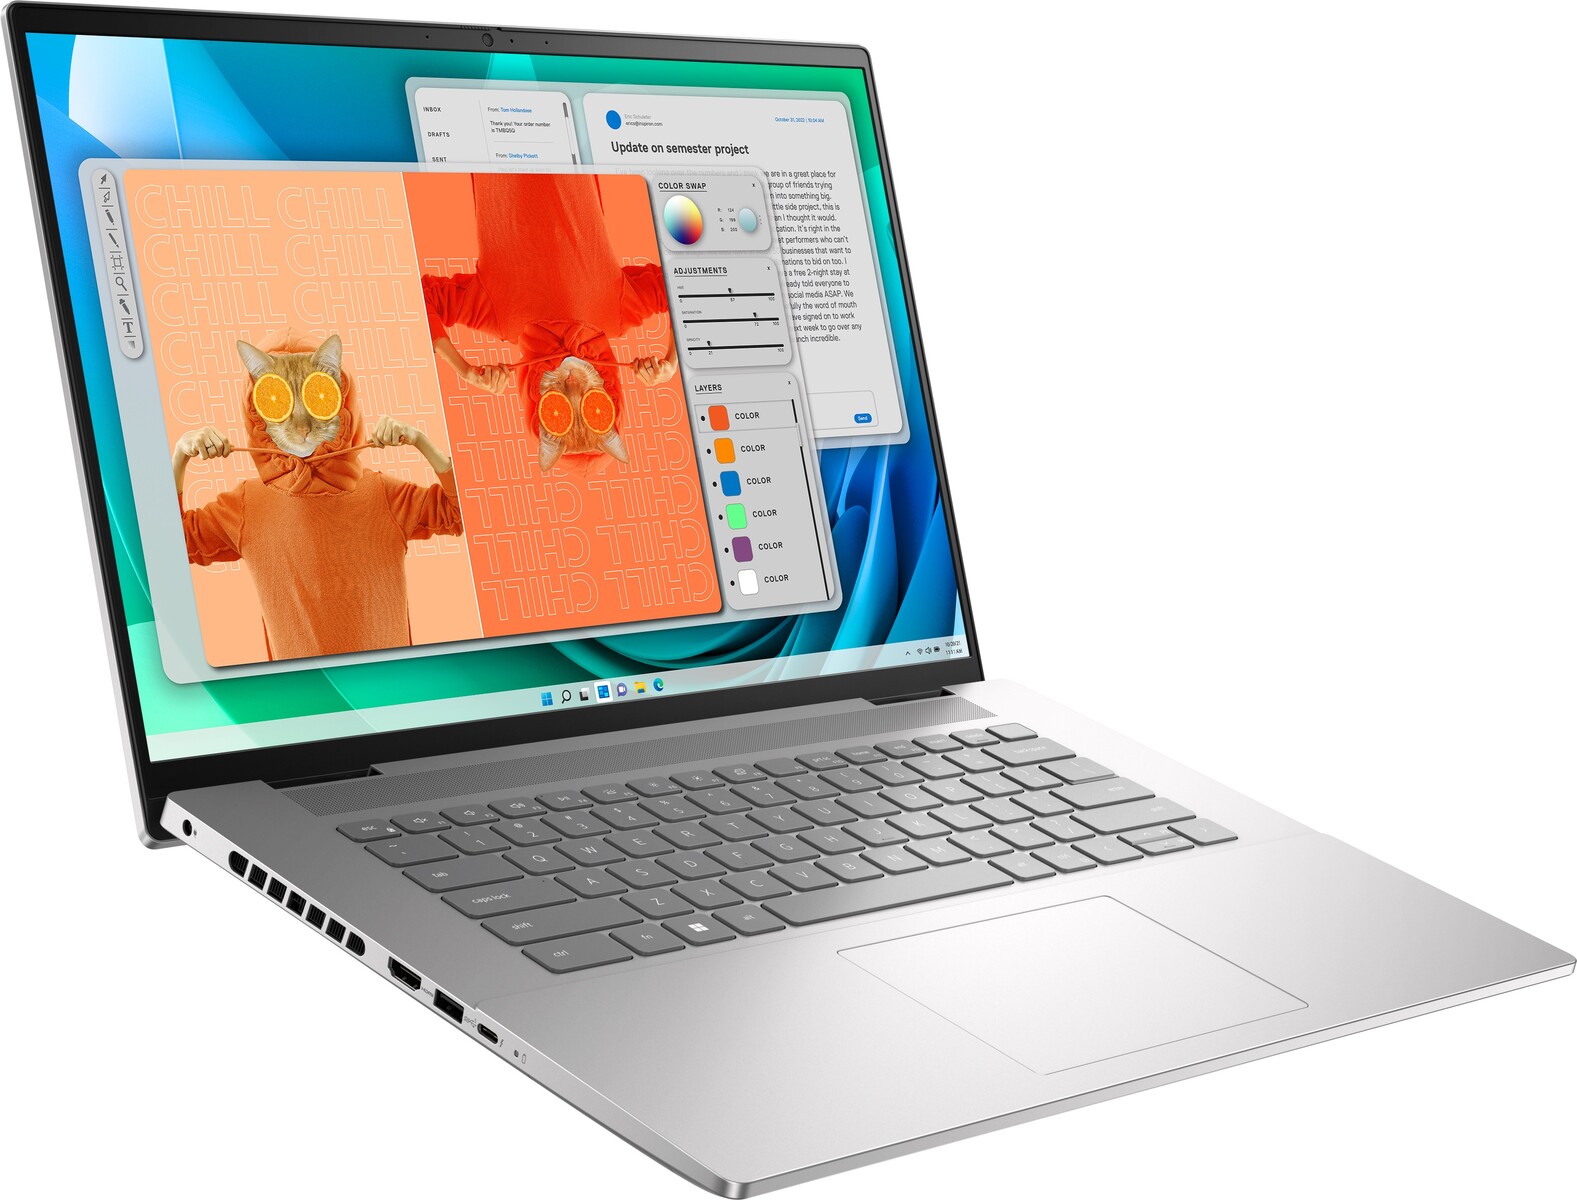
Inspiron 16 Plus 7630 несет пару отличий от прошлогодней модели. Шарниры стали прочнее и надежнее, на боковых сторонах появились дополнительные вентиляционные решетки для улучшения охлаждения и производитель также отказался от майларового палмреста (точно так же и у Inspiron 16 Plus 7635 2-in-1). Первые названные модификации помогут улучшить долговечность ноутбука, а вот третья, вероятно, обусловлена экономией.
В плане прочности корпус примерно такой же, как у Inspiron 16 Plus 7620, так как выполнен из тех же материалов. Подобно Envy 16 ноутбук ощущается крепким в целом, но крышка более гибкая, так как для защиты экрана не используется стекло Gorilla Glass.
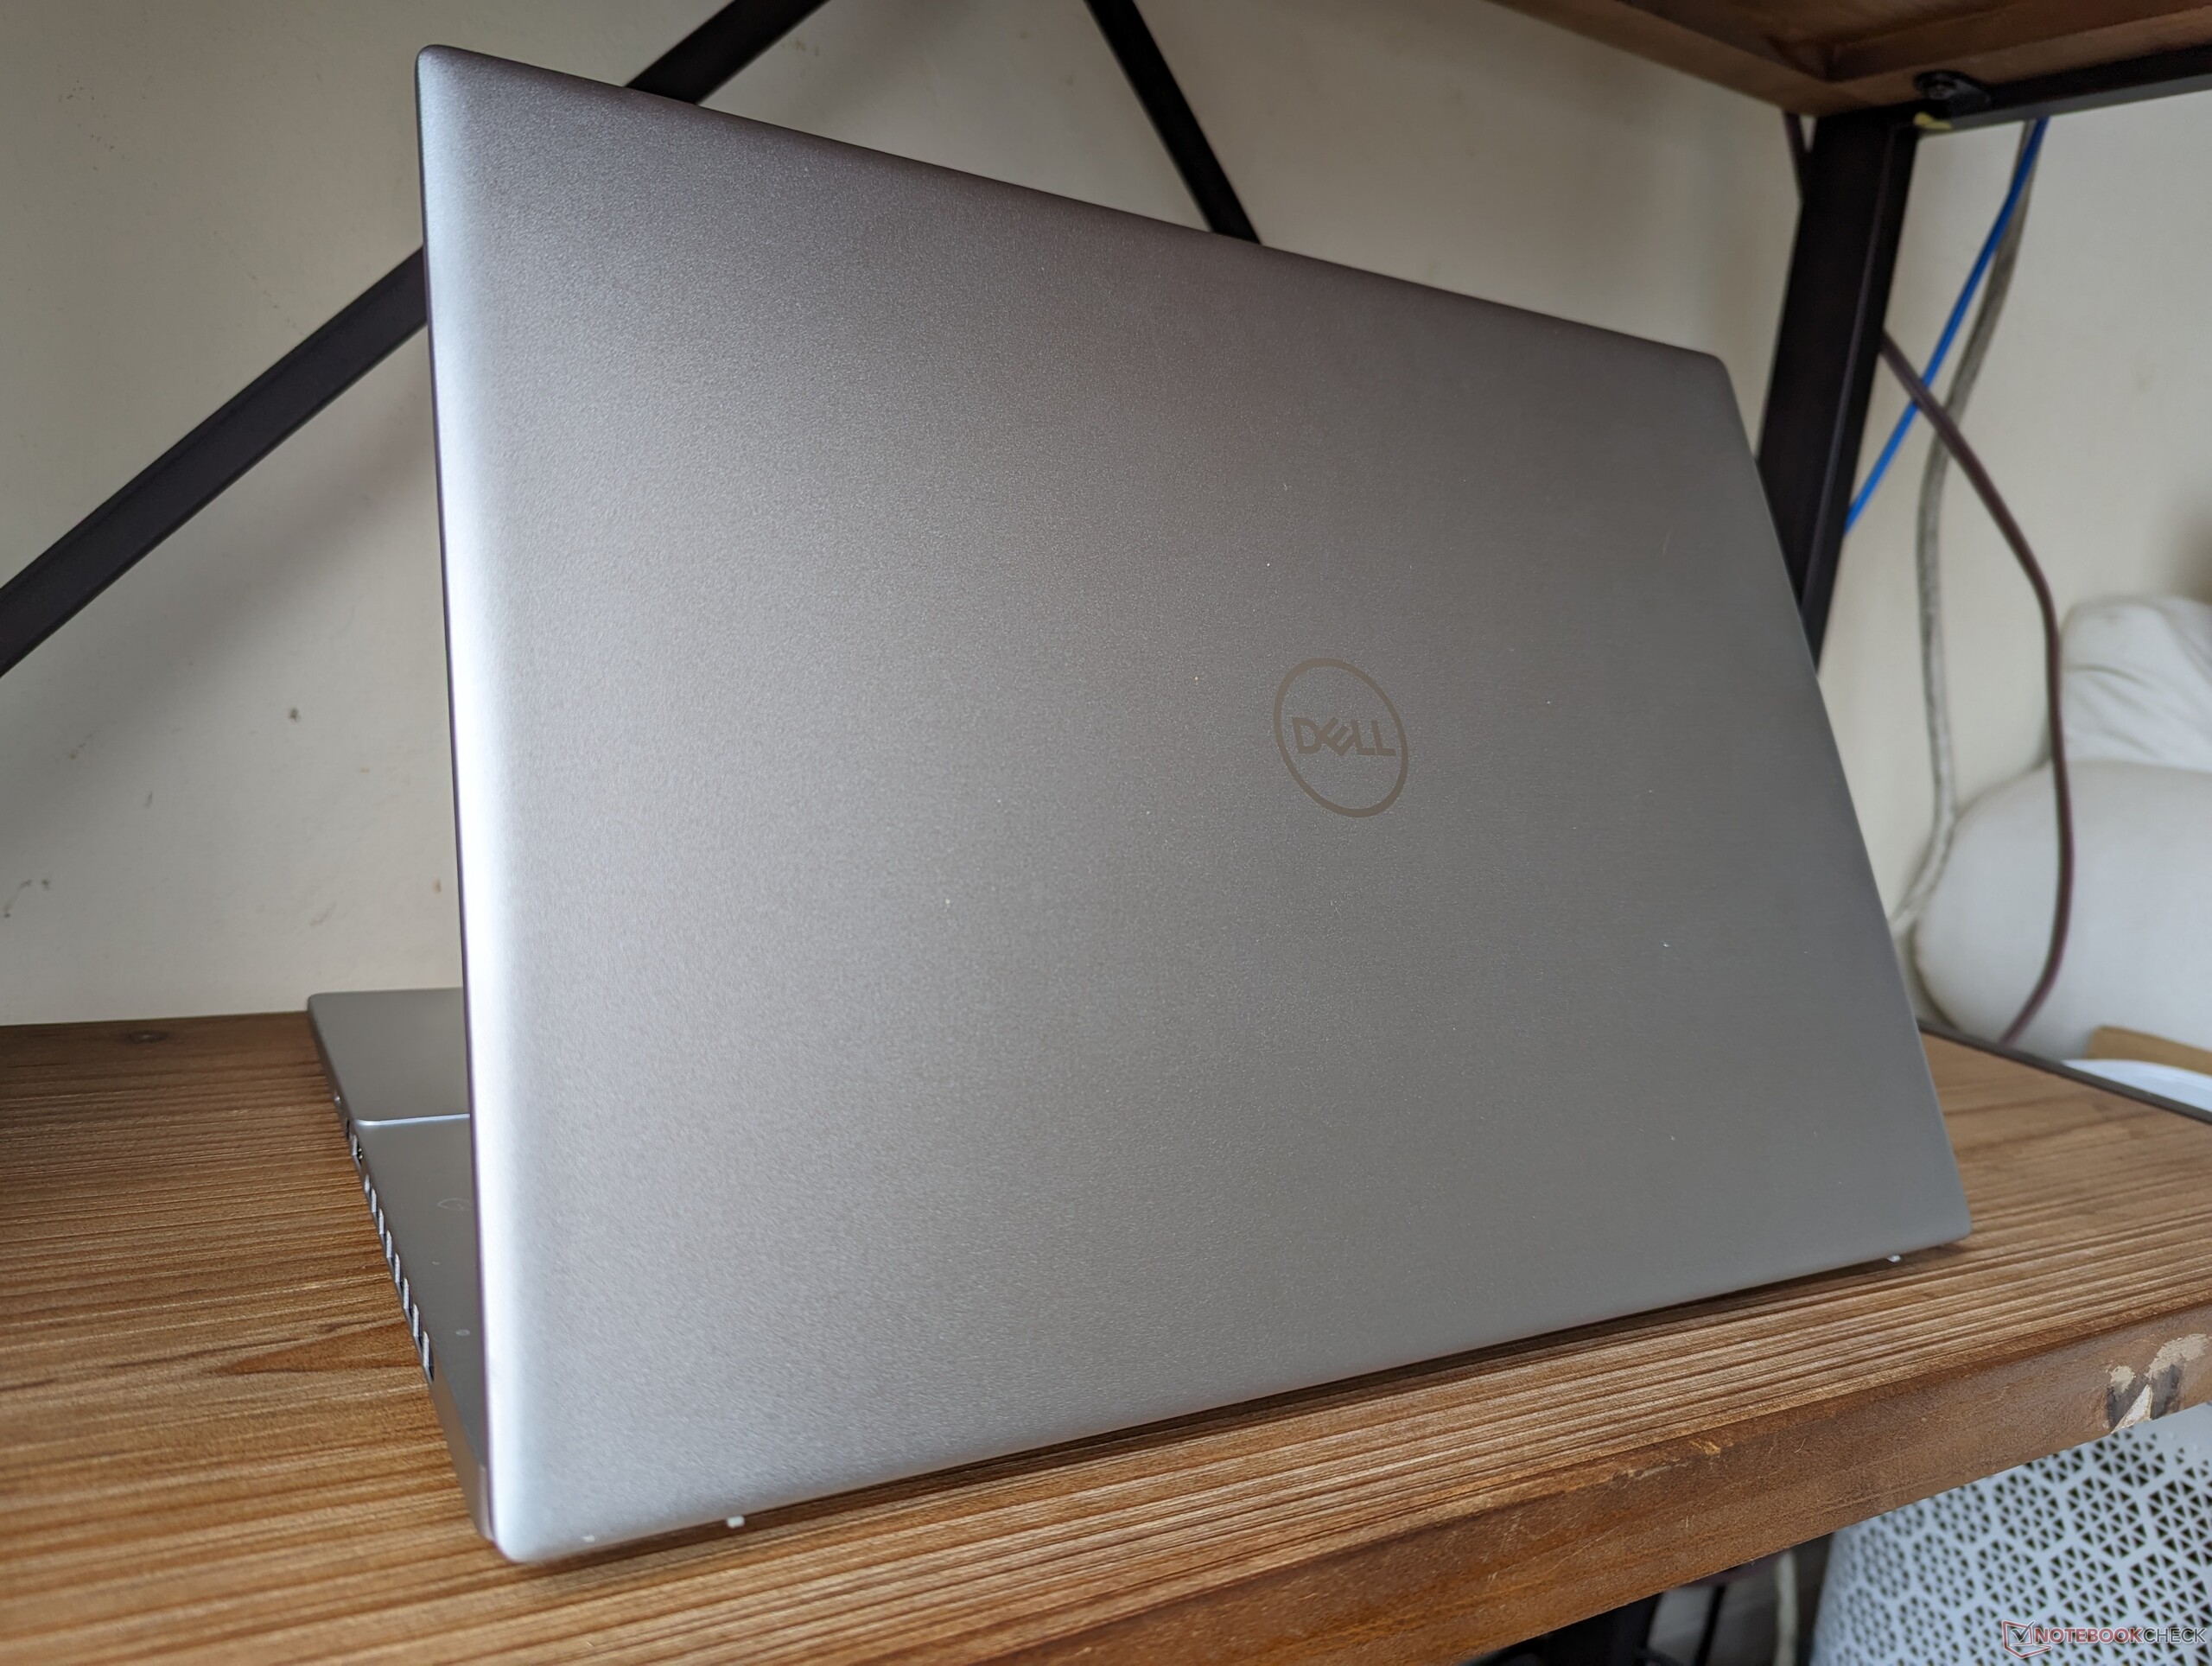
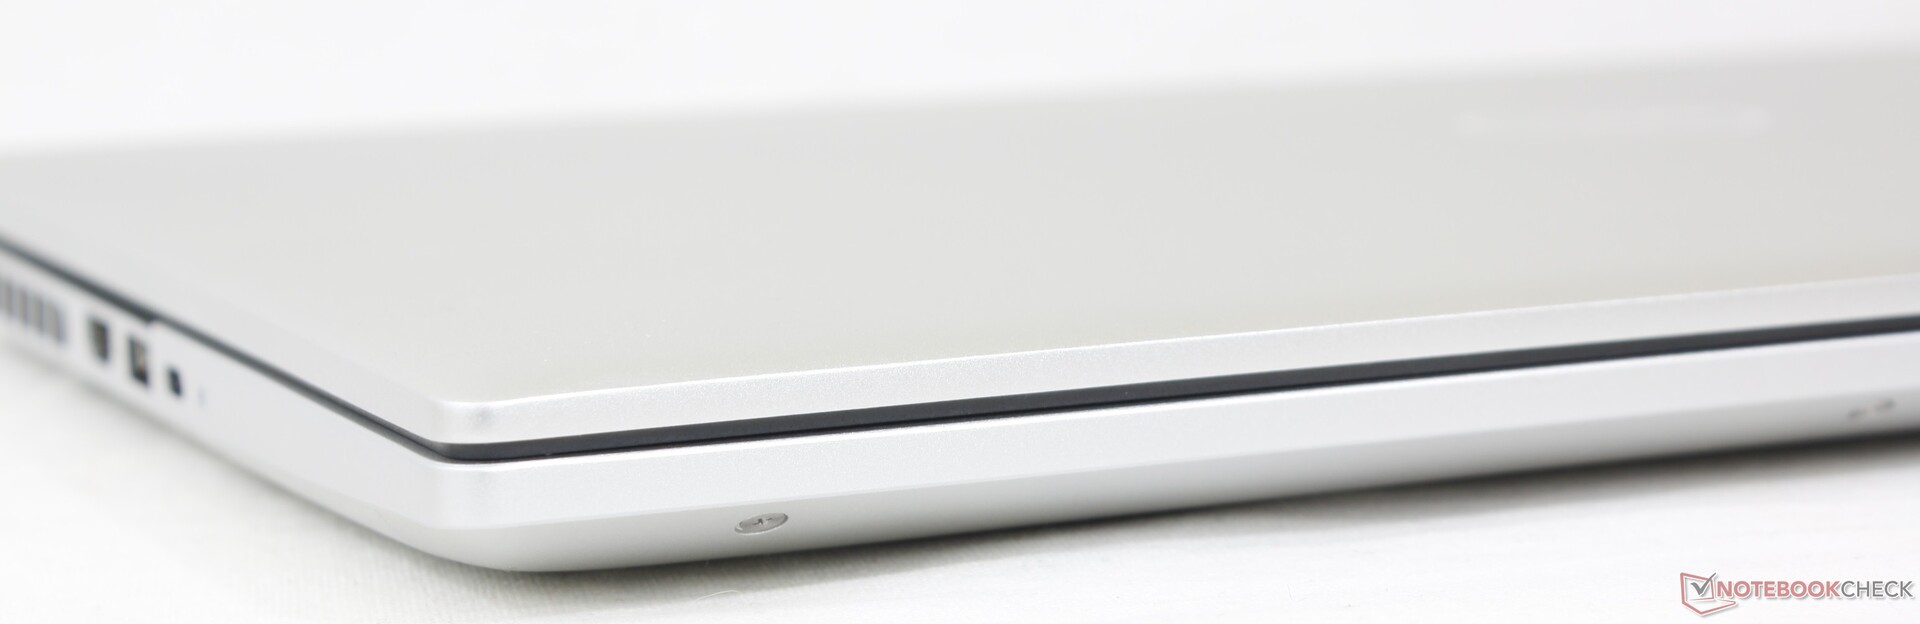
Габариты такие же, как у прошлогодней модели, а вес больше всего на 100 граммов. Легким Dell назвать нельзя, однако в этом плане он аналогичен Slim Pro 9i 16 и Envy 16.
Оснащение
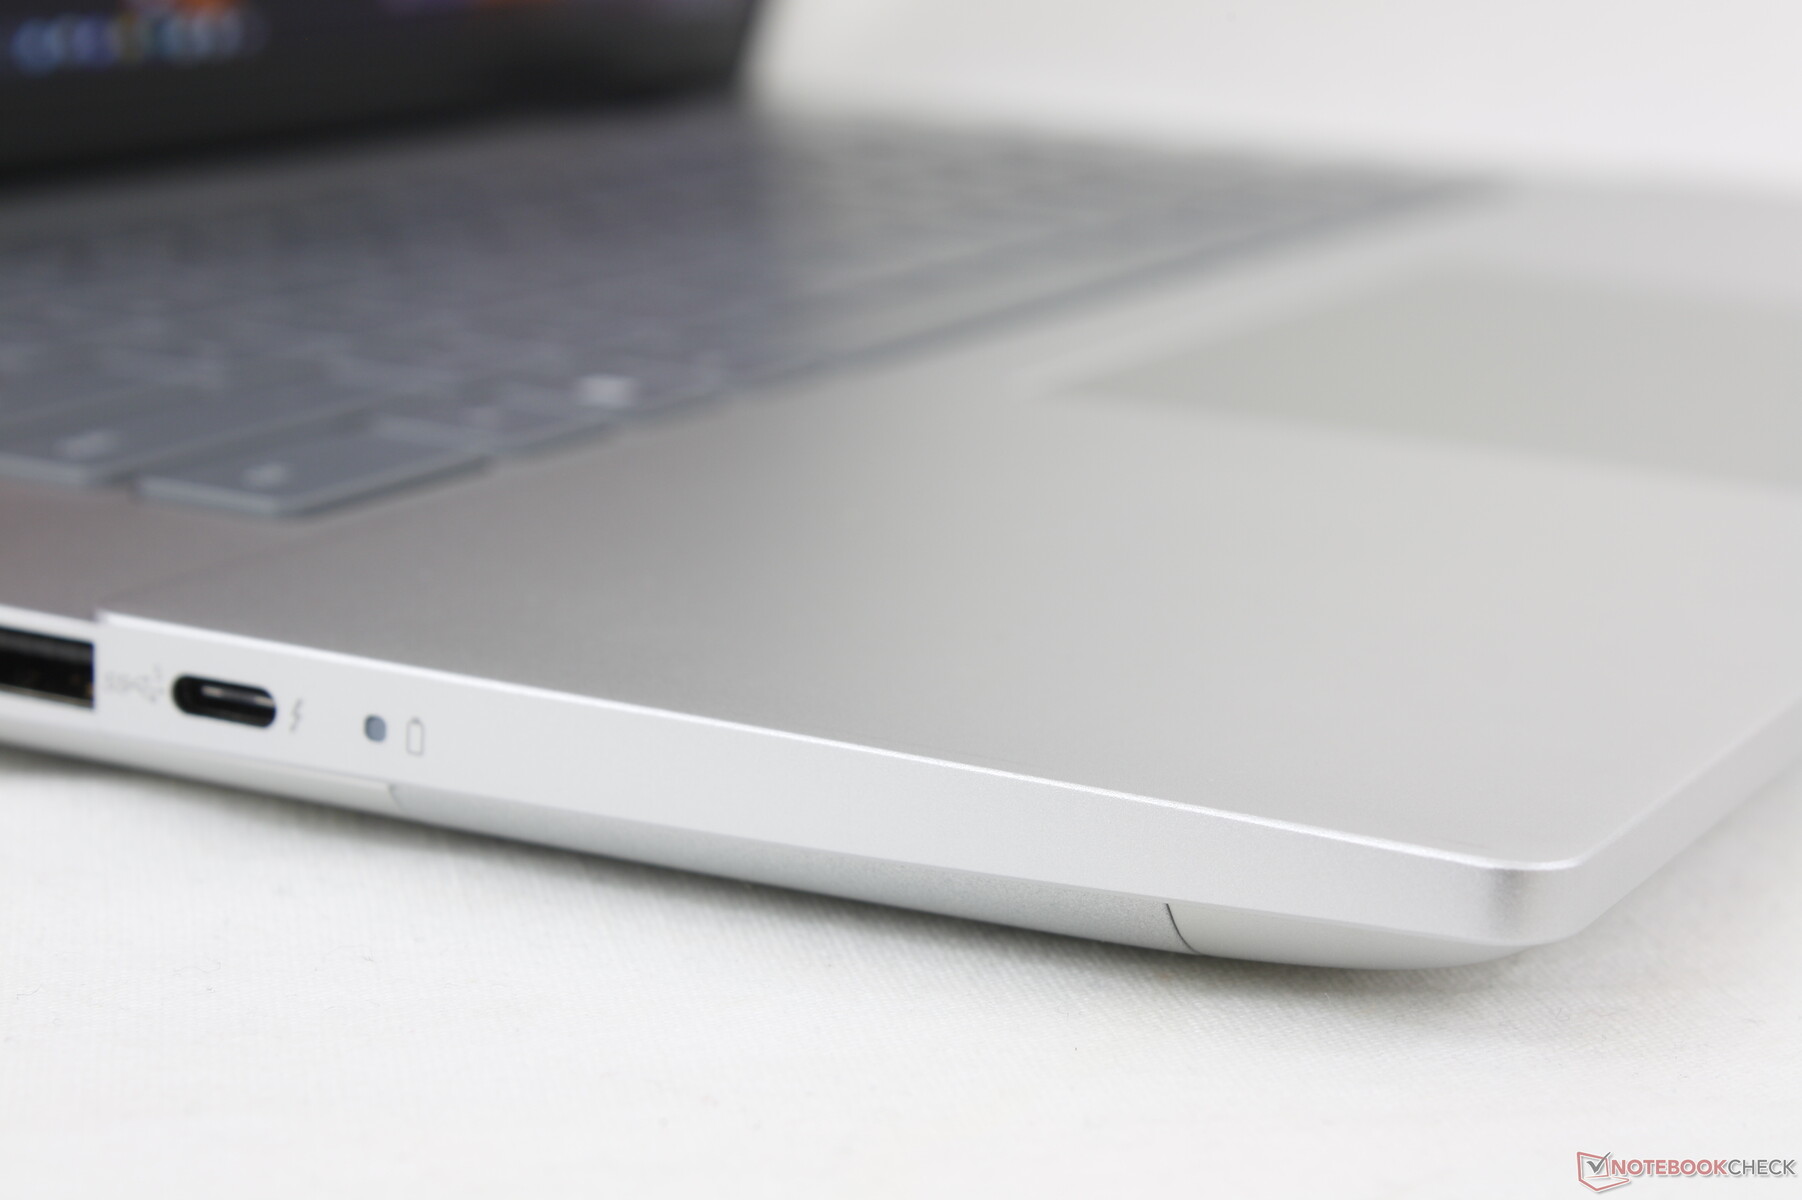
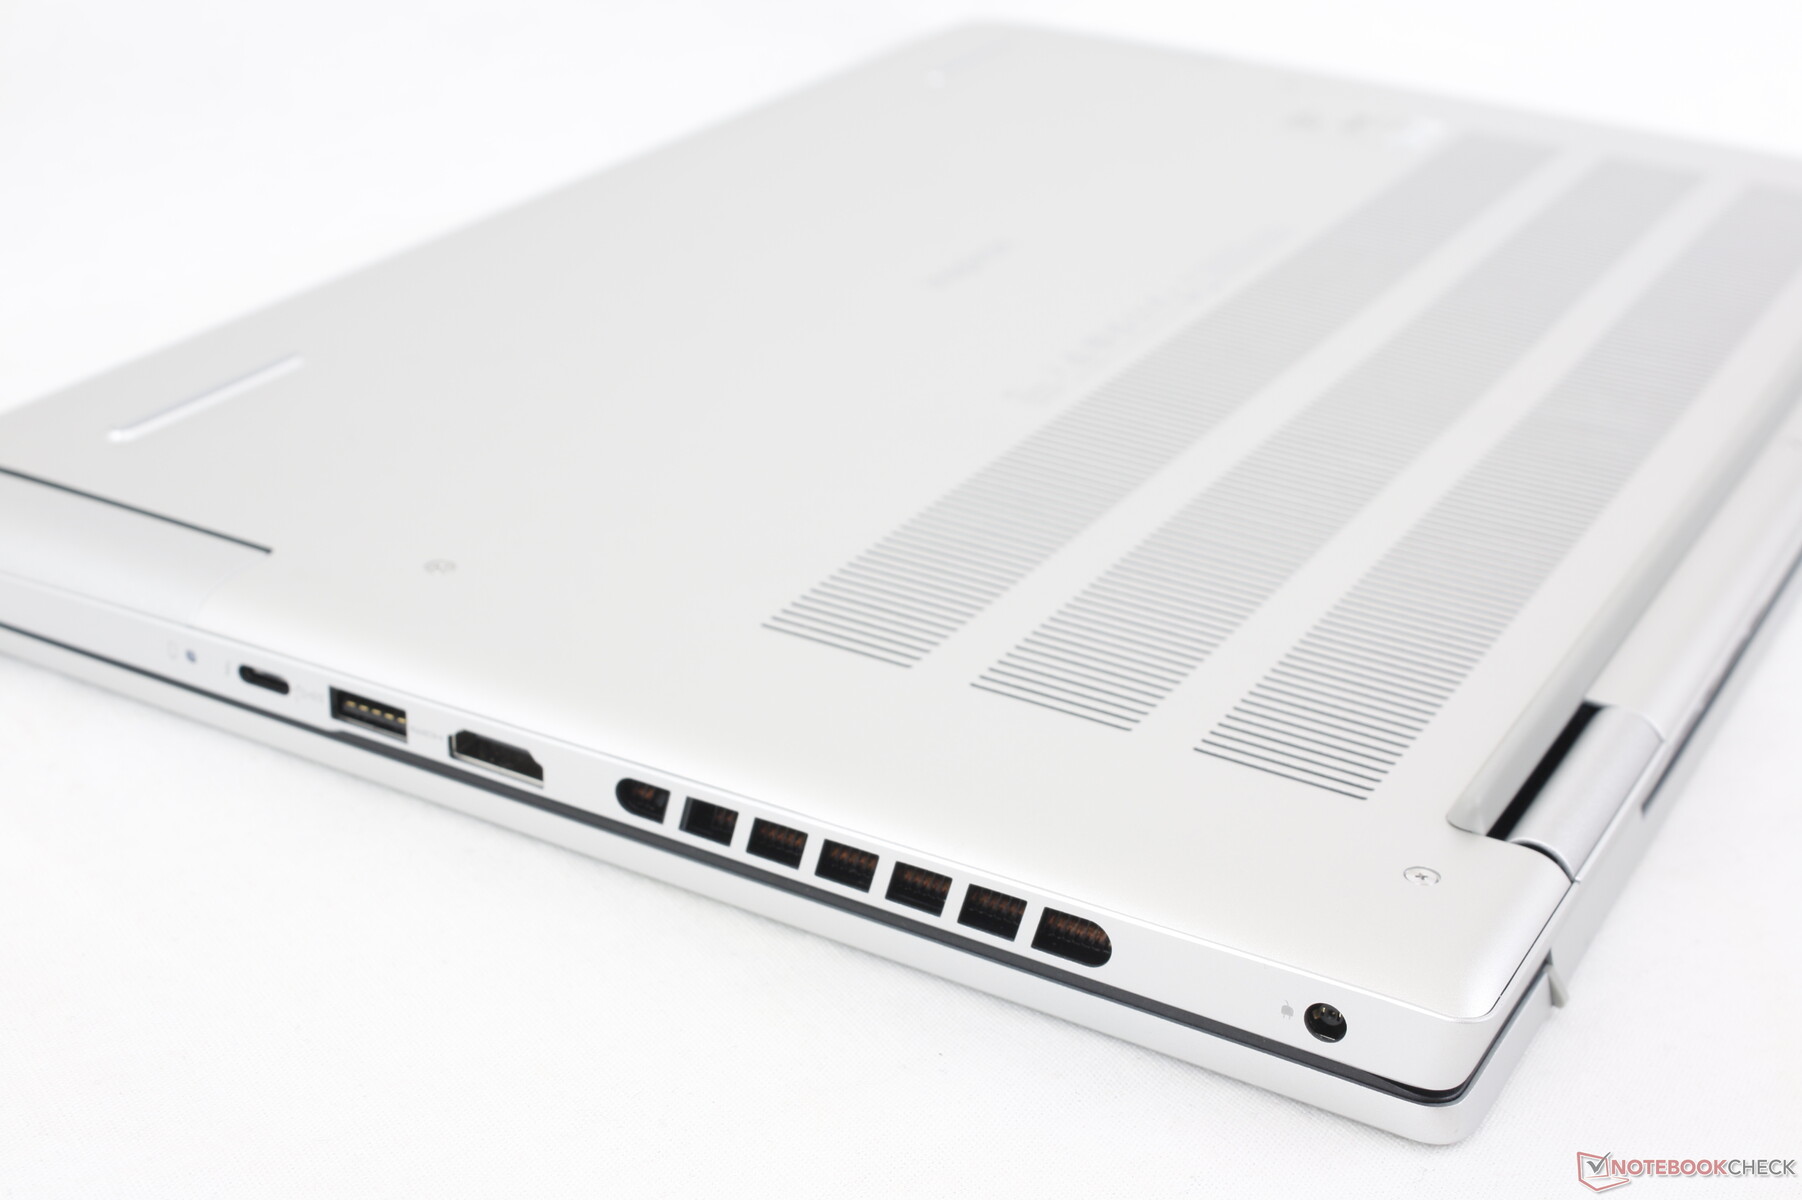
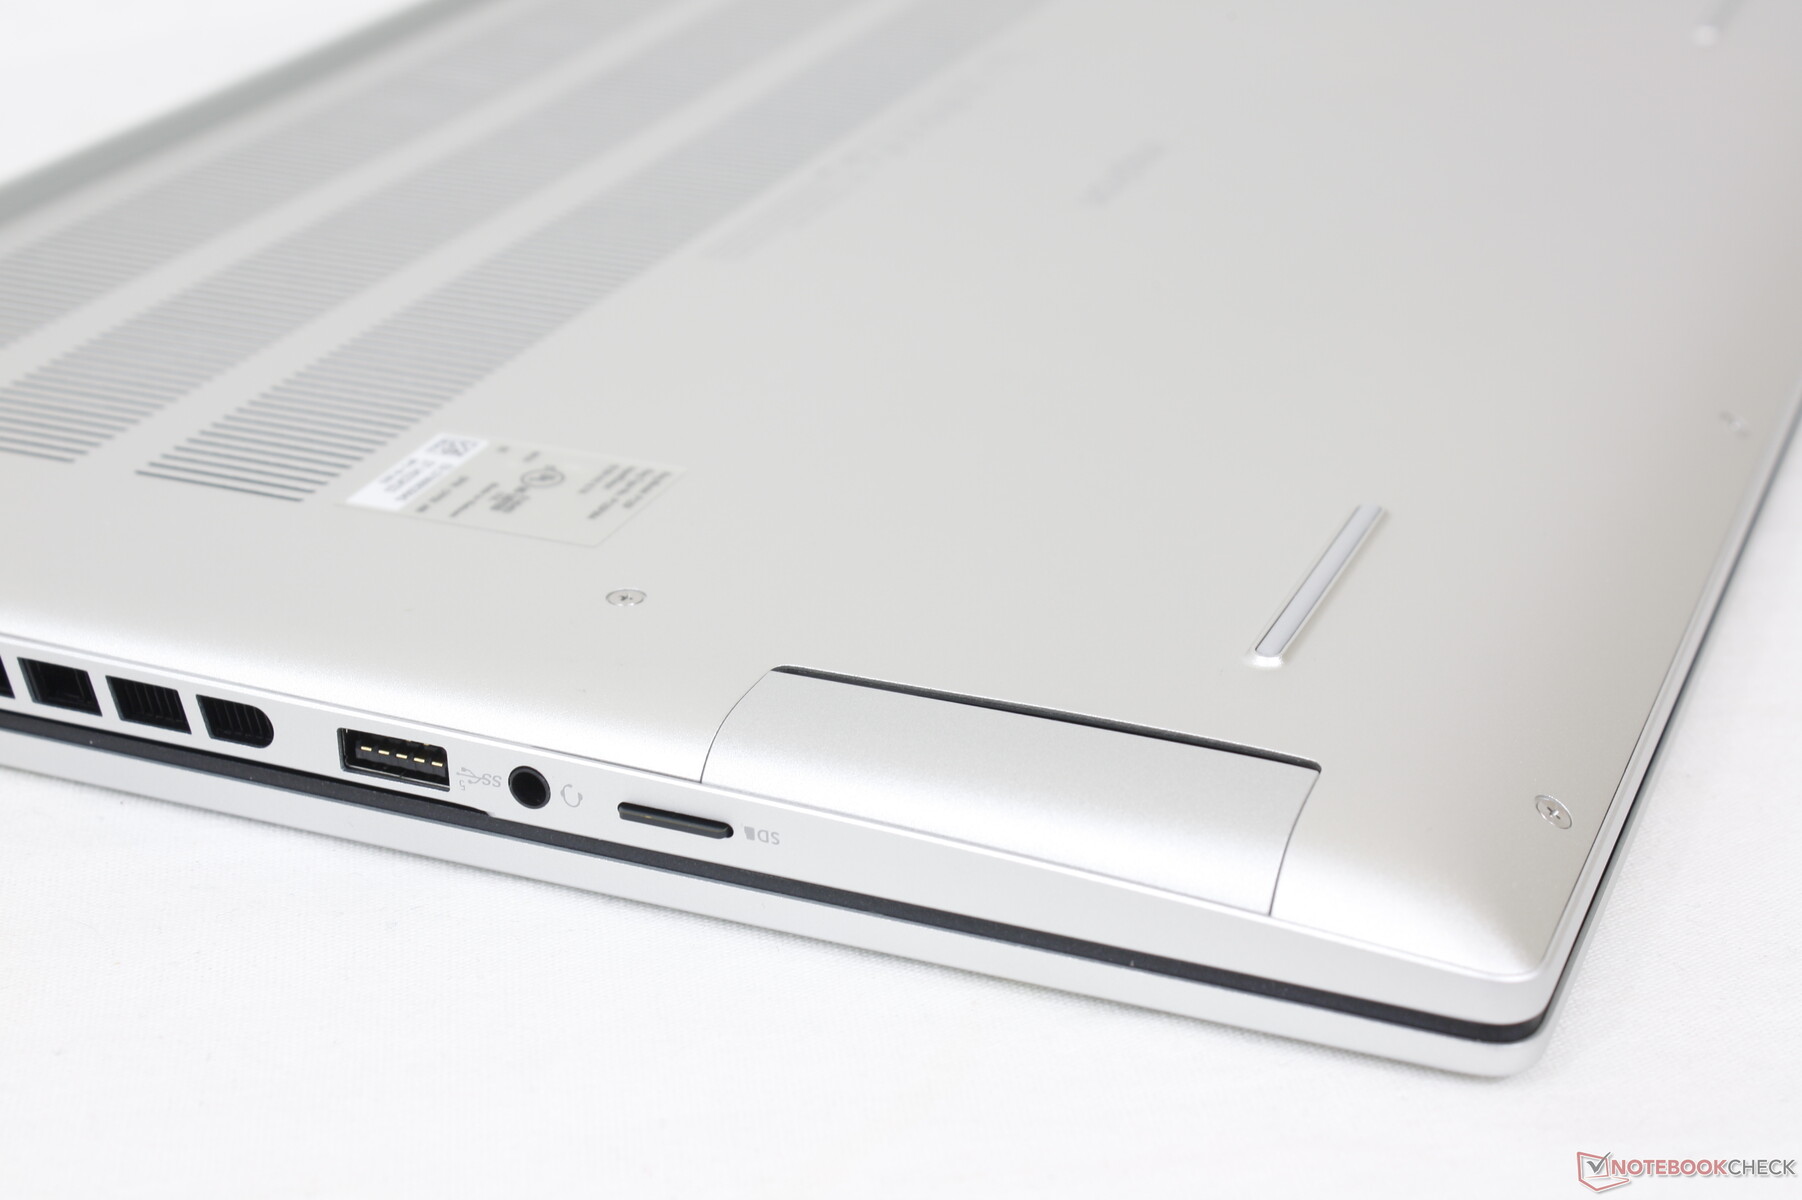
Расположение и набор портов как у прошлогодней модели, со всего одним отличием: вместо полноразмерного SD картридера теперь установлен слот microSD. Для сравнения, у конкурентов, таких как Envy 16 и VivoBook Pro 16X, имеется больше портов USB-C, а также установлен полноразмерные картридеры.
Также хотелось бы увидеть как Inspiron наконец избавляется от проприетарного разъема питания в пользу современного и универсального USB-C, как это сделано в XPS 15 и XPS 17.
Картридер
Если у XPS установлены одни из самых быстрых картридеров, у Inspiron обычно одни из самых медленных. Копирование 1 ГБ картинок с референсной карты памяти стандарта UHS-II на рабочий стол занимает 50 секунд, тогда как у XPS 15/17 на это уходит всего 5-6 секунд.
| SD Card Reader | |
| average JPG Copy Test (av. of 3 runs) | |
| MSI Summit E16 Flip A12UDT-031 (AV Pro SD microSD 128 GB V60) | |
| Asus Vivobook Pro 16X K6604JV-MX016W | |
| Lenovo Slim Pro 9i 16IRP8 (PNY EliteX-Pro60 V60 256 GB) | |
| HP Envy 16 h0112nr (AV Pro SD microSD 128 GB V60) | |
| Dell Inspiron 16 Plus 7620 (Toshiba Exceria Pro SDXC 64 GB UHS-II) | |
| Dell Inspiron 16 Plus 7630 (AV Pro SD microSD 128 GB V60) | |
| maximum AS SSD Seq Read Test (1GB) | |
| MSI Summit E16 Flip A12UDT-031 (AV Pro SD microSD 128 GB V60) | |
| Asus Vivobook Pro 16X K6604JV-MX016W | |
| Lenovo Slim Pro 9i 16IRP8 (PNY EliteX-Pro60 V60 256 GB) | |
| HP Envy 16 h0112nr (AV Pro SD microSD 128 GB V60) | |
| Dell Inspiron 16 Plus 7620 (Toshiba Exceria Pro SDXC 64 GB UHS-II) | |
| Dell Inspiron 16 Plus 7630 (AV Pro SD microSD 128 GB V60) | |
Связь
Адаптер Intel AX211 отвечает за поддержку Wi-Fi 6E и Bluetooth 5.3. Скорость соединения в паре с роутером Asus AXE11000 была стабильной и высокой в 6-ГГц сети.
Отметим, что в модели на AMD будет установлен адаптер от MediaTek.
Веб-камера
Веб-камера на 2 МП уже стала стандартом для многих ноутбуков. В более дорогих ноутбуках HP уже используются сенсоры на 5 и даже 8 МП.
Механическая шторка приватности у Inspiron есть, но ИК-камера отсутствует.


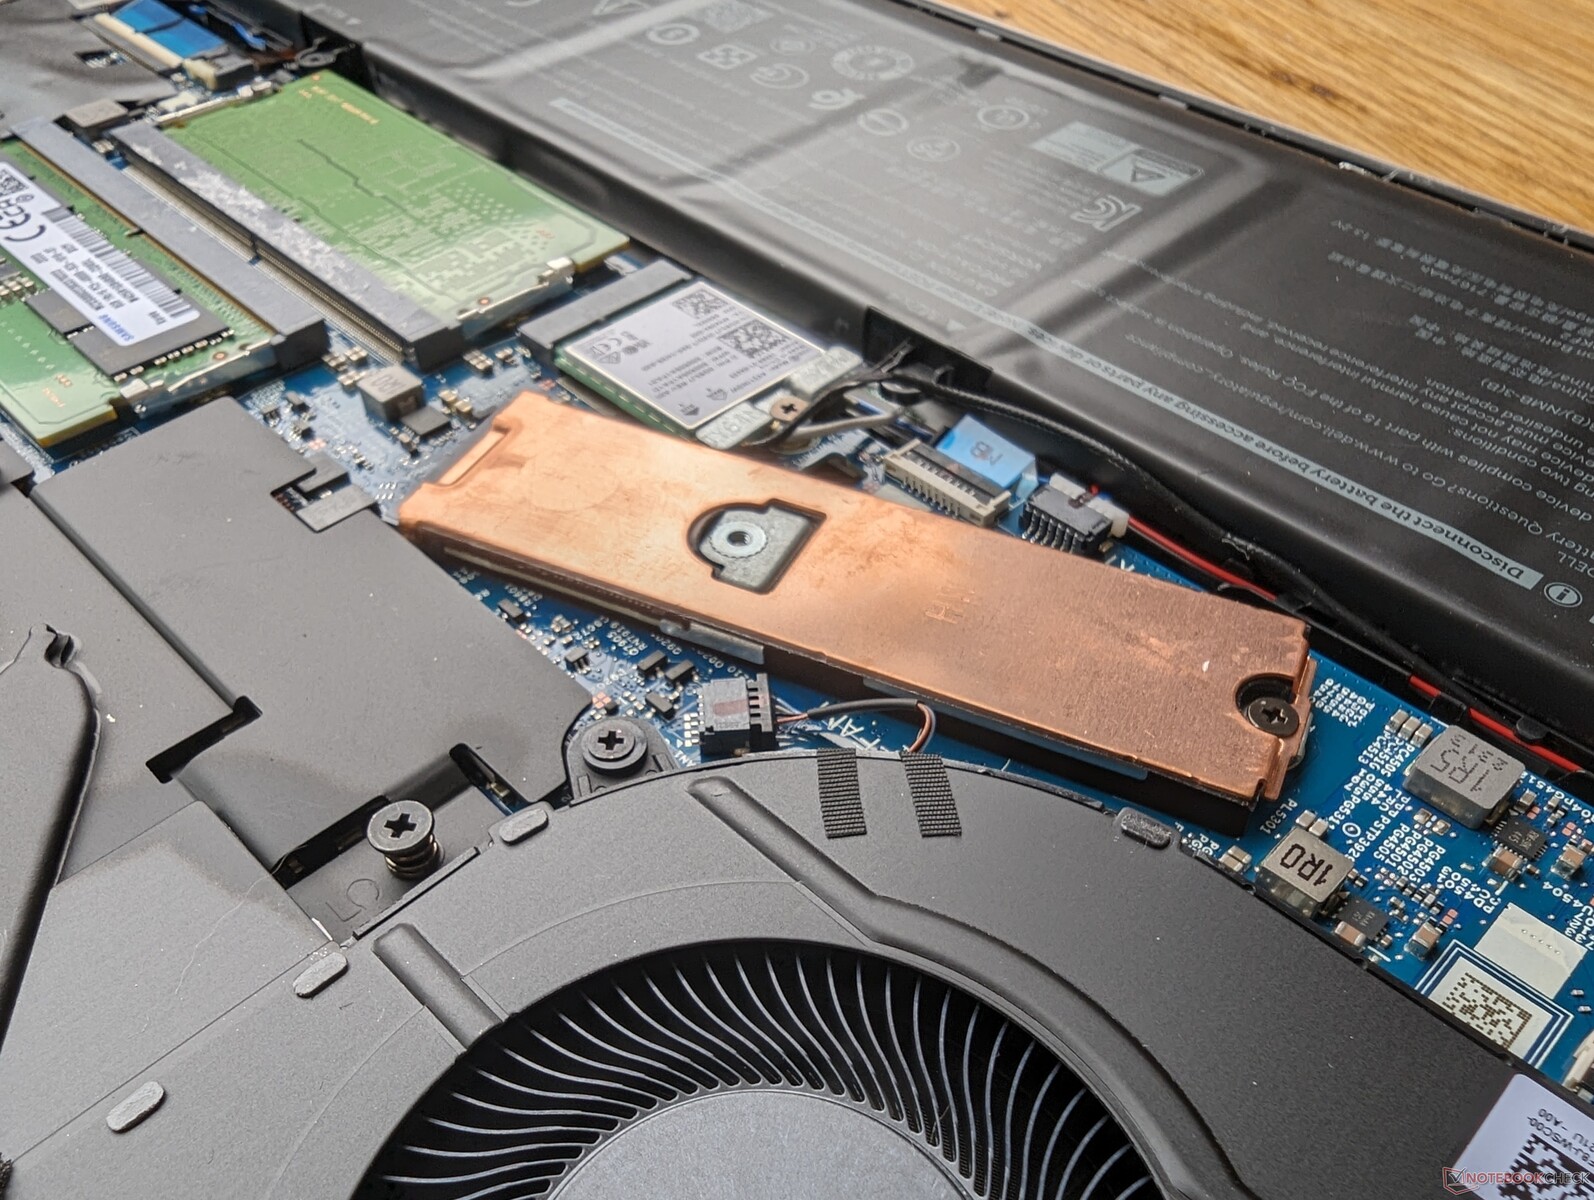
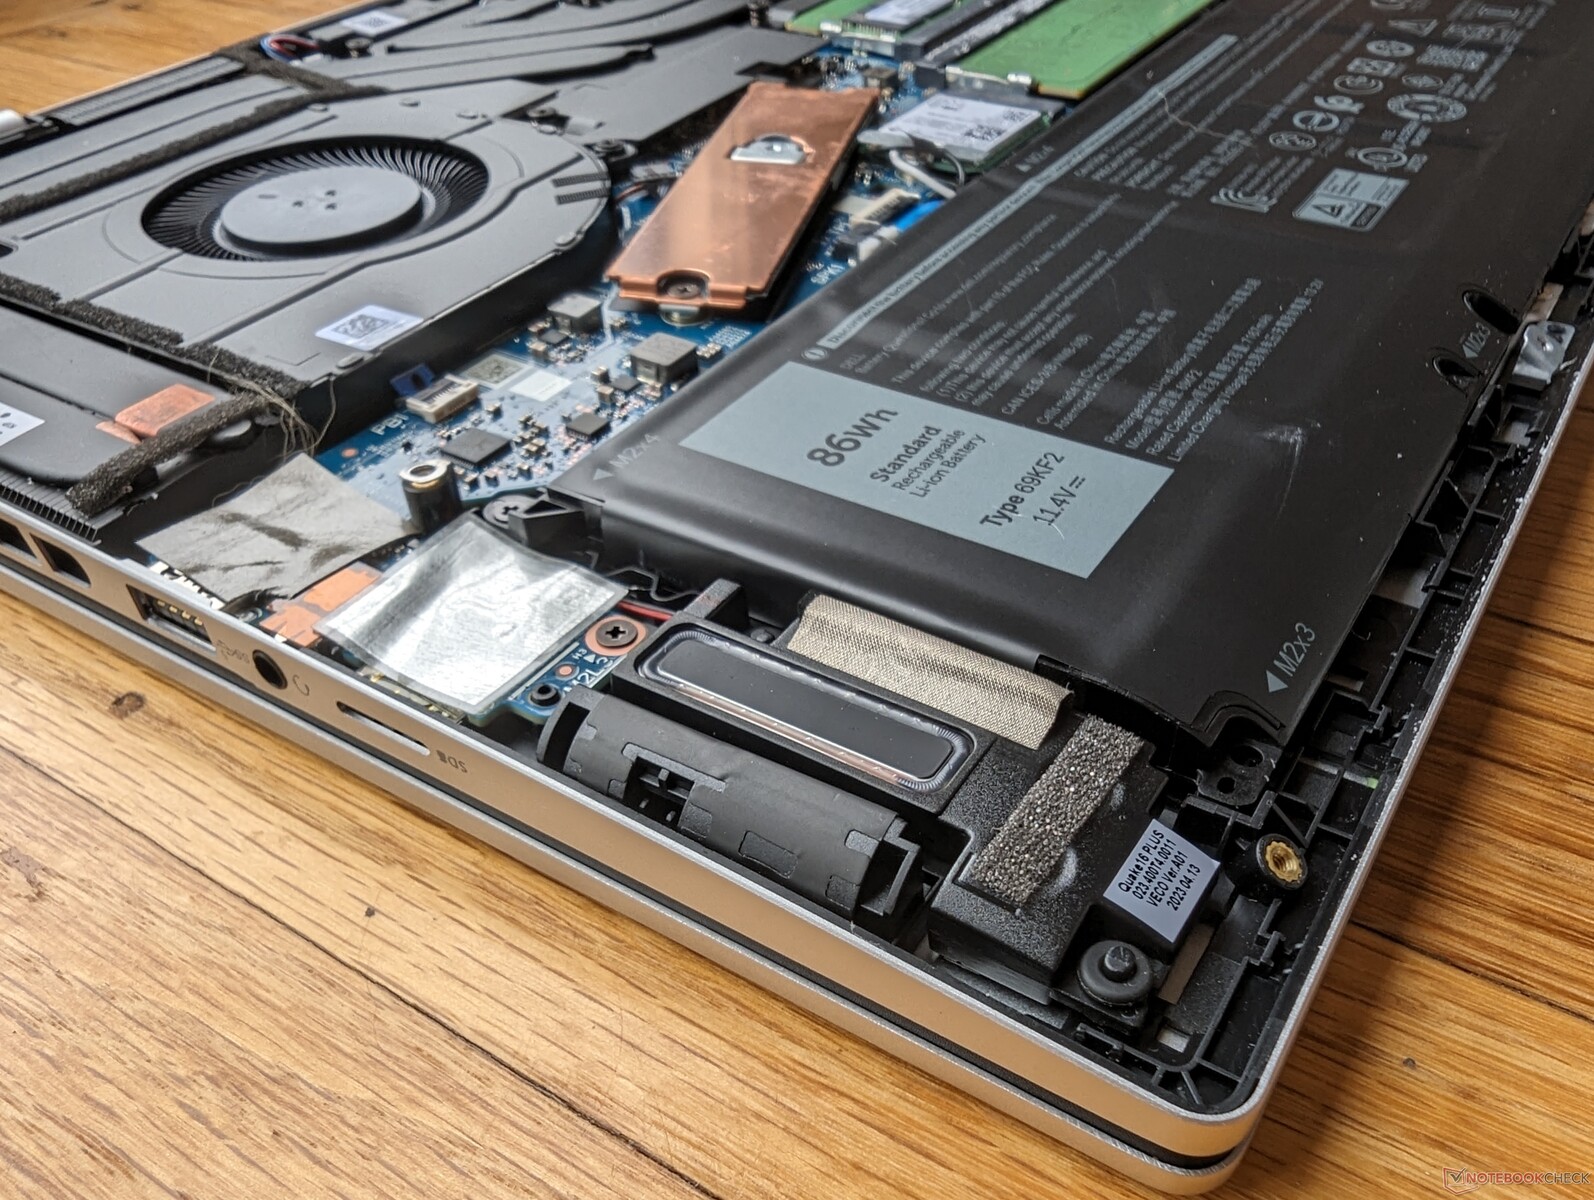
Обслуживание
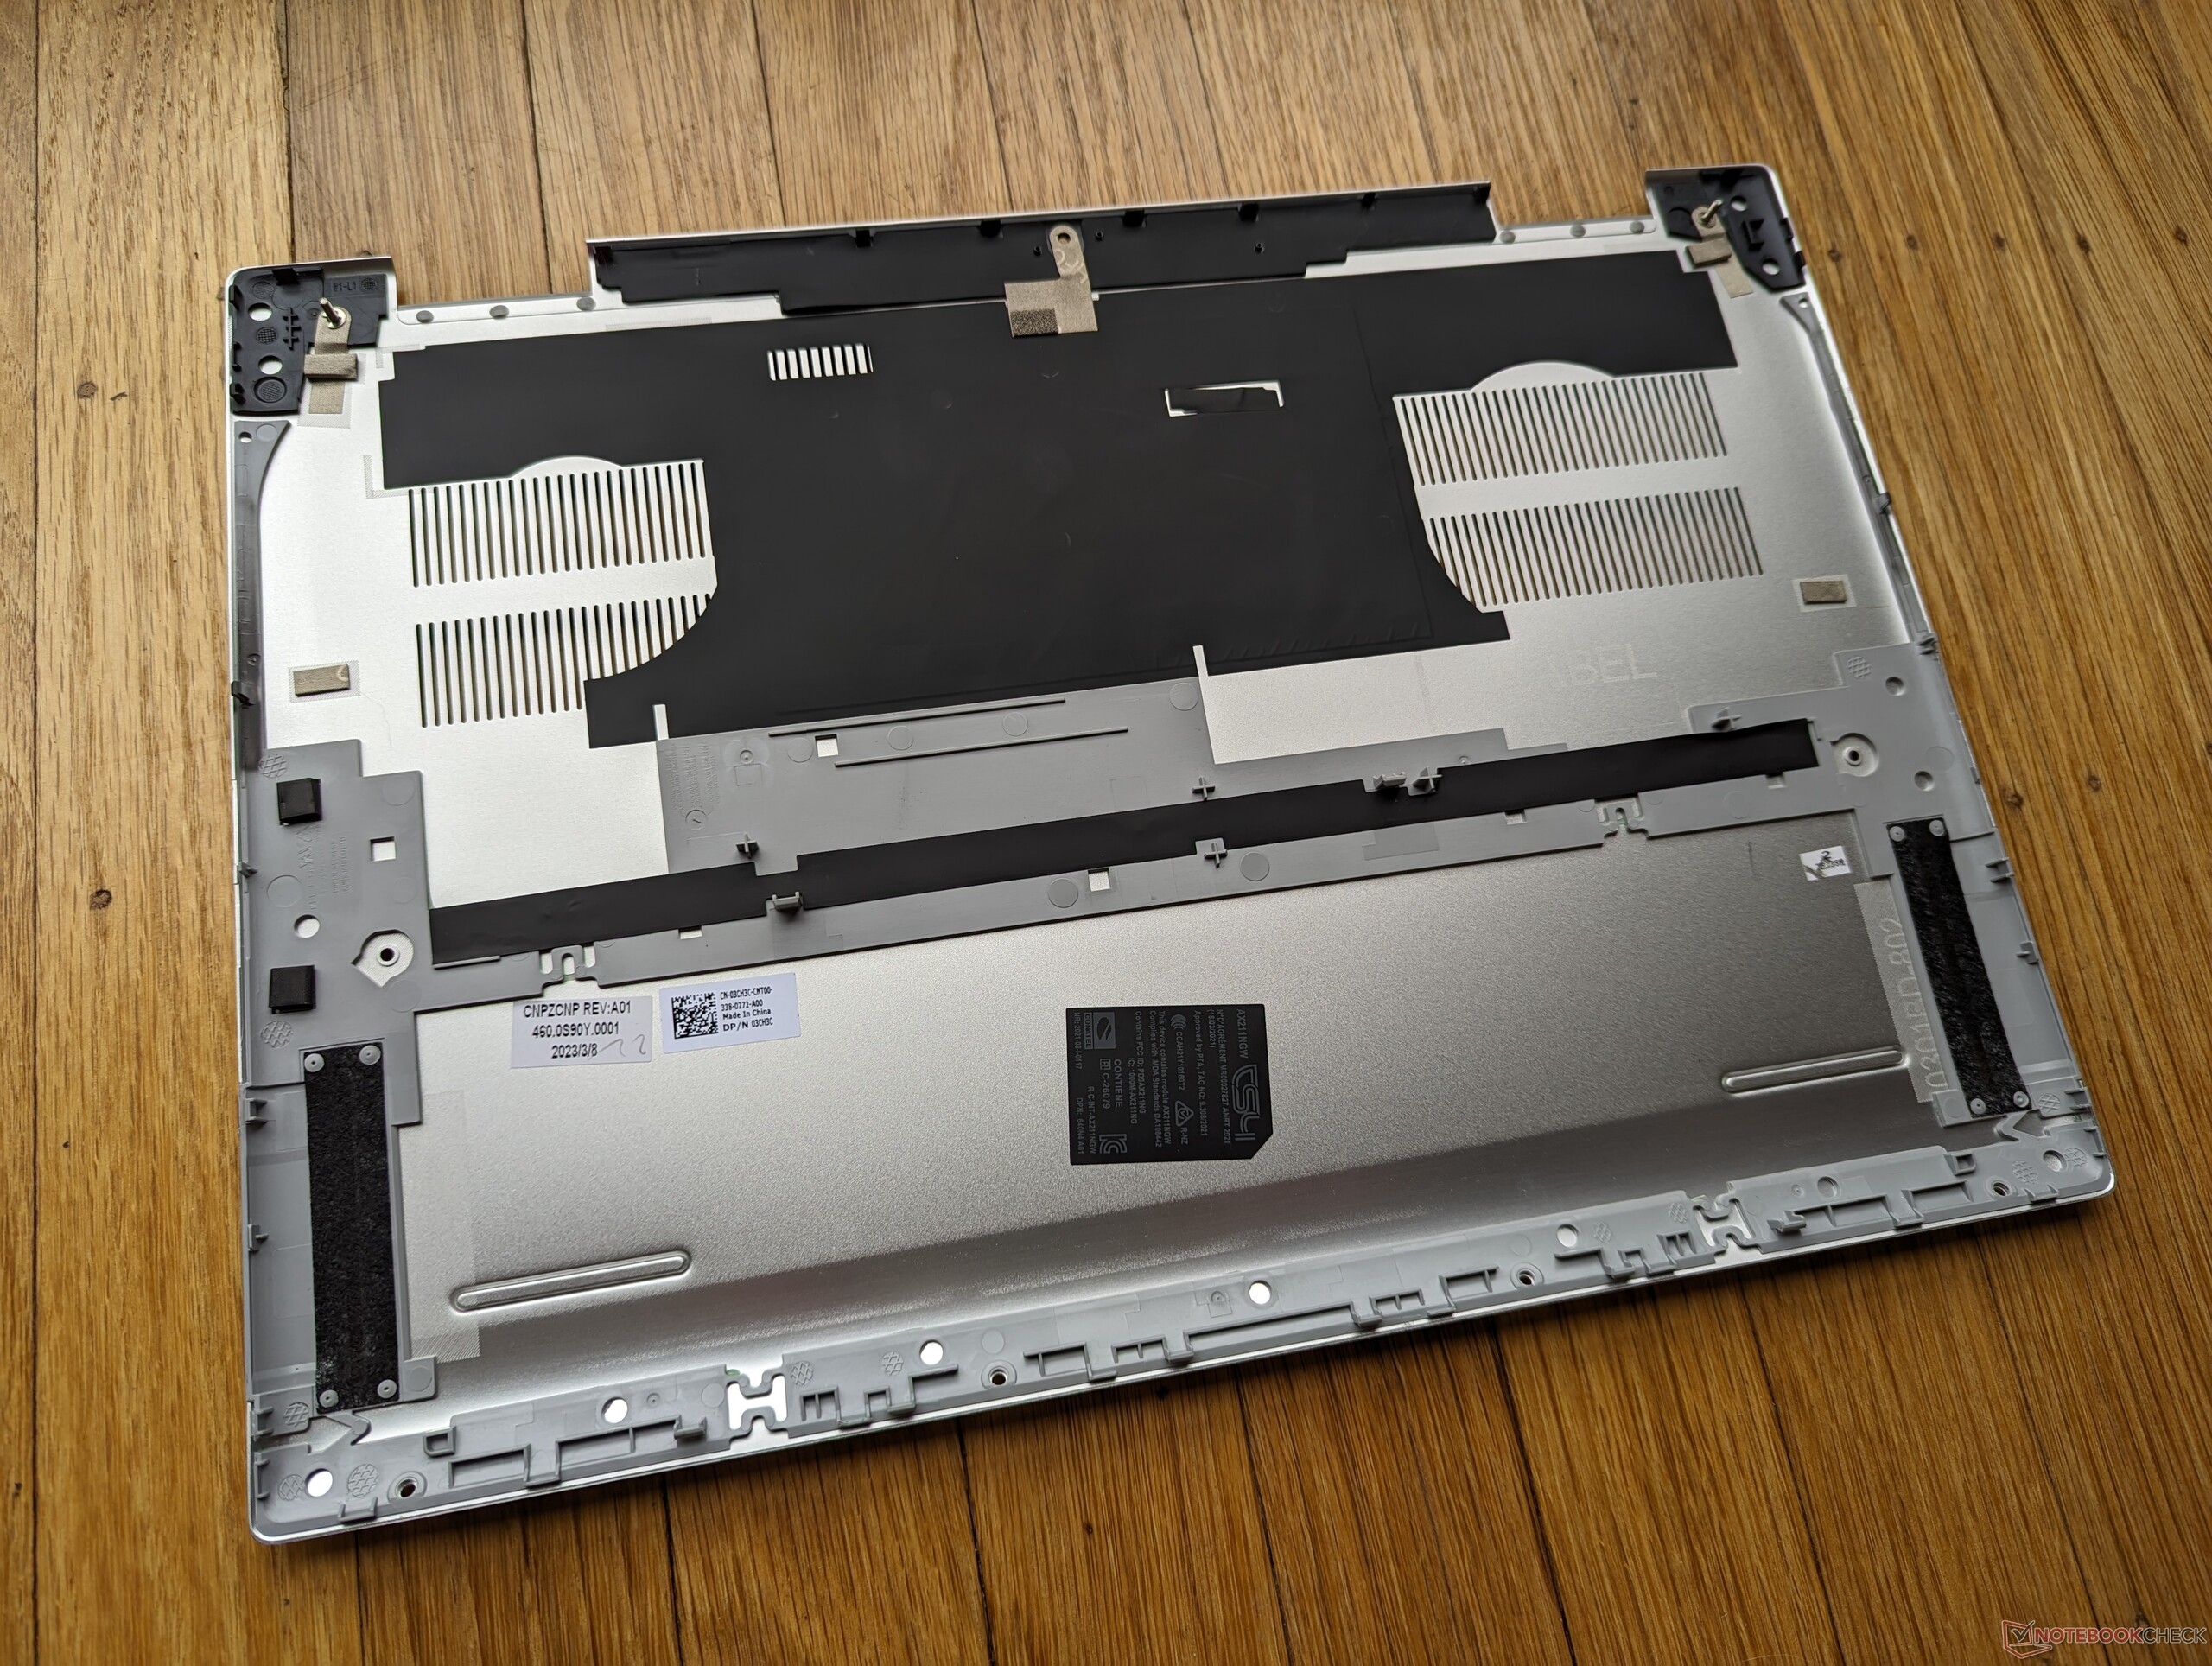
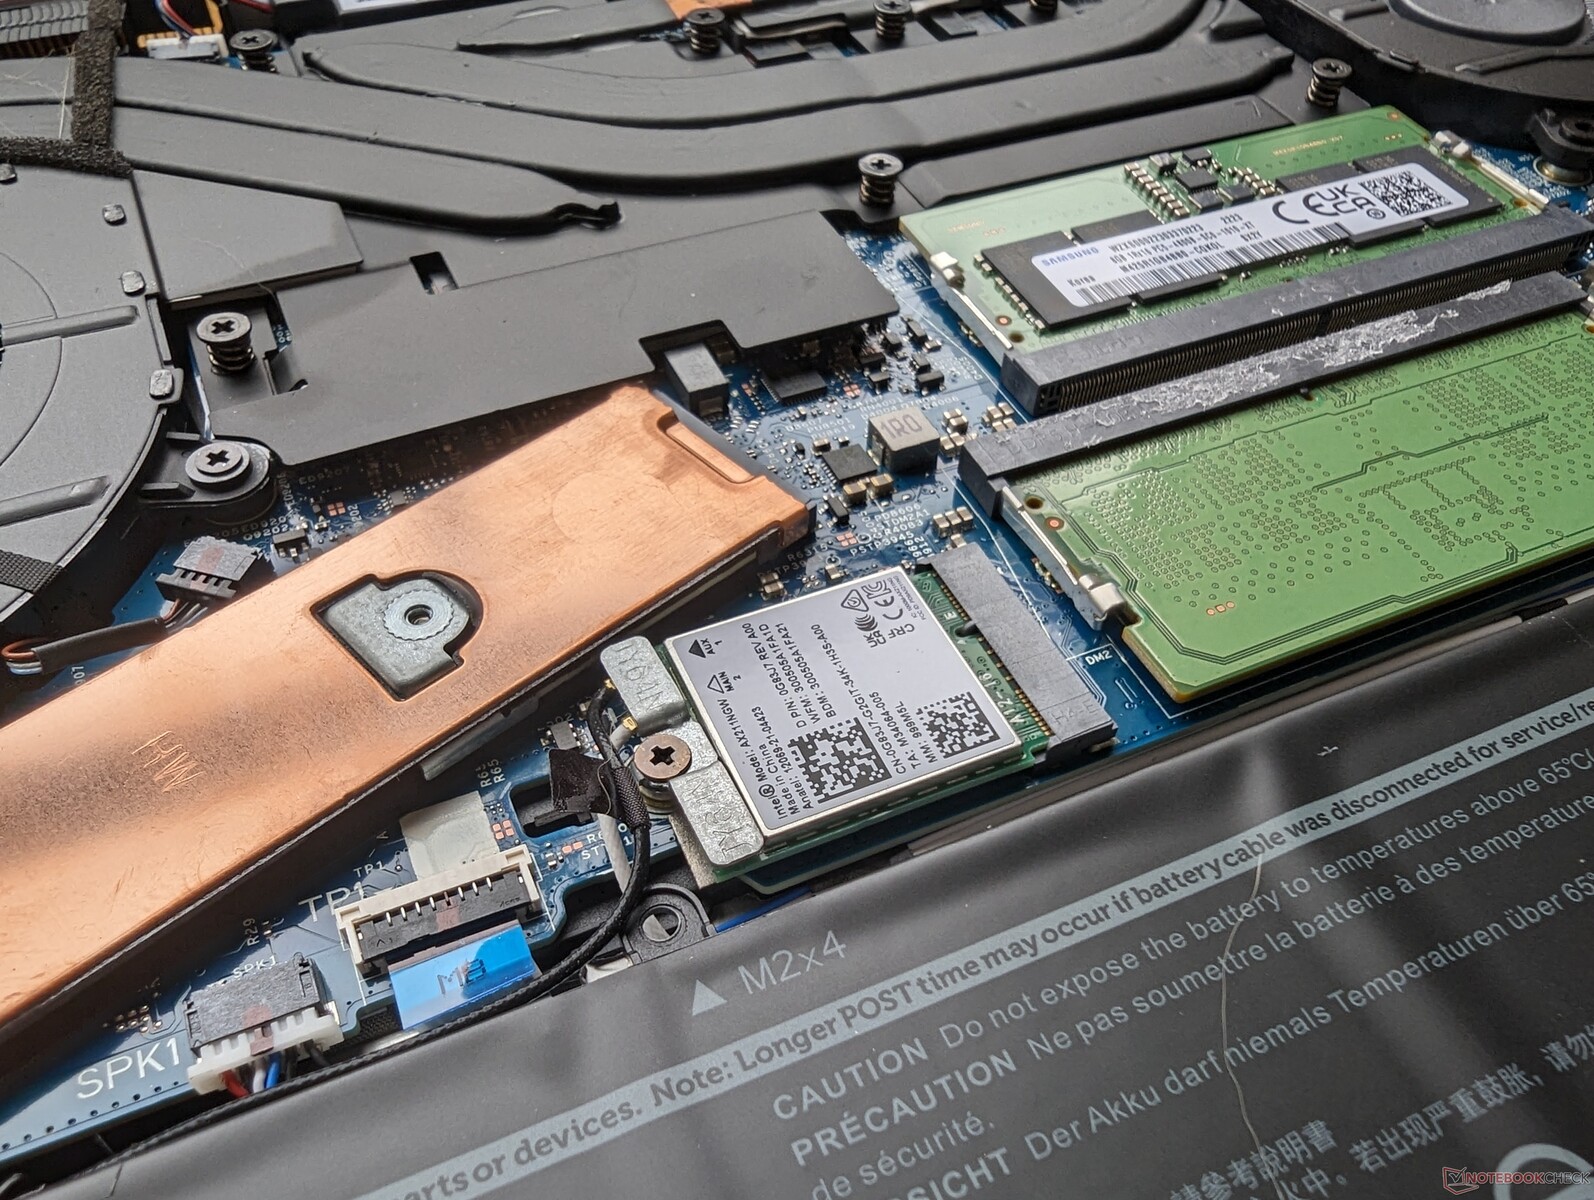
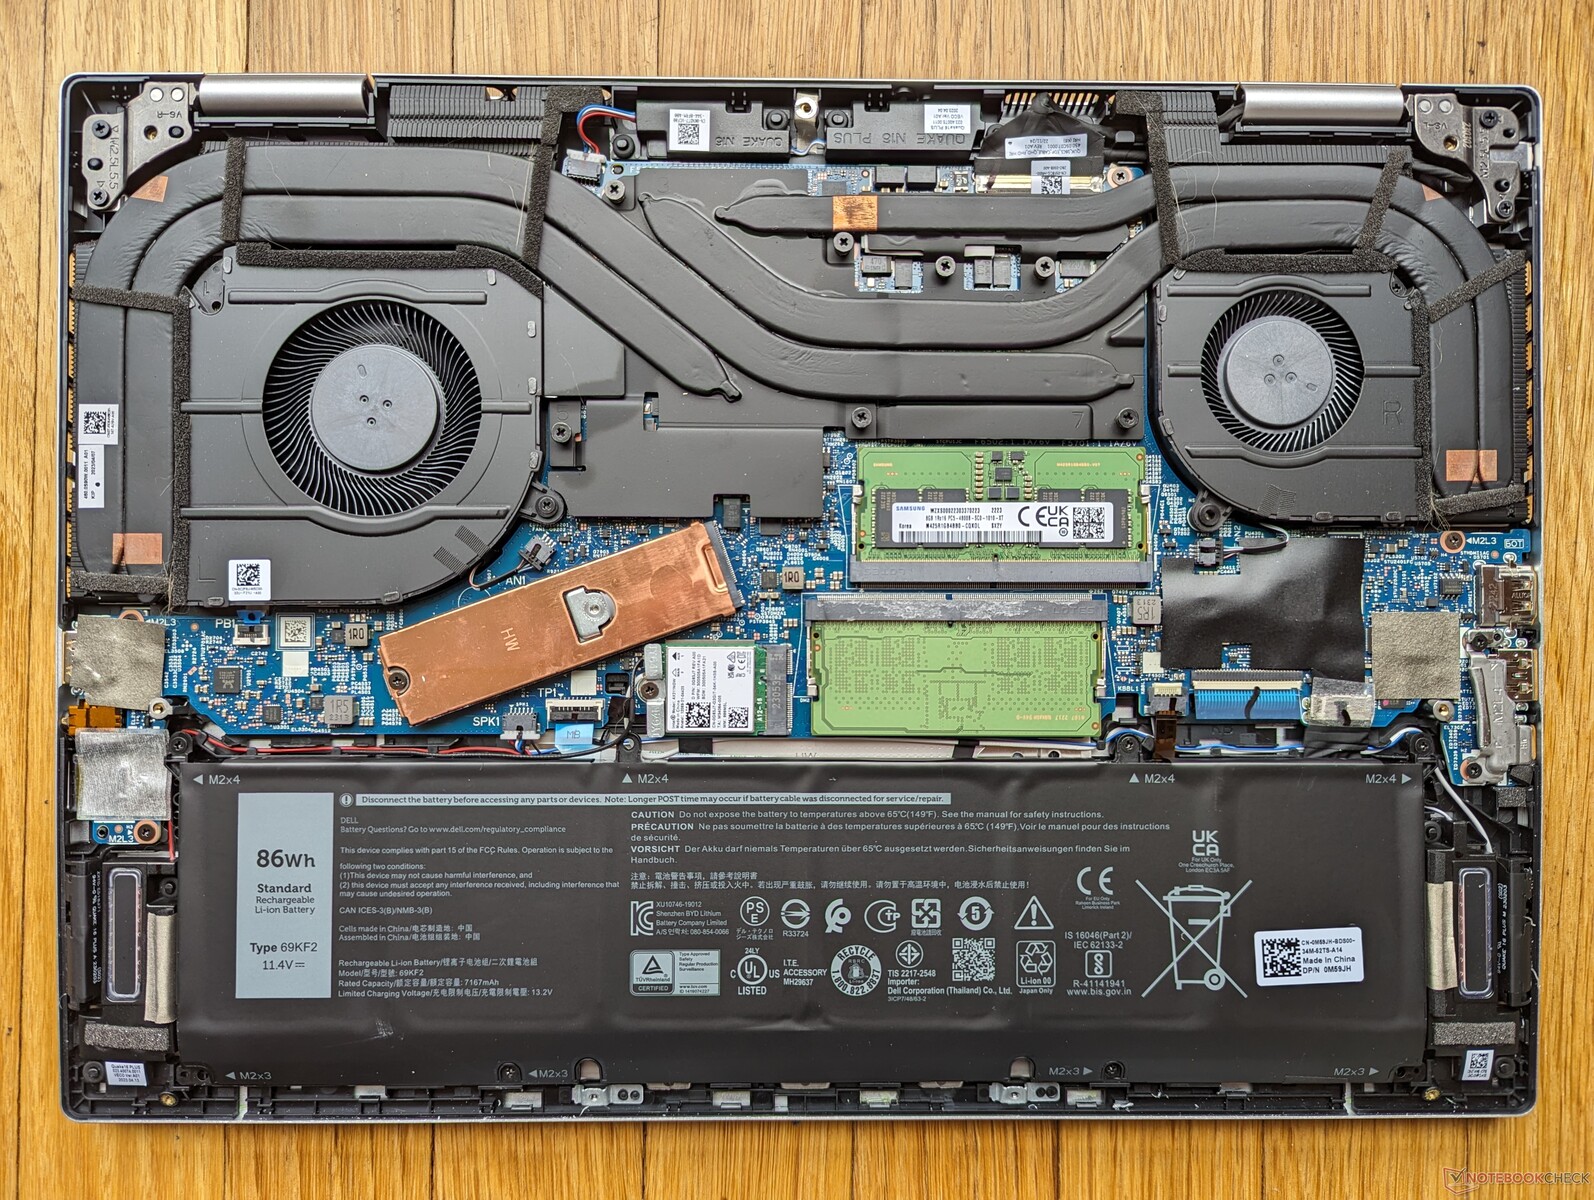
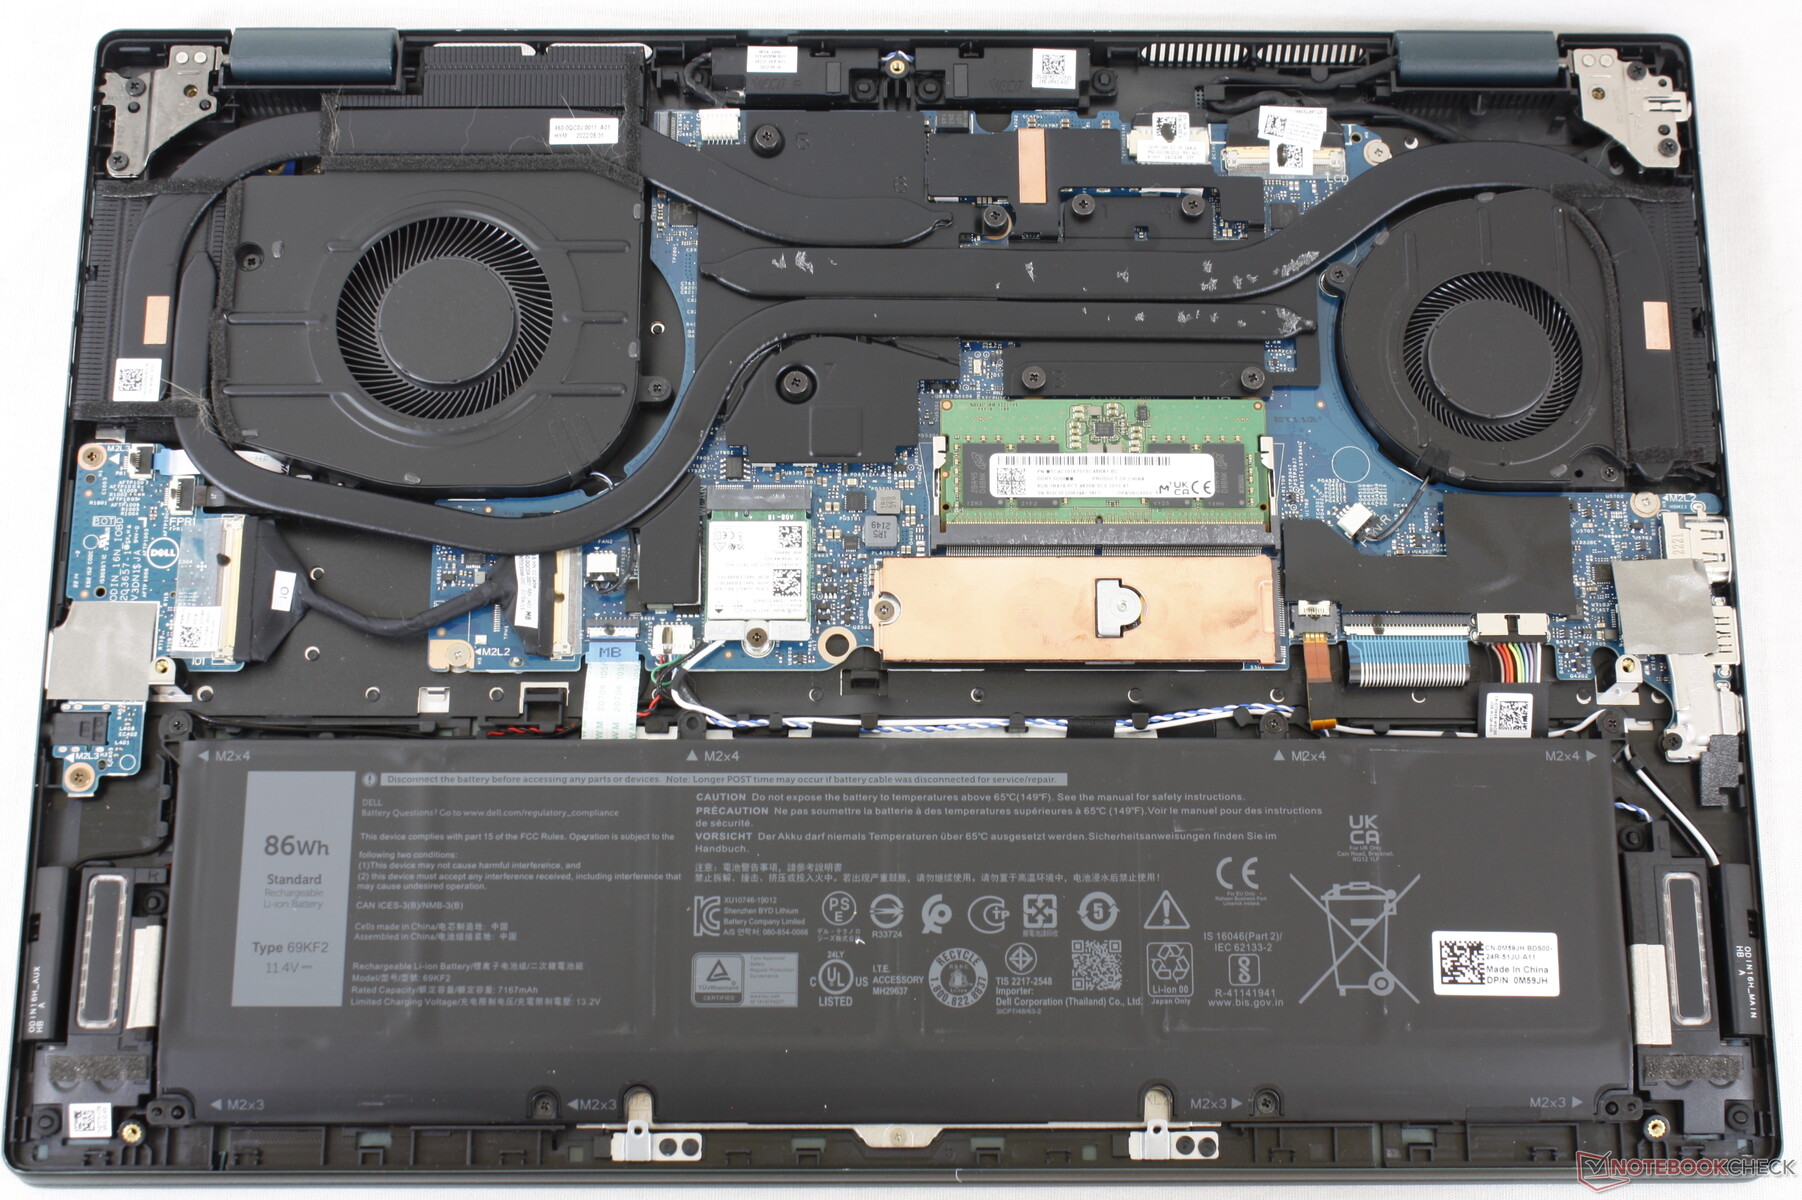
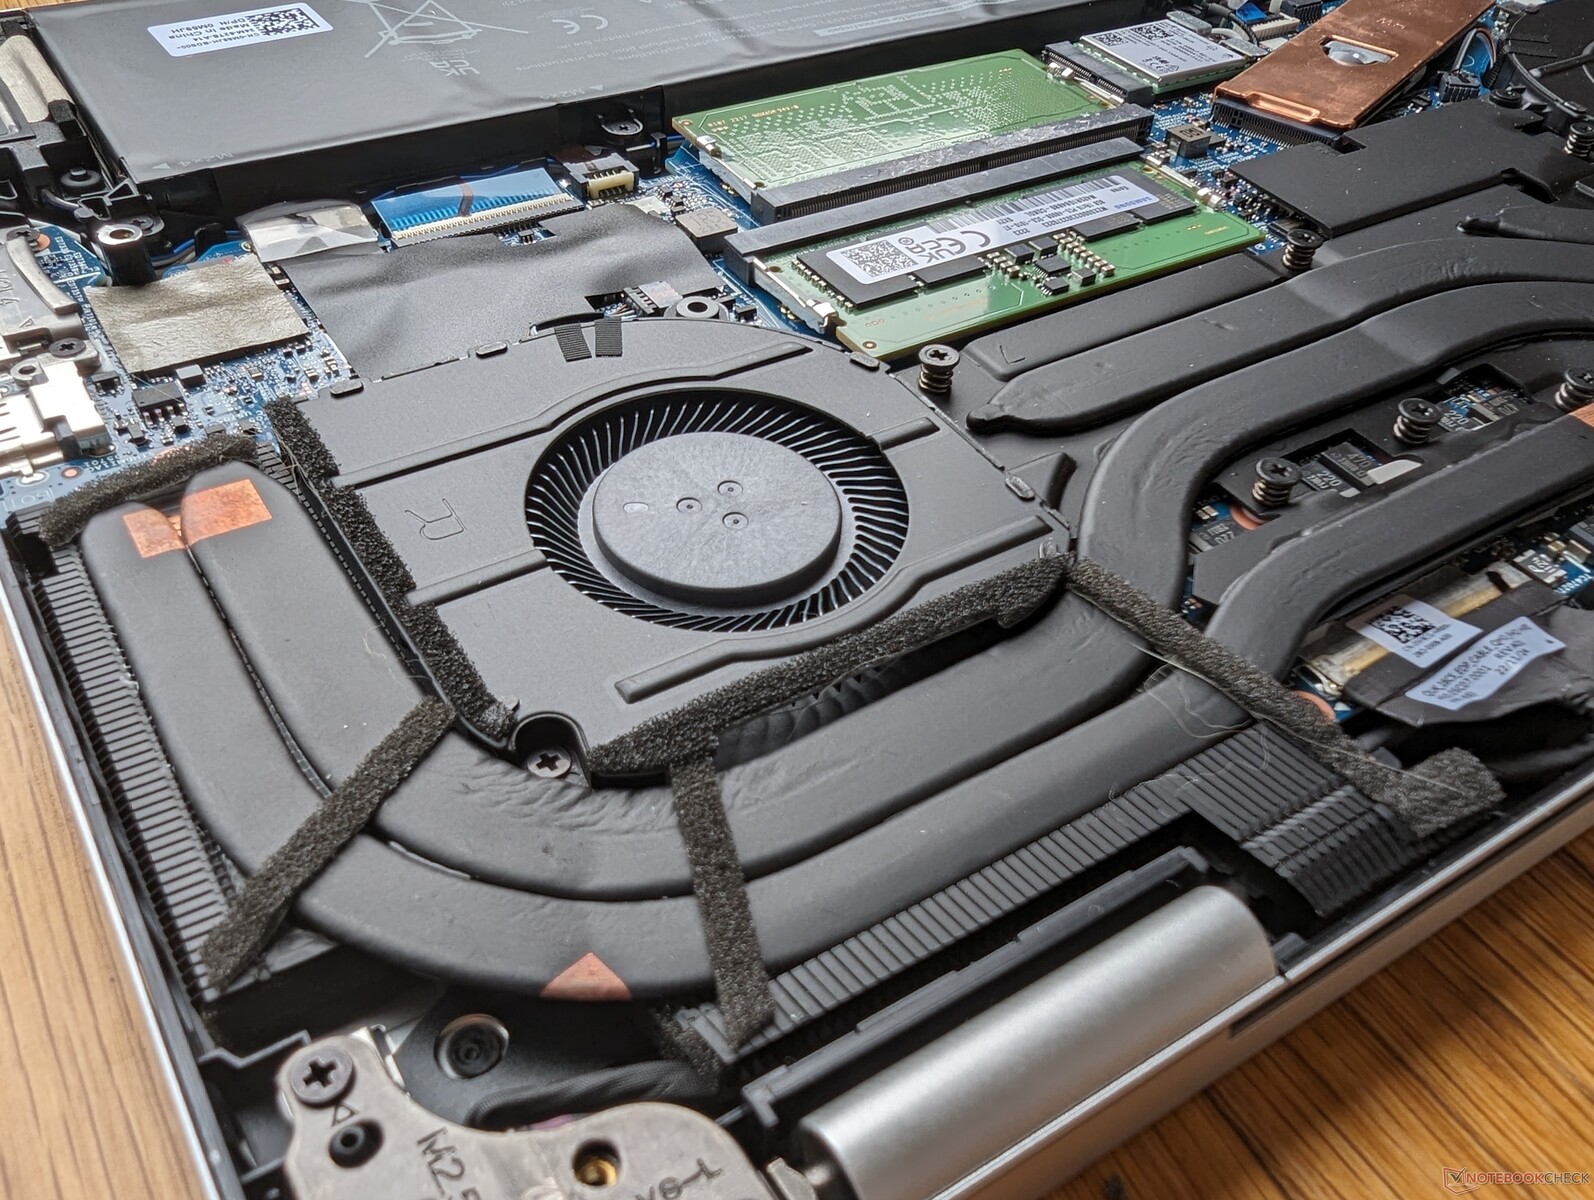
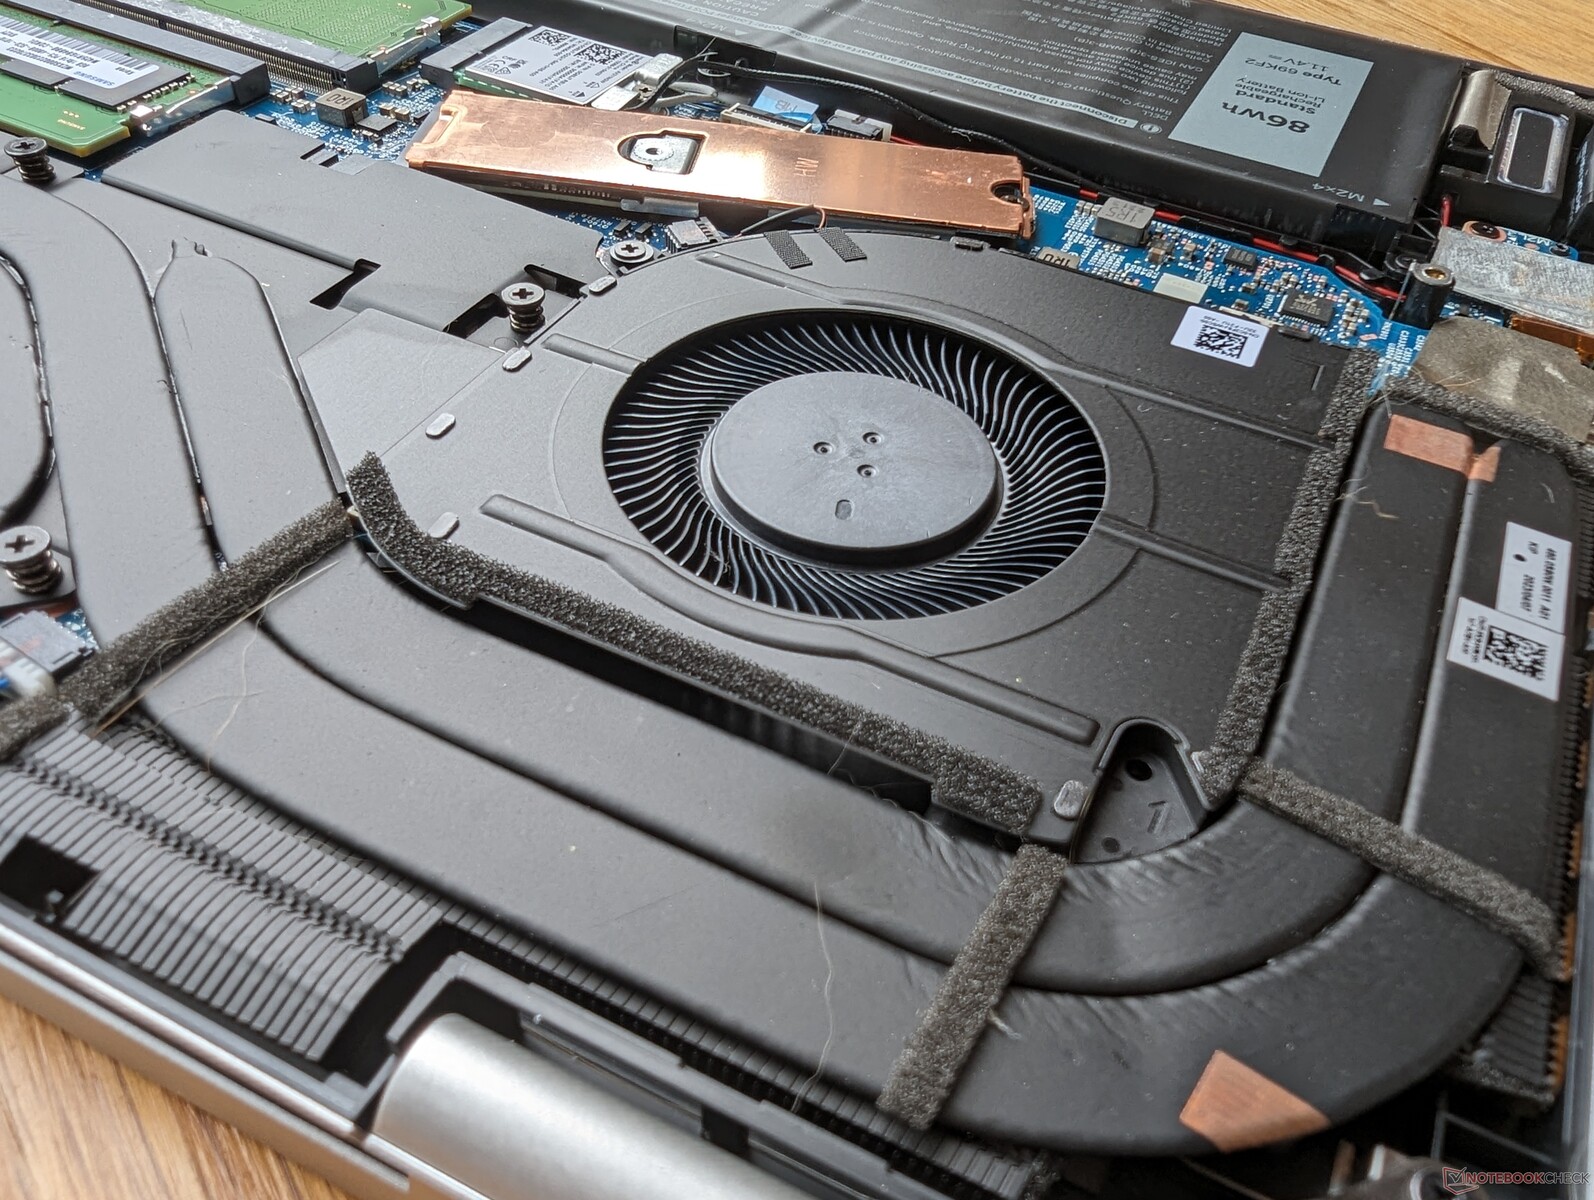
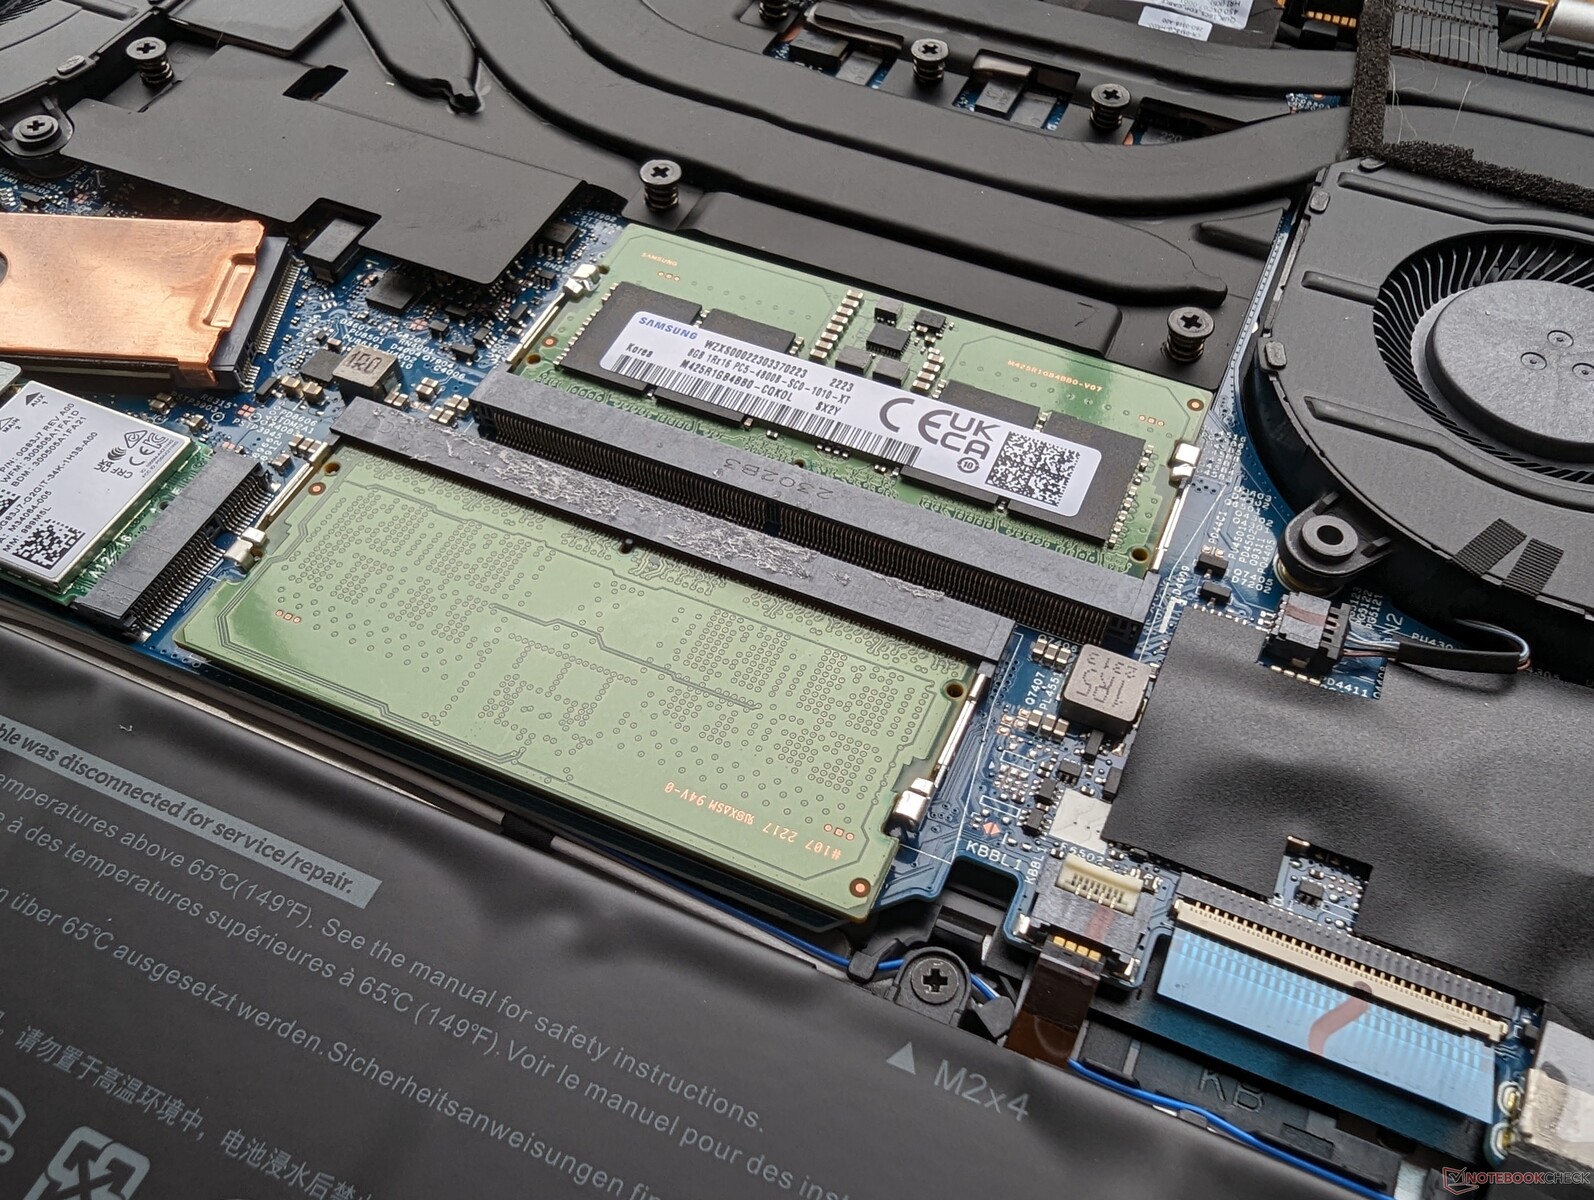
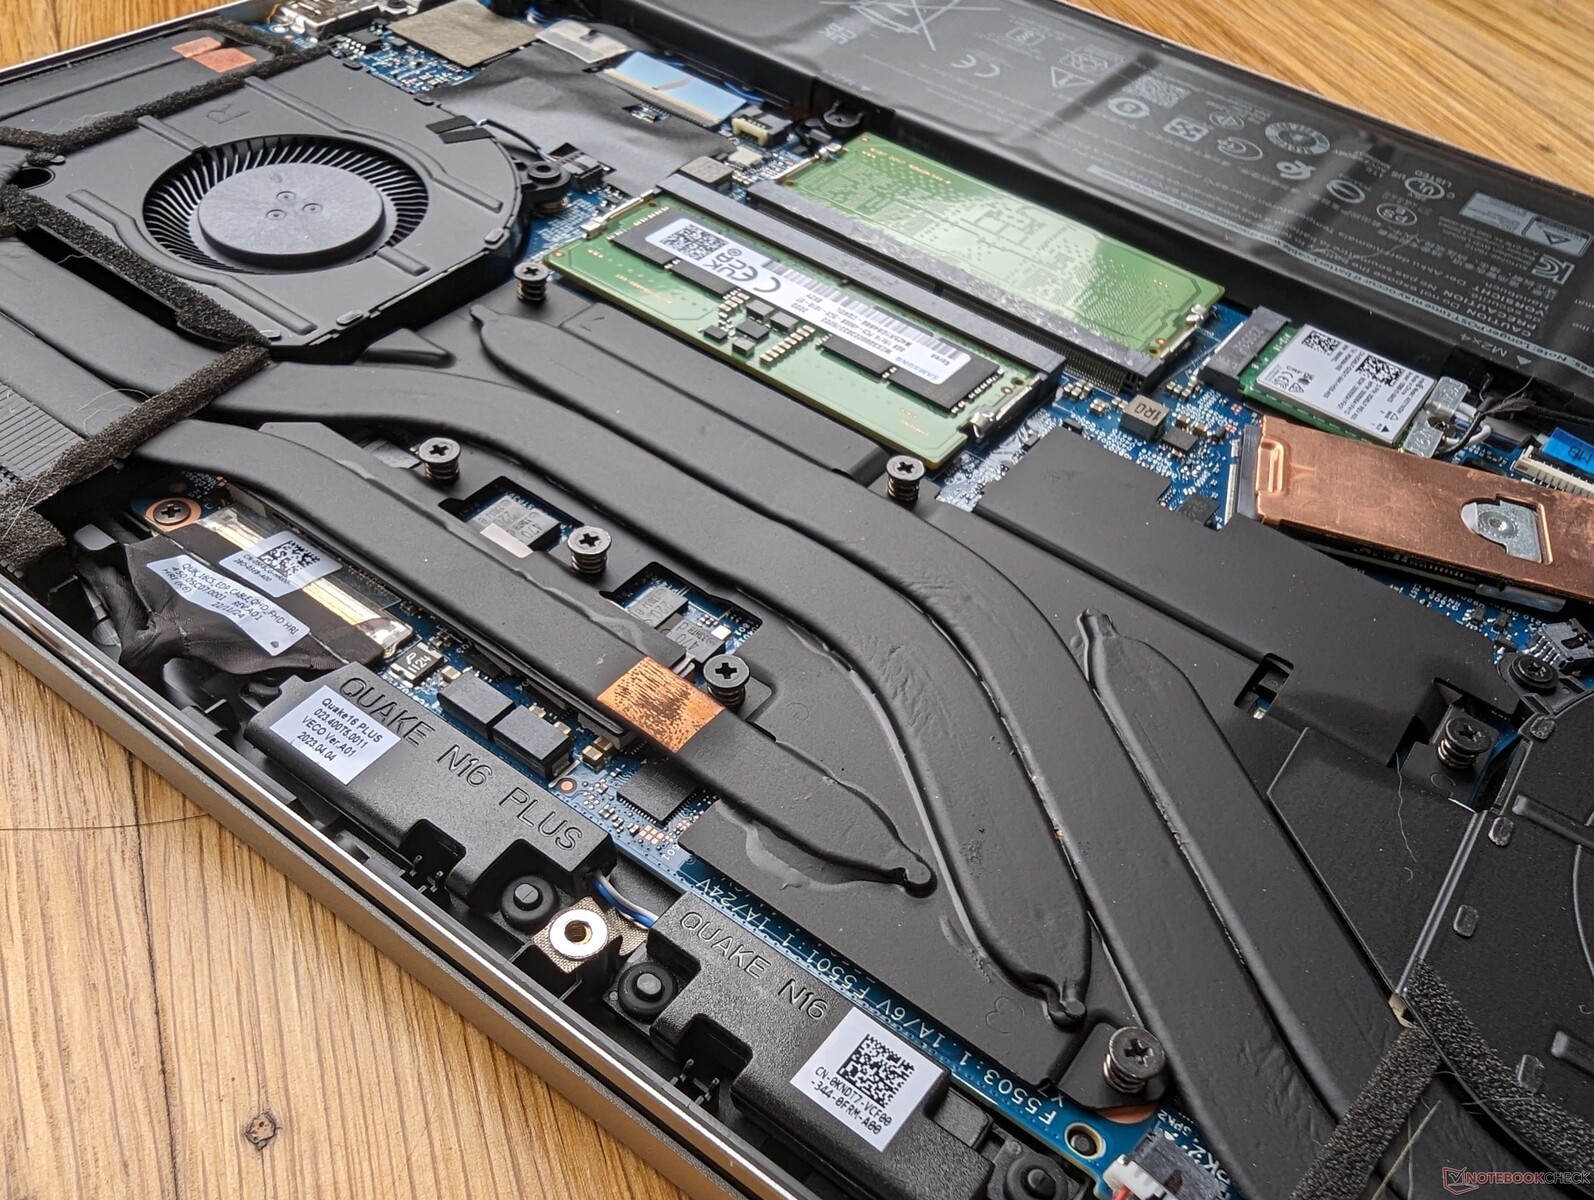
Нижняя крышка удерживается болтами Phillips, а также защелками по периметру. Внутри открывается доступ к SSD, Wi-Fi и двум слотам SODIMM, в то время как у предшественника такой был всего один. Вентиляторы и теплотрубки стали больше, за счет чего эффективность охлаждения должна была возрасти.
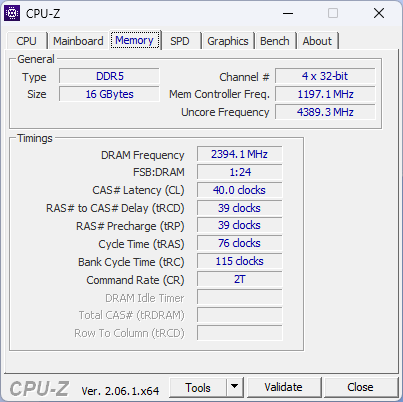
Учтите, что в модели на AMD будет установлена оперативная память LPDDR5, которая будет распаяна на плате. То есть, слоты ОЗУ есть только у модели на Intel.
Аксессуары и гарантия
В коробке с ноутбуком только документация и руководство пользователя. Срок гарантии от производителя 1 год.
Устройства ввода
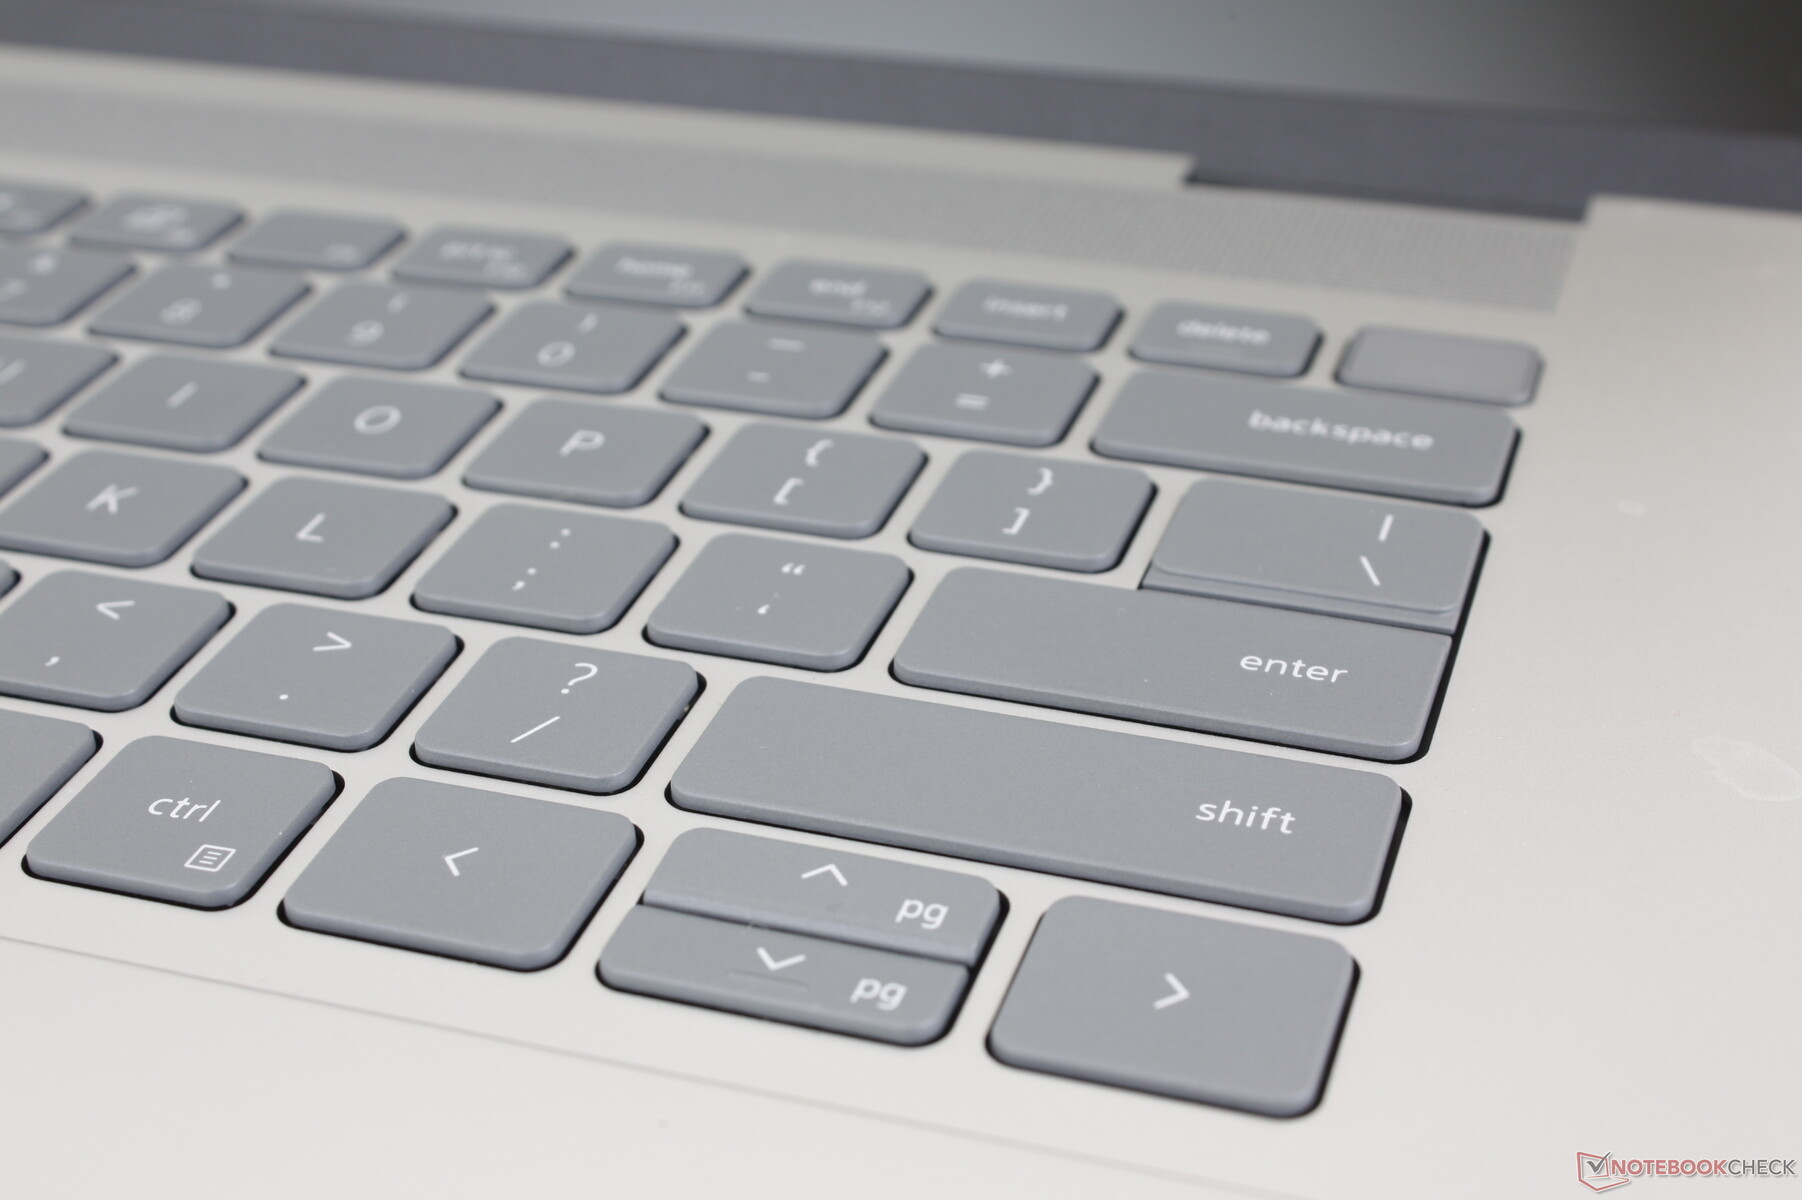
Клавиатура
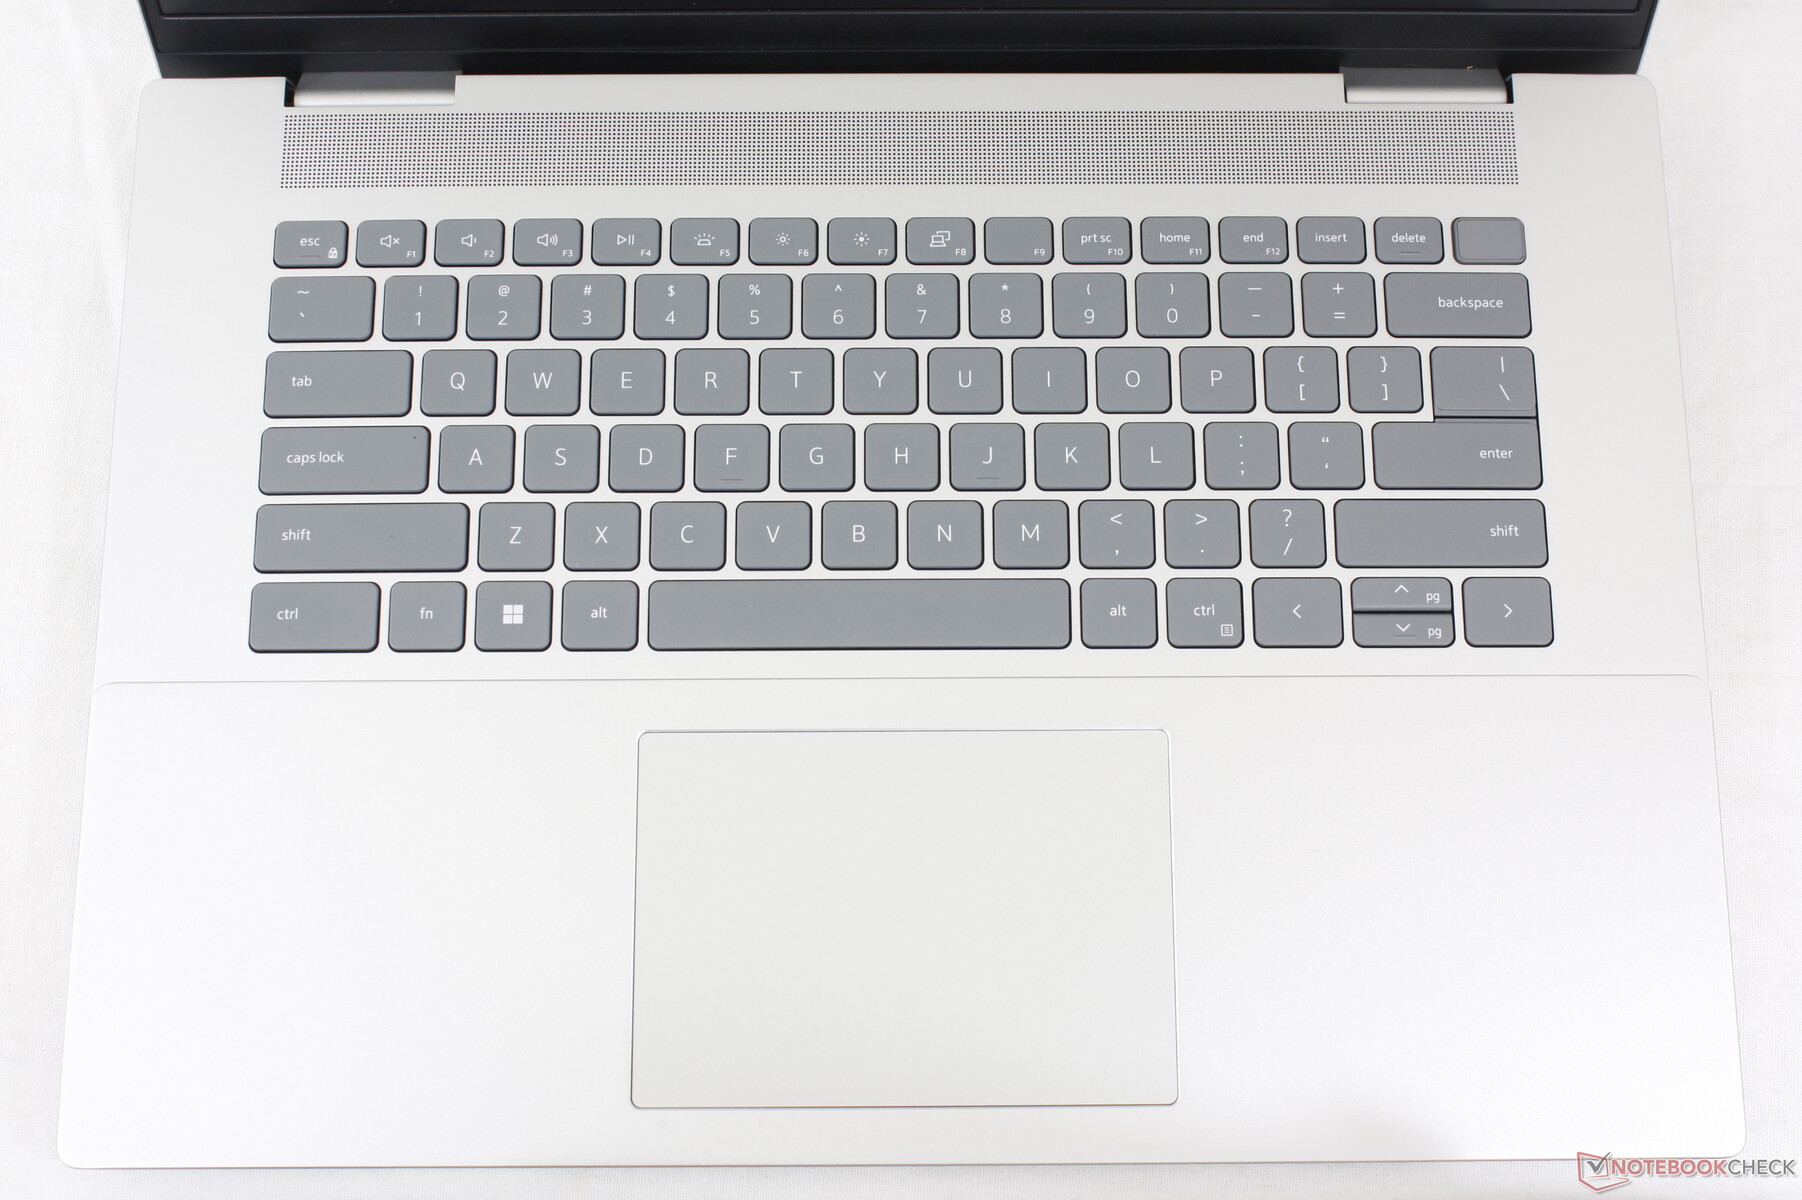
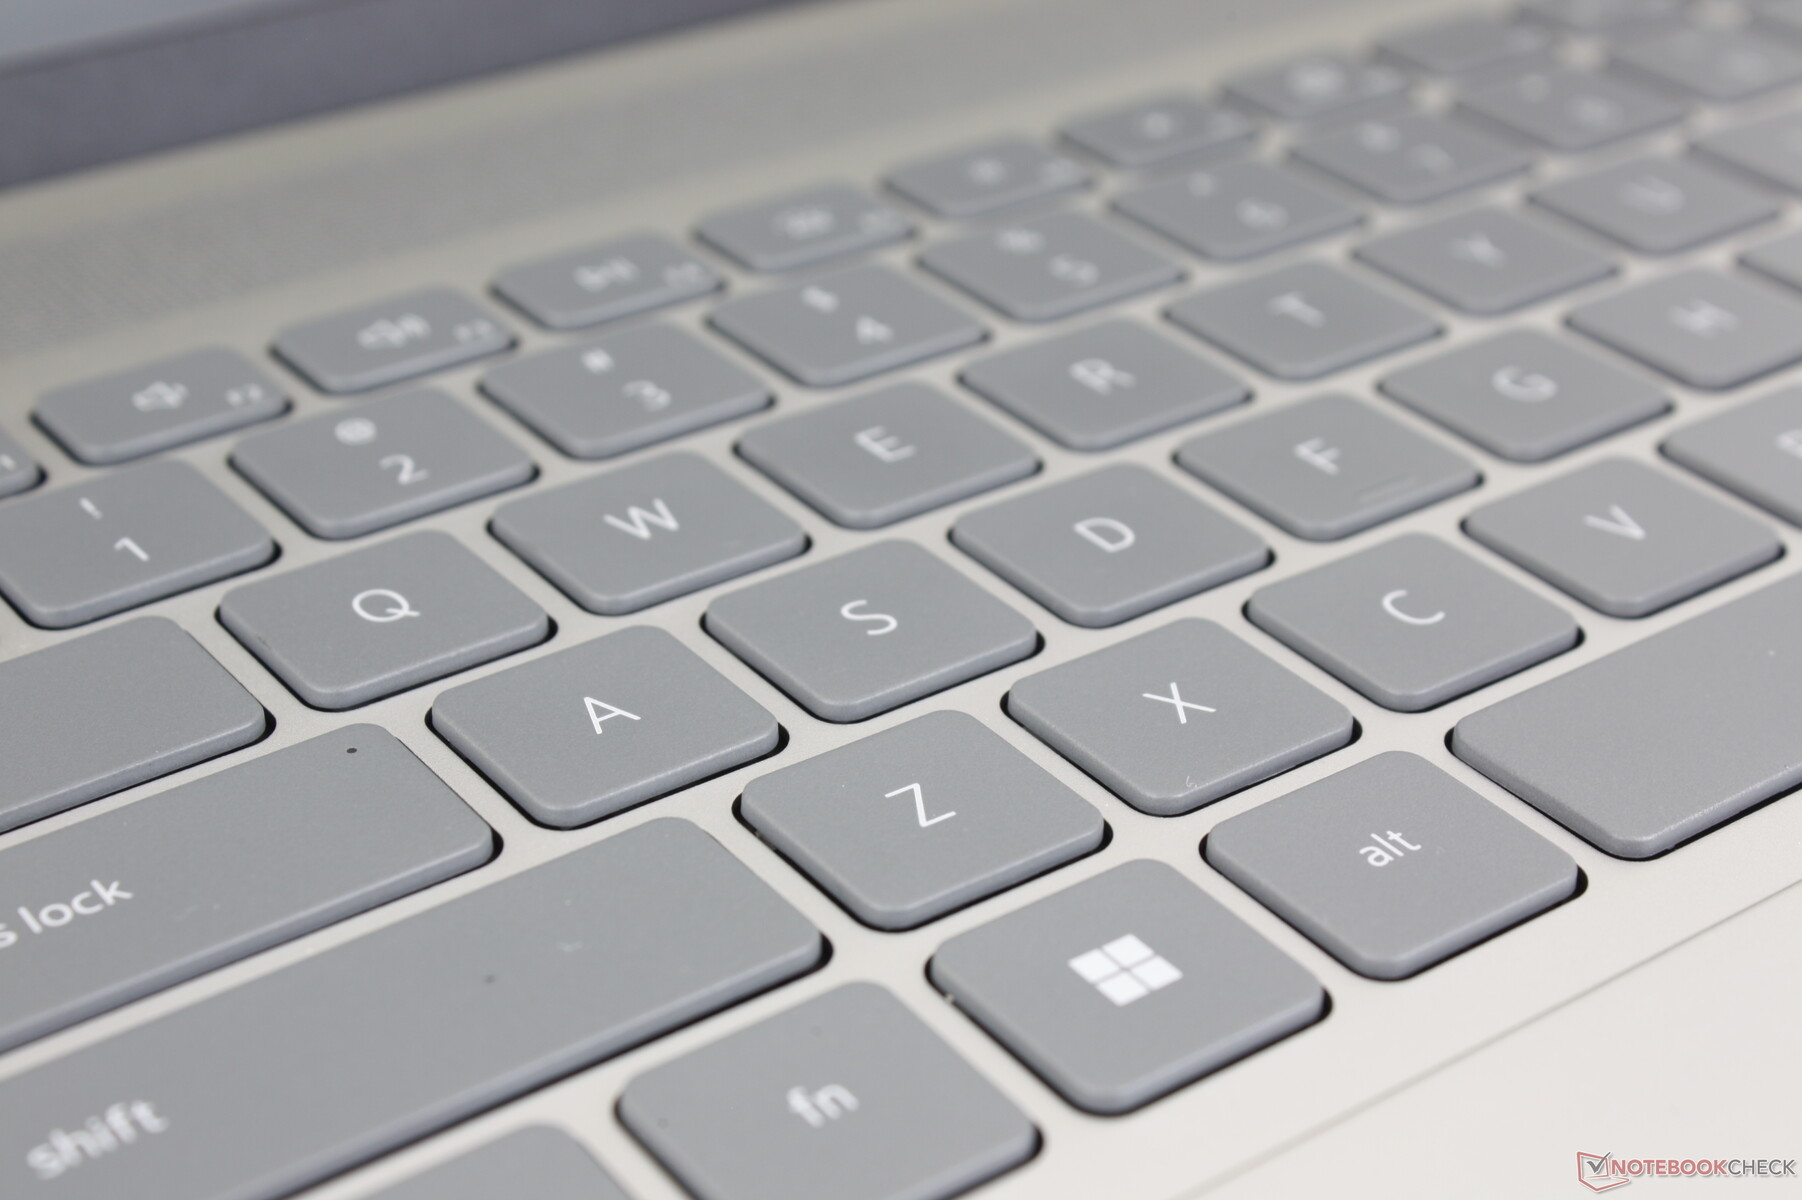
Клавиатура точно такая же, как у Inspiron 16 Plus 7620, даже обозначения дополнительных клавиш те же. Плохого в этом ничего нет - наоборот, стабильность в серии Inspiron следует похвалить. Однако стоит заметить, что у других ноутбуков мультимедийного класса - LG Gram 16 и HP Spectre x360 16 - более точный тактильный отклик, дающий большее удобство.
Тачпад
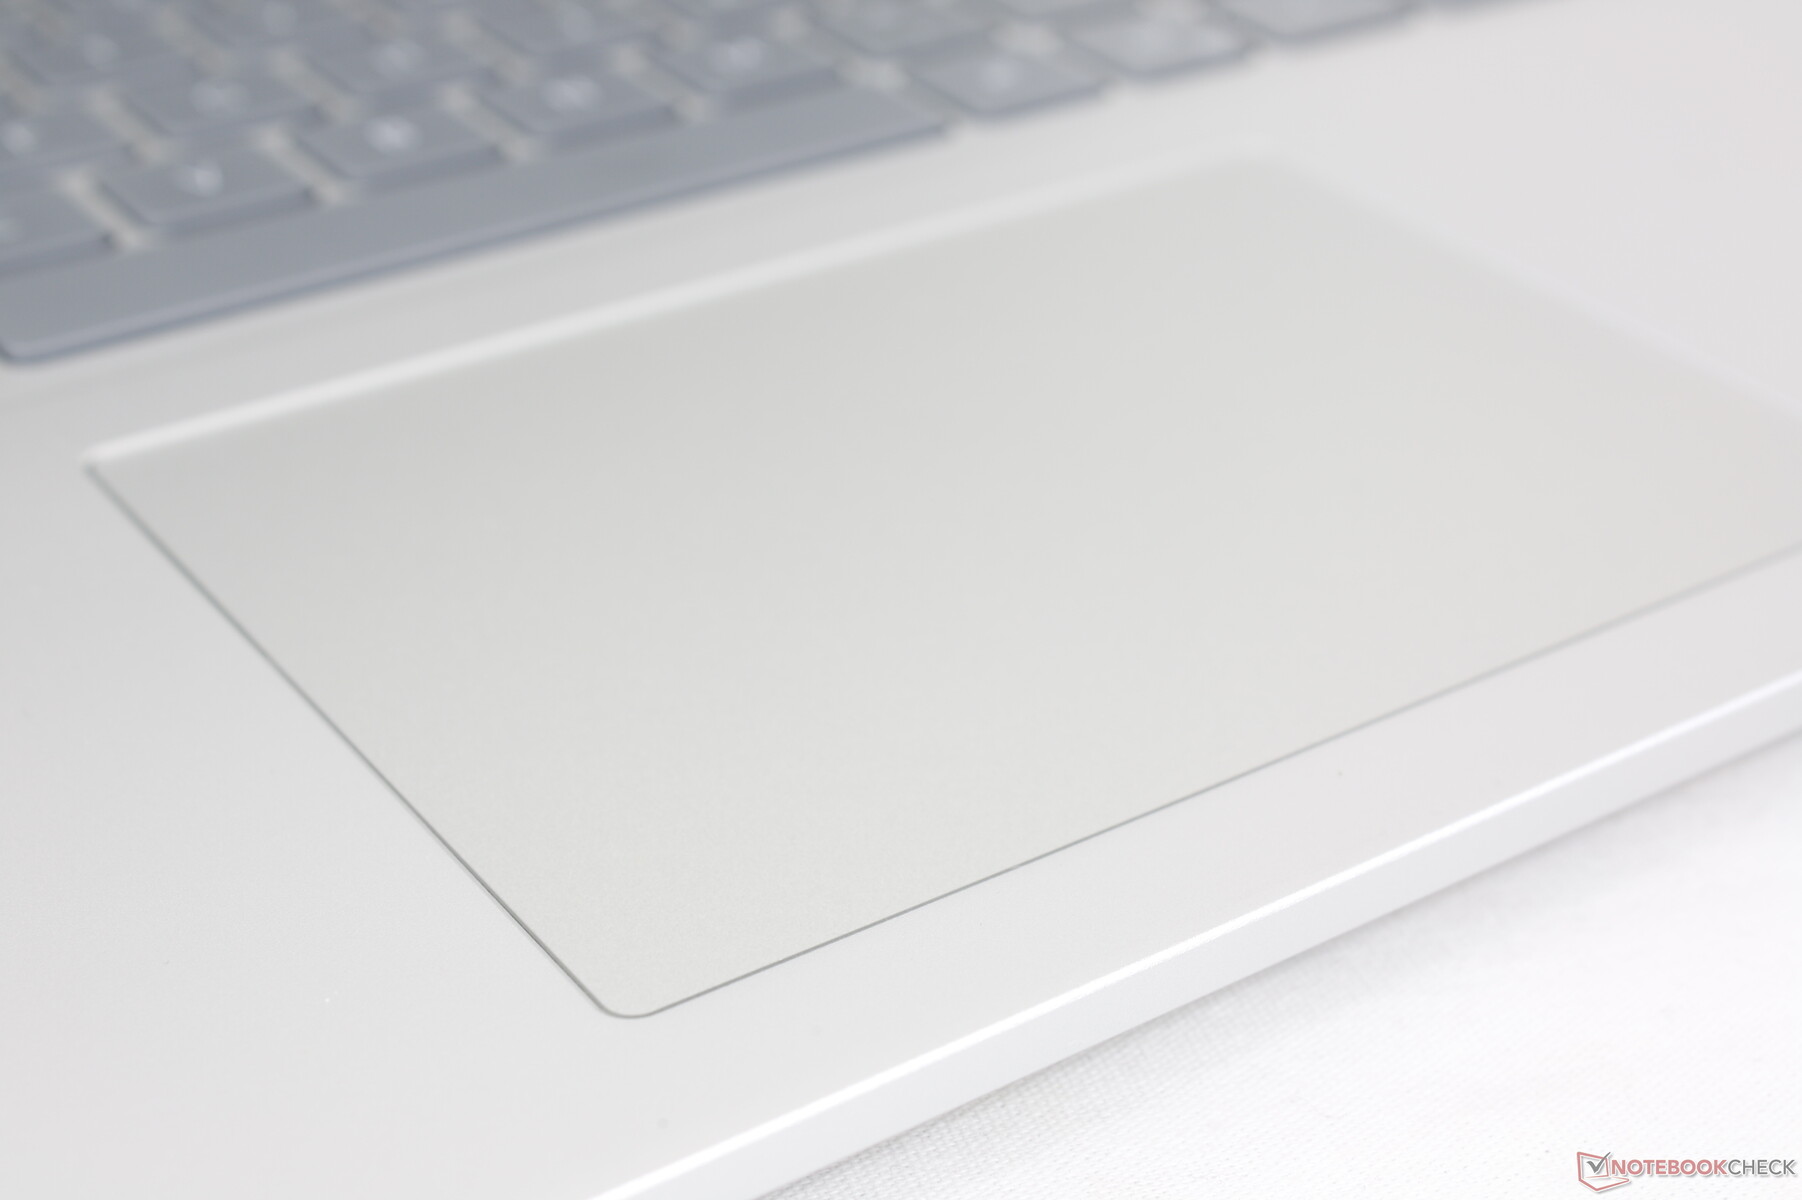
Тачпад точно такой же по размерам, как у прошлогодней модели (11.5 x 8 см). Покрытие гладкое и хорошо скользит под пальцами, давая минимальное сопротивление при медленном передвижении для пущей точности. Встроенные клавиши нажимаются мягко, но с громким щелчком при срабатывании.
Дисплей
Набор доступных дисплеев изменился со времен предыдущего Inspiron 16 Plus 7620. Панель с 3K разрешением 3072 x 1920 пикселей исчезла, а вместо нее появились такие варианты на выбор:
- 2560 x 1600 (2.5K), 120 Гц
- 1920 x 1200, 60 Гц
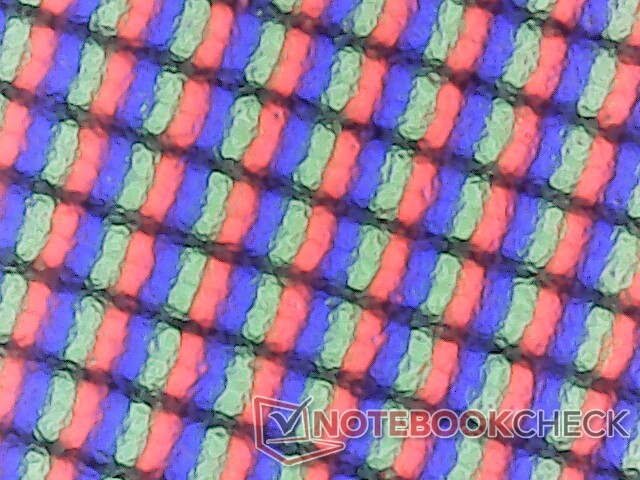
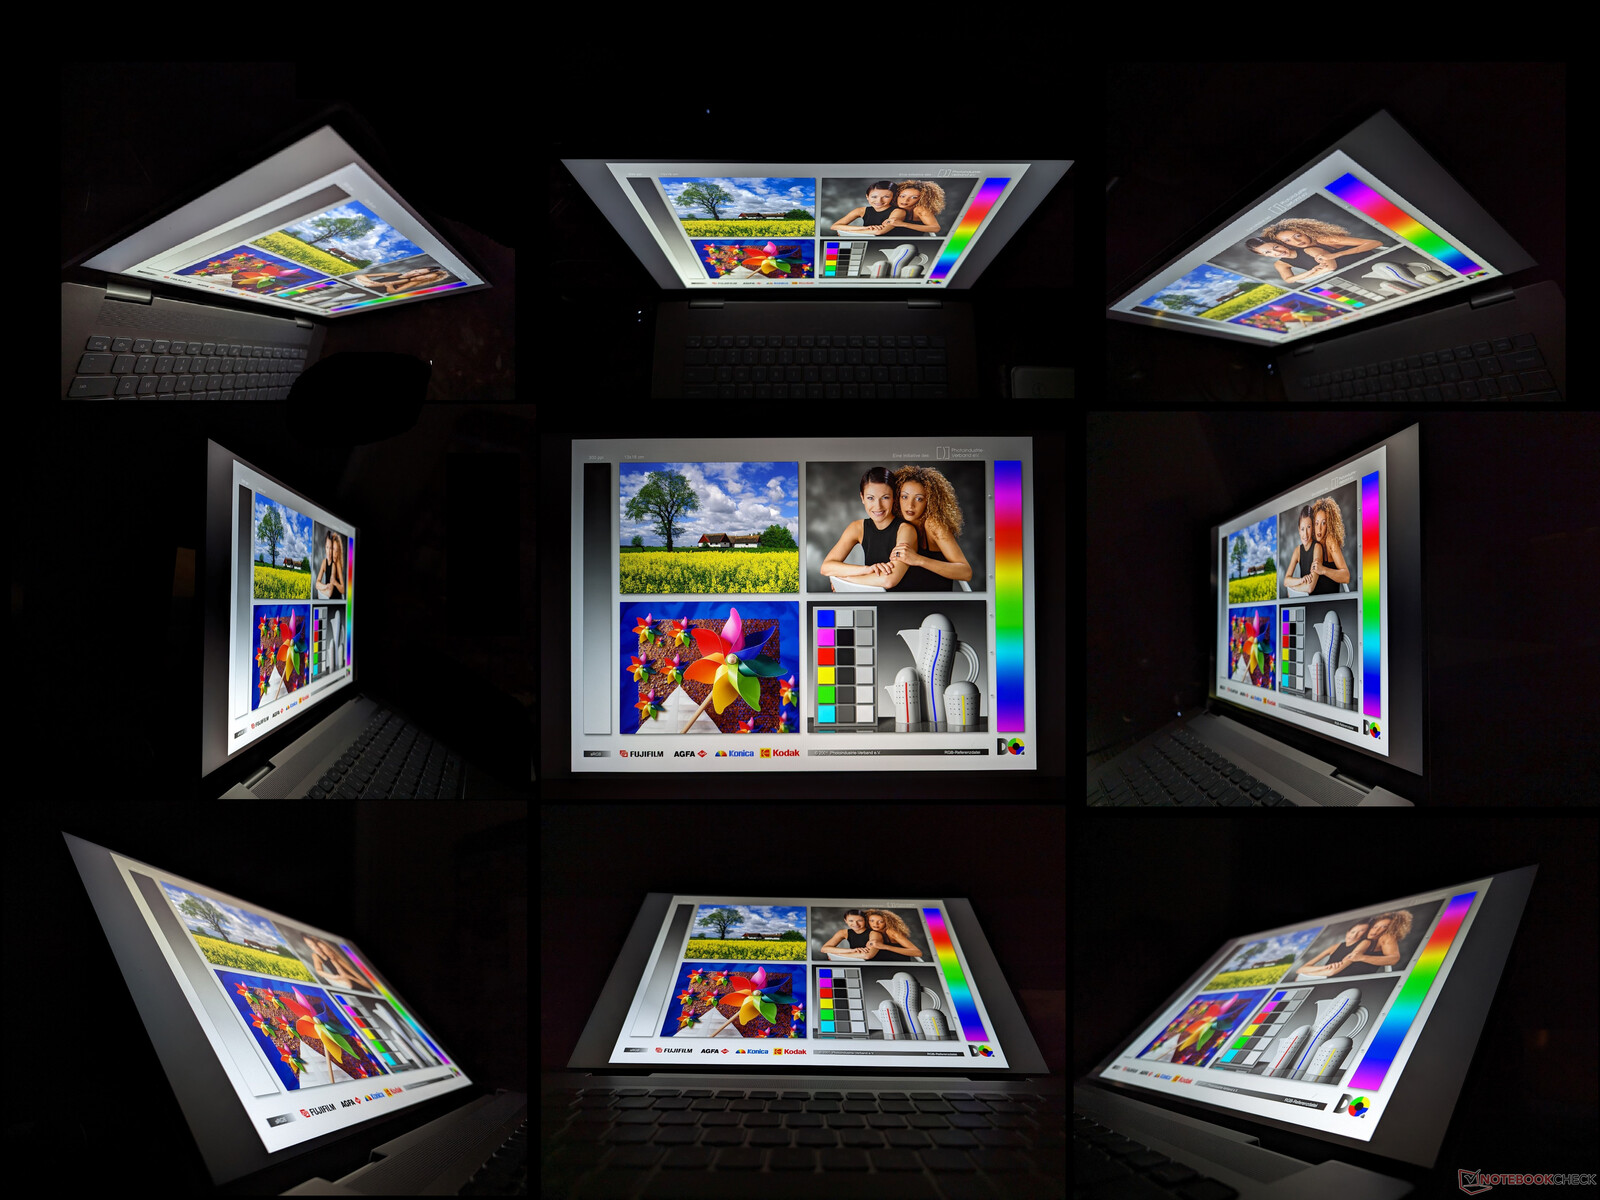
Обе панели принадлежат к IPS типу, не поддерживают G-Sync и не оснащены сенсорным экраном. В нашем тестовом образце установлена панель с 1600p разрешением.
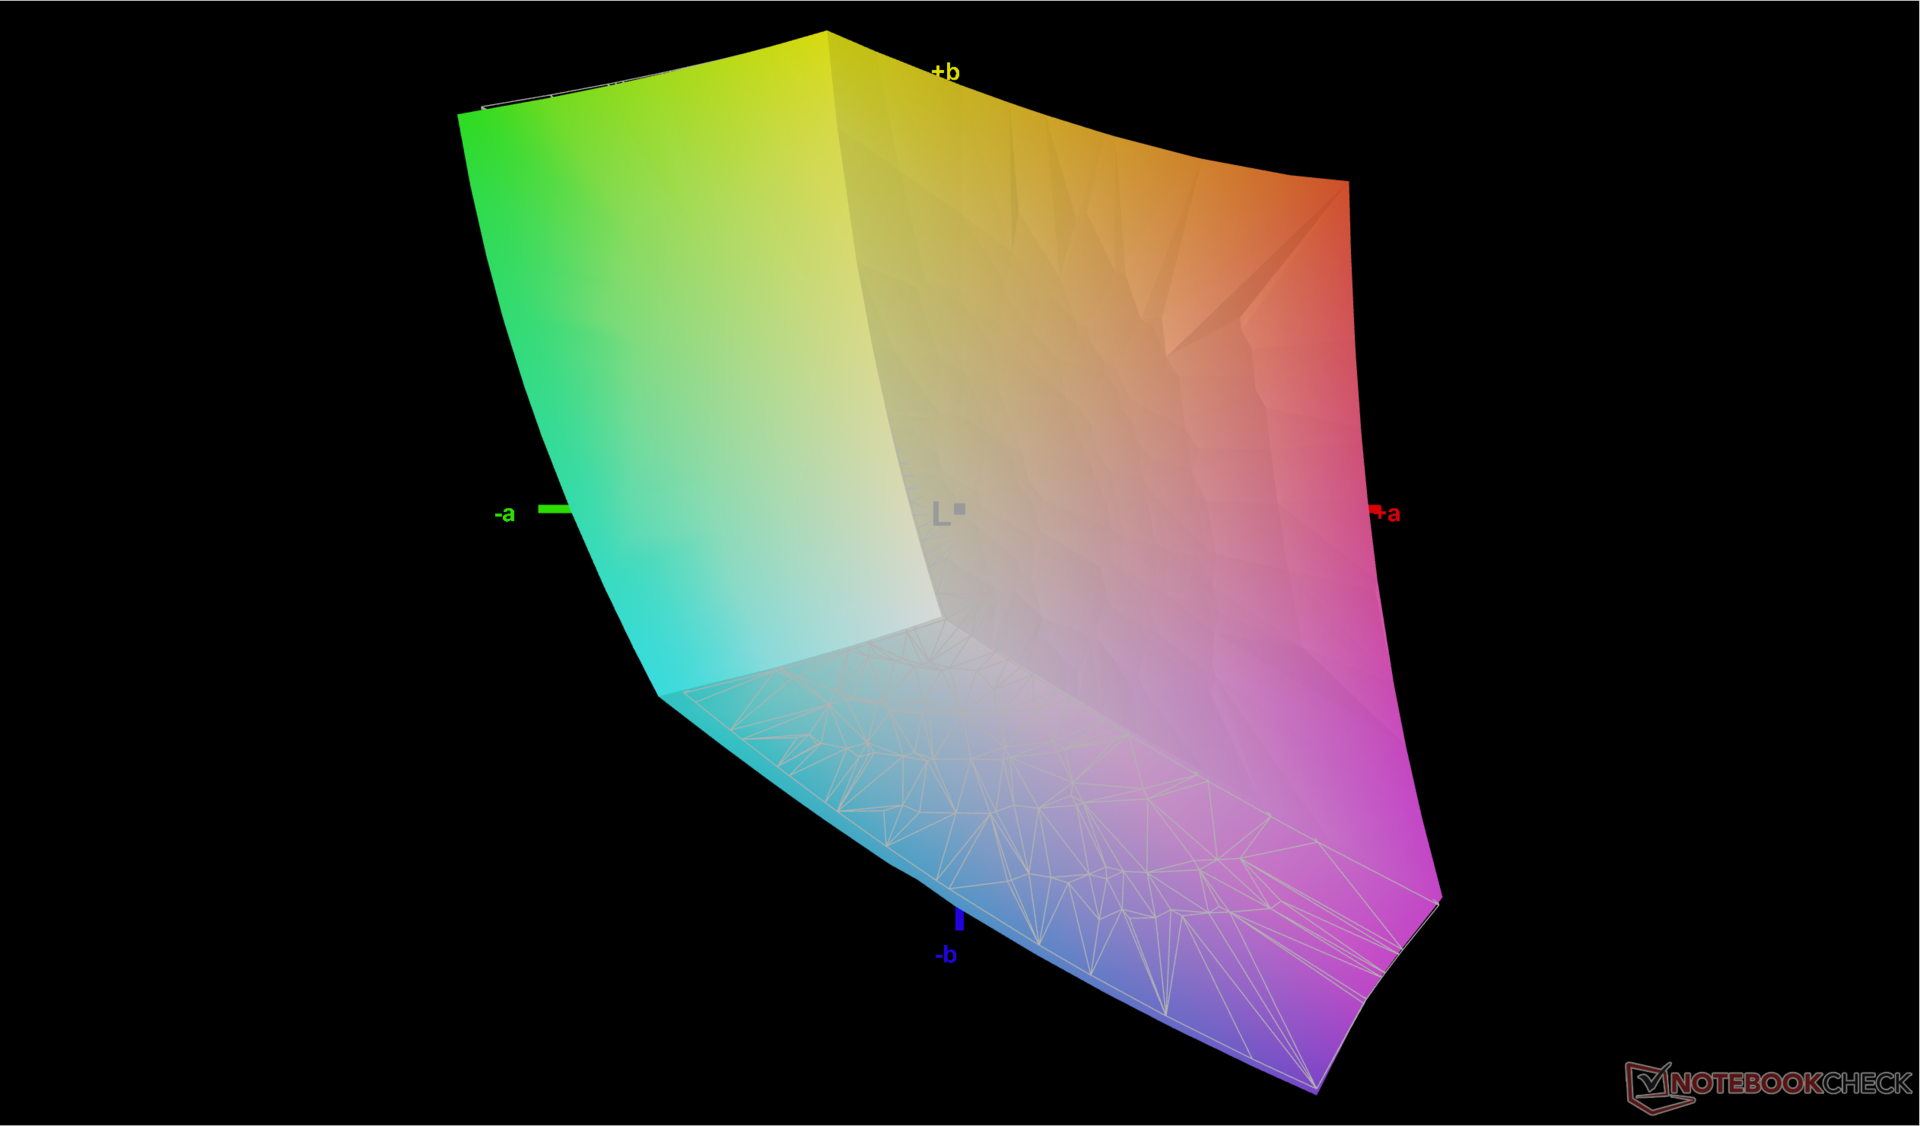
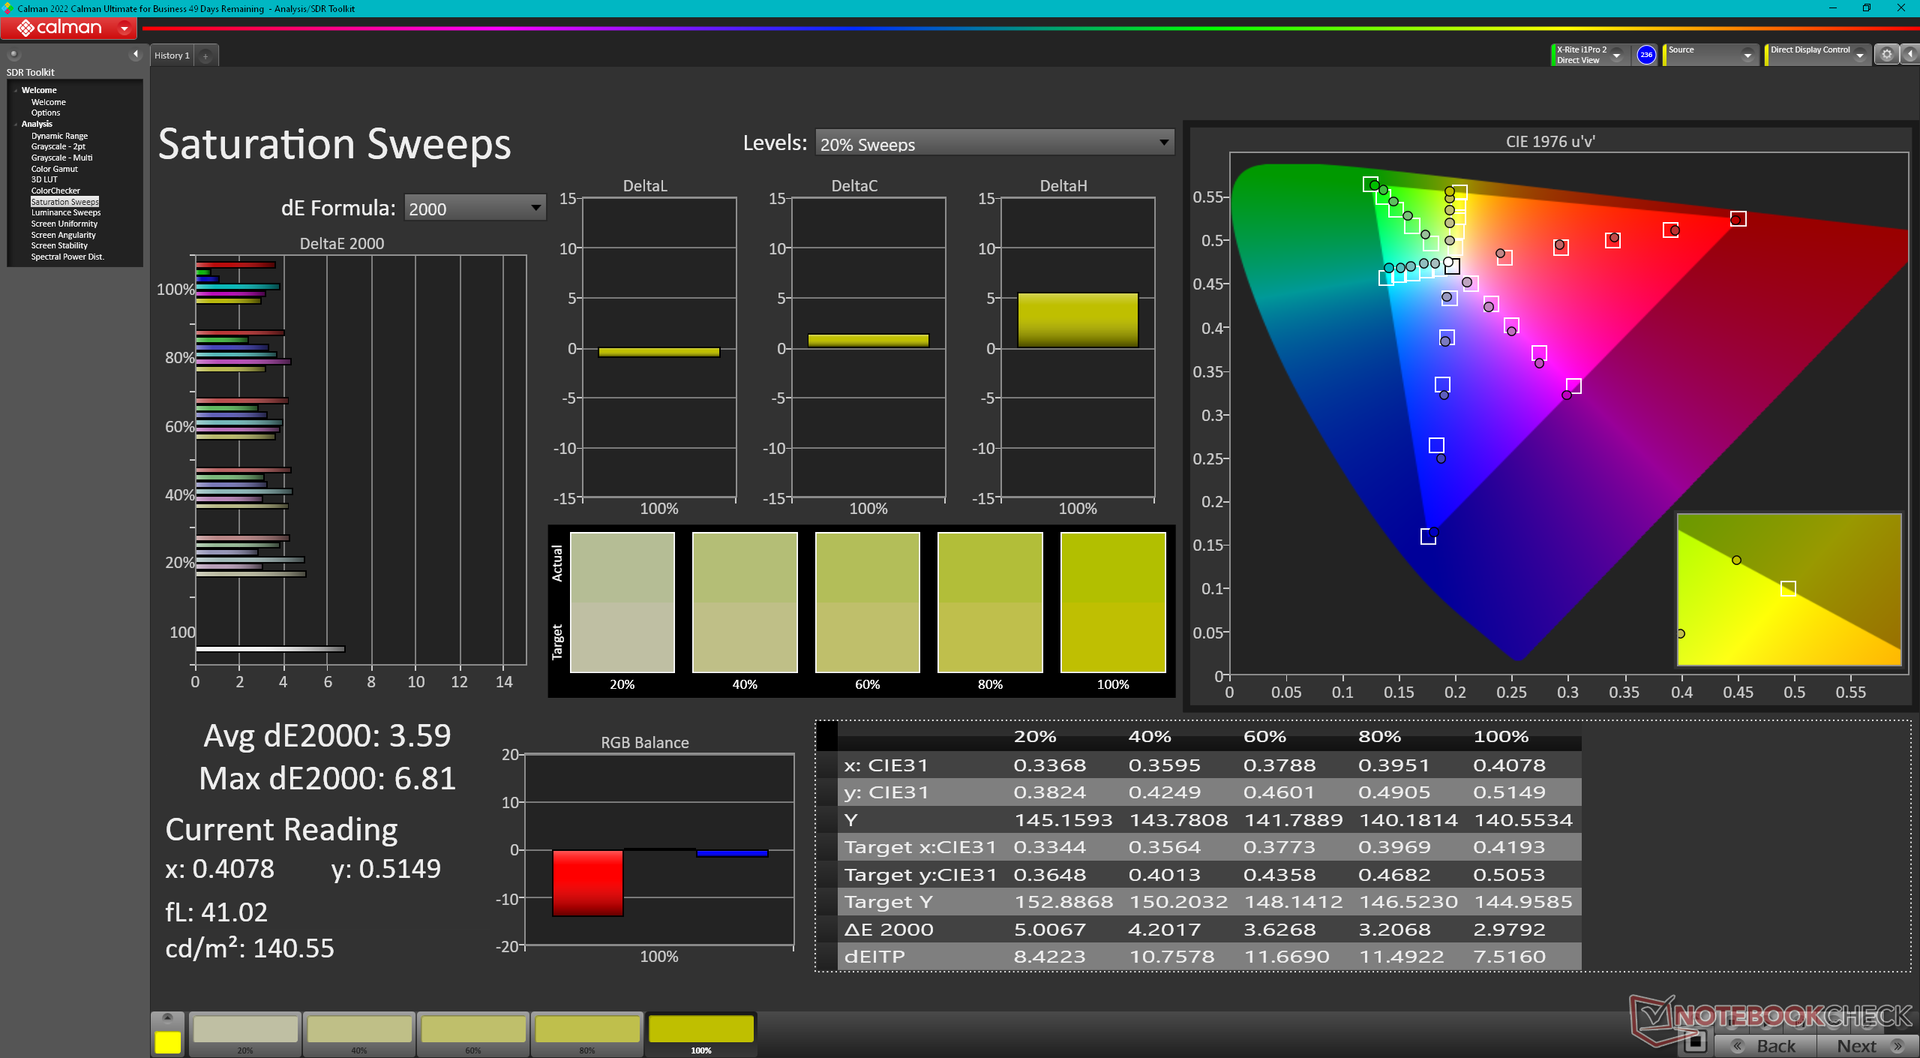
По сравнению с прошлогодней панелью BOE 3K, новая LG Philips 2.5K имеет более высокую частоту обновления, но несколько меньшее разрешением. Также среди характеристики полный охват sRGB, яркость 300 нит, контрастность свыше 1000:1, а время отклика примерно такое же, как у BOE. Стоит отметить, что у Vivobook Pro 16X и Envy 16 разрешение и цветовой охват лучше, что придется по вкусу разработчикам цифрового контента. Панель LG Philips чуть более бюджетная в сравнении с ними.
| |||||||||||||||||||||||||
Равномерность подсветки: 92 %
От батареи: 299.4 cd/m²
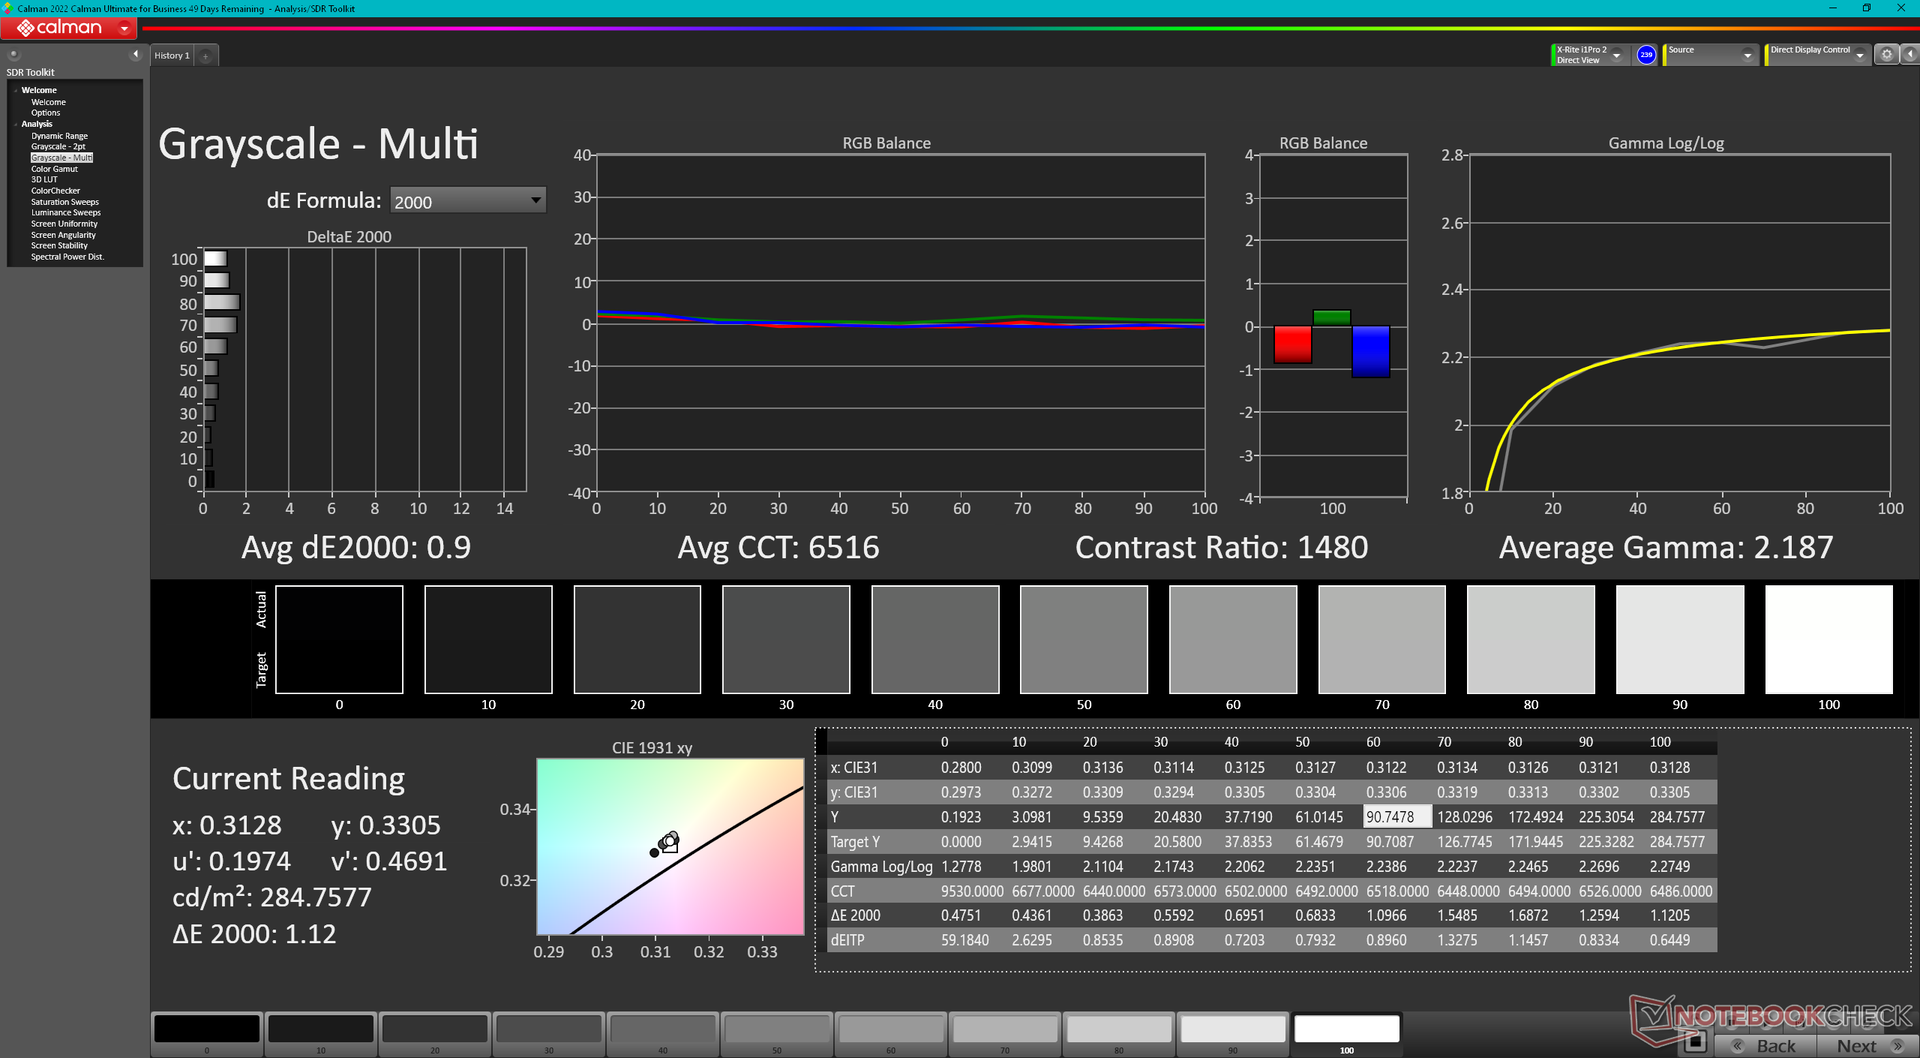
Контрастность: 1426:1 (Уровень чёрного: 0.21 cd/m²)
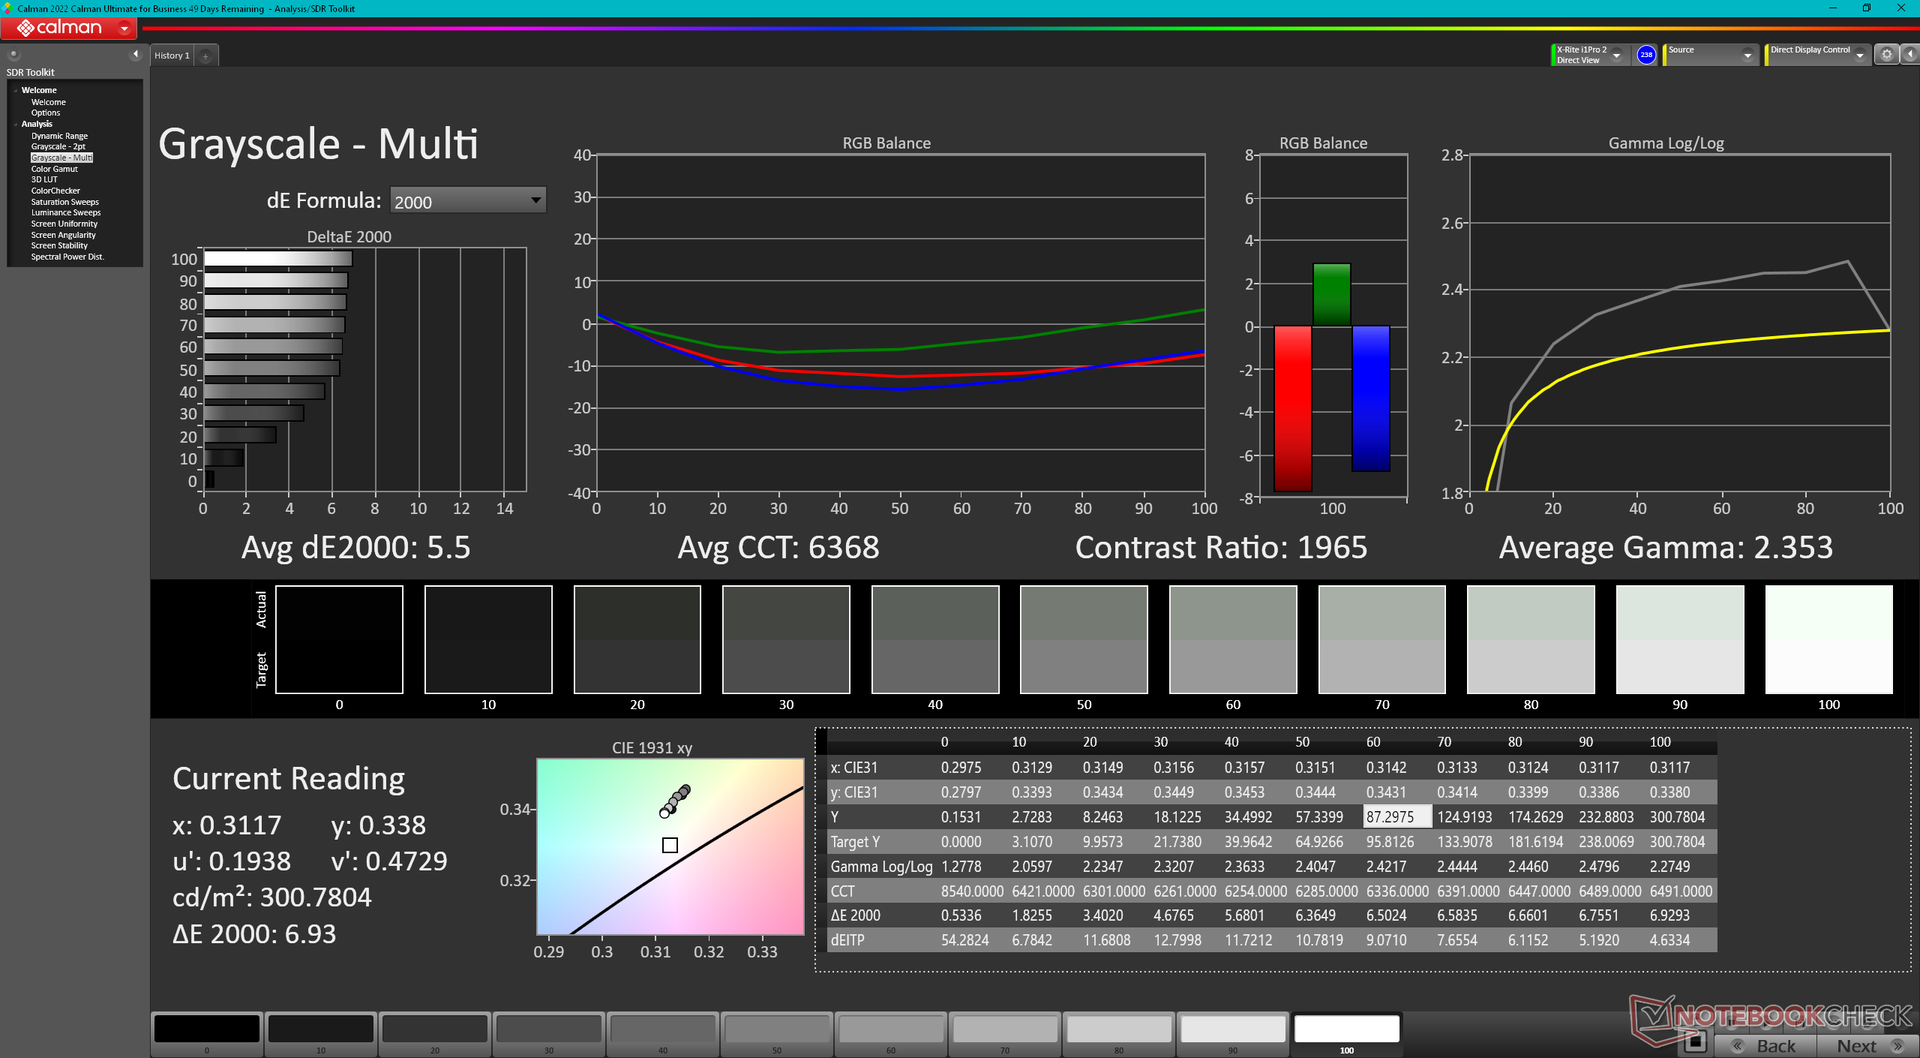
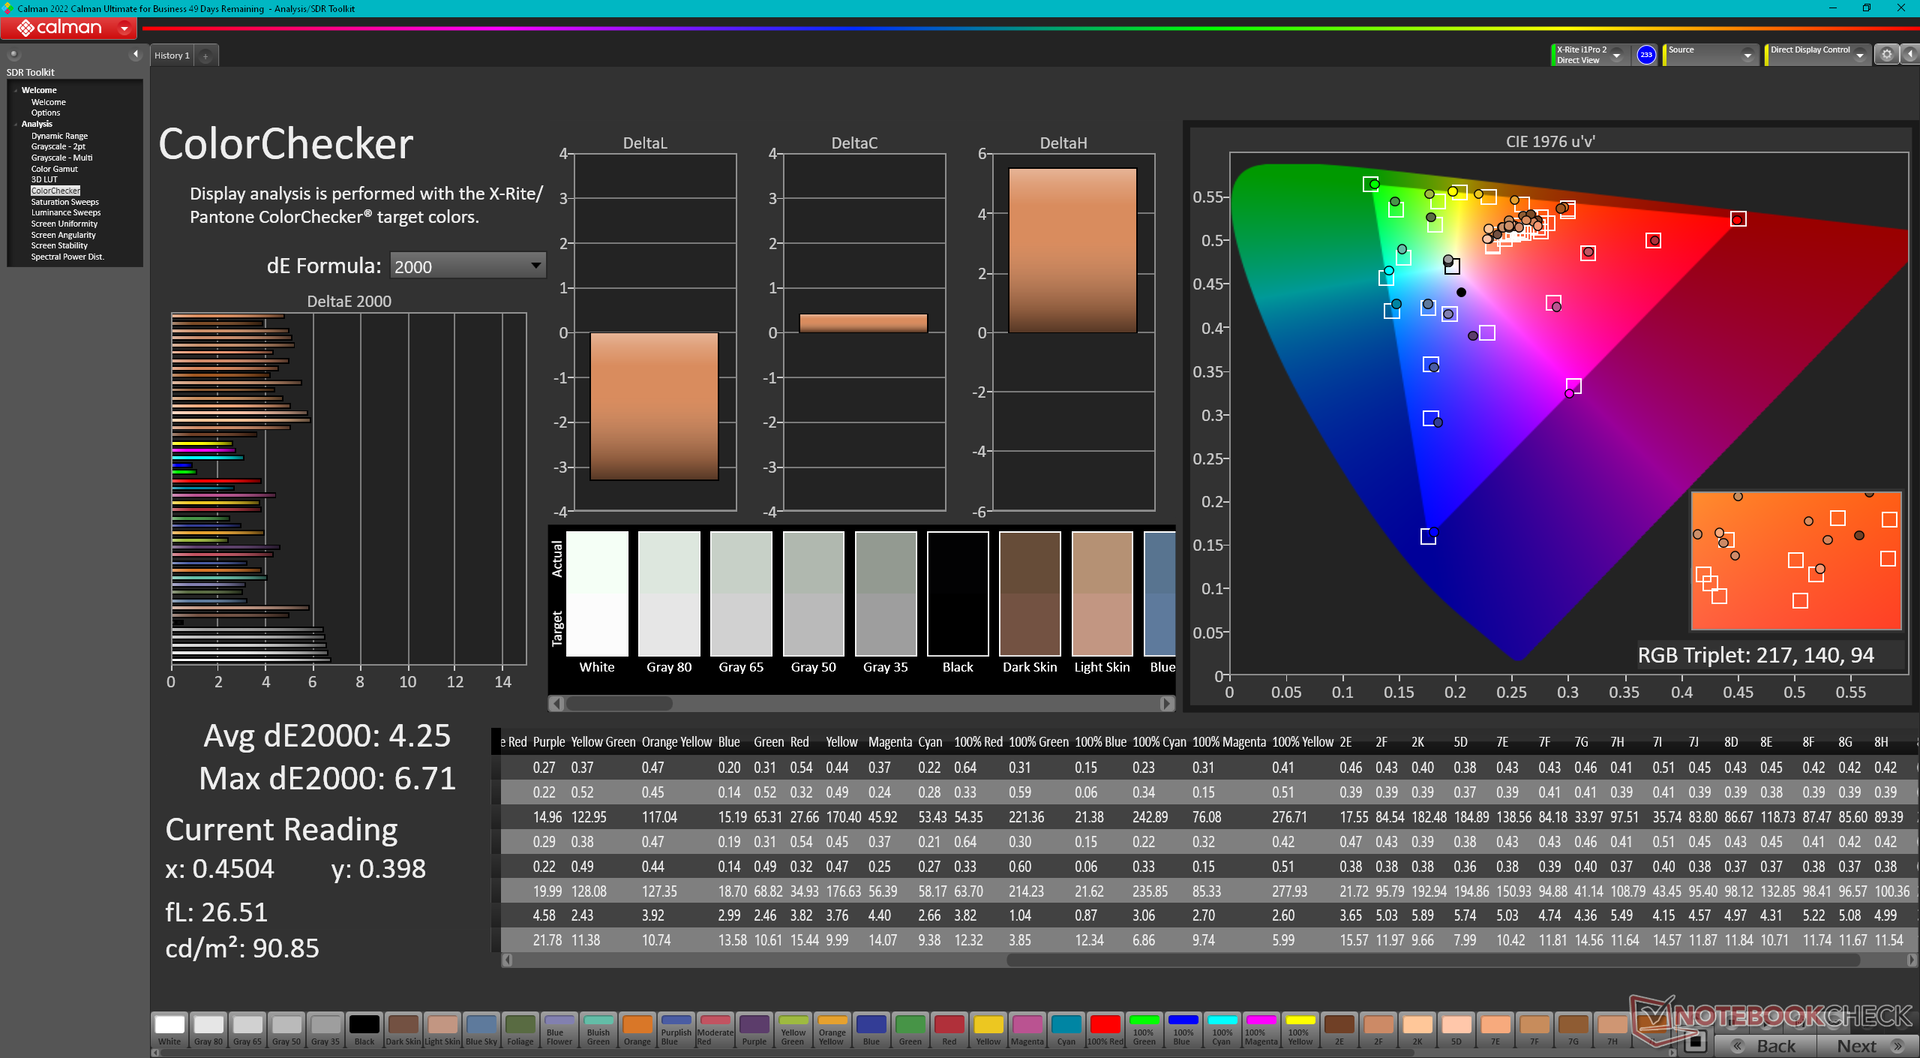
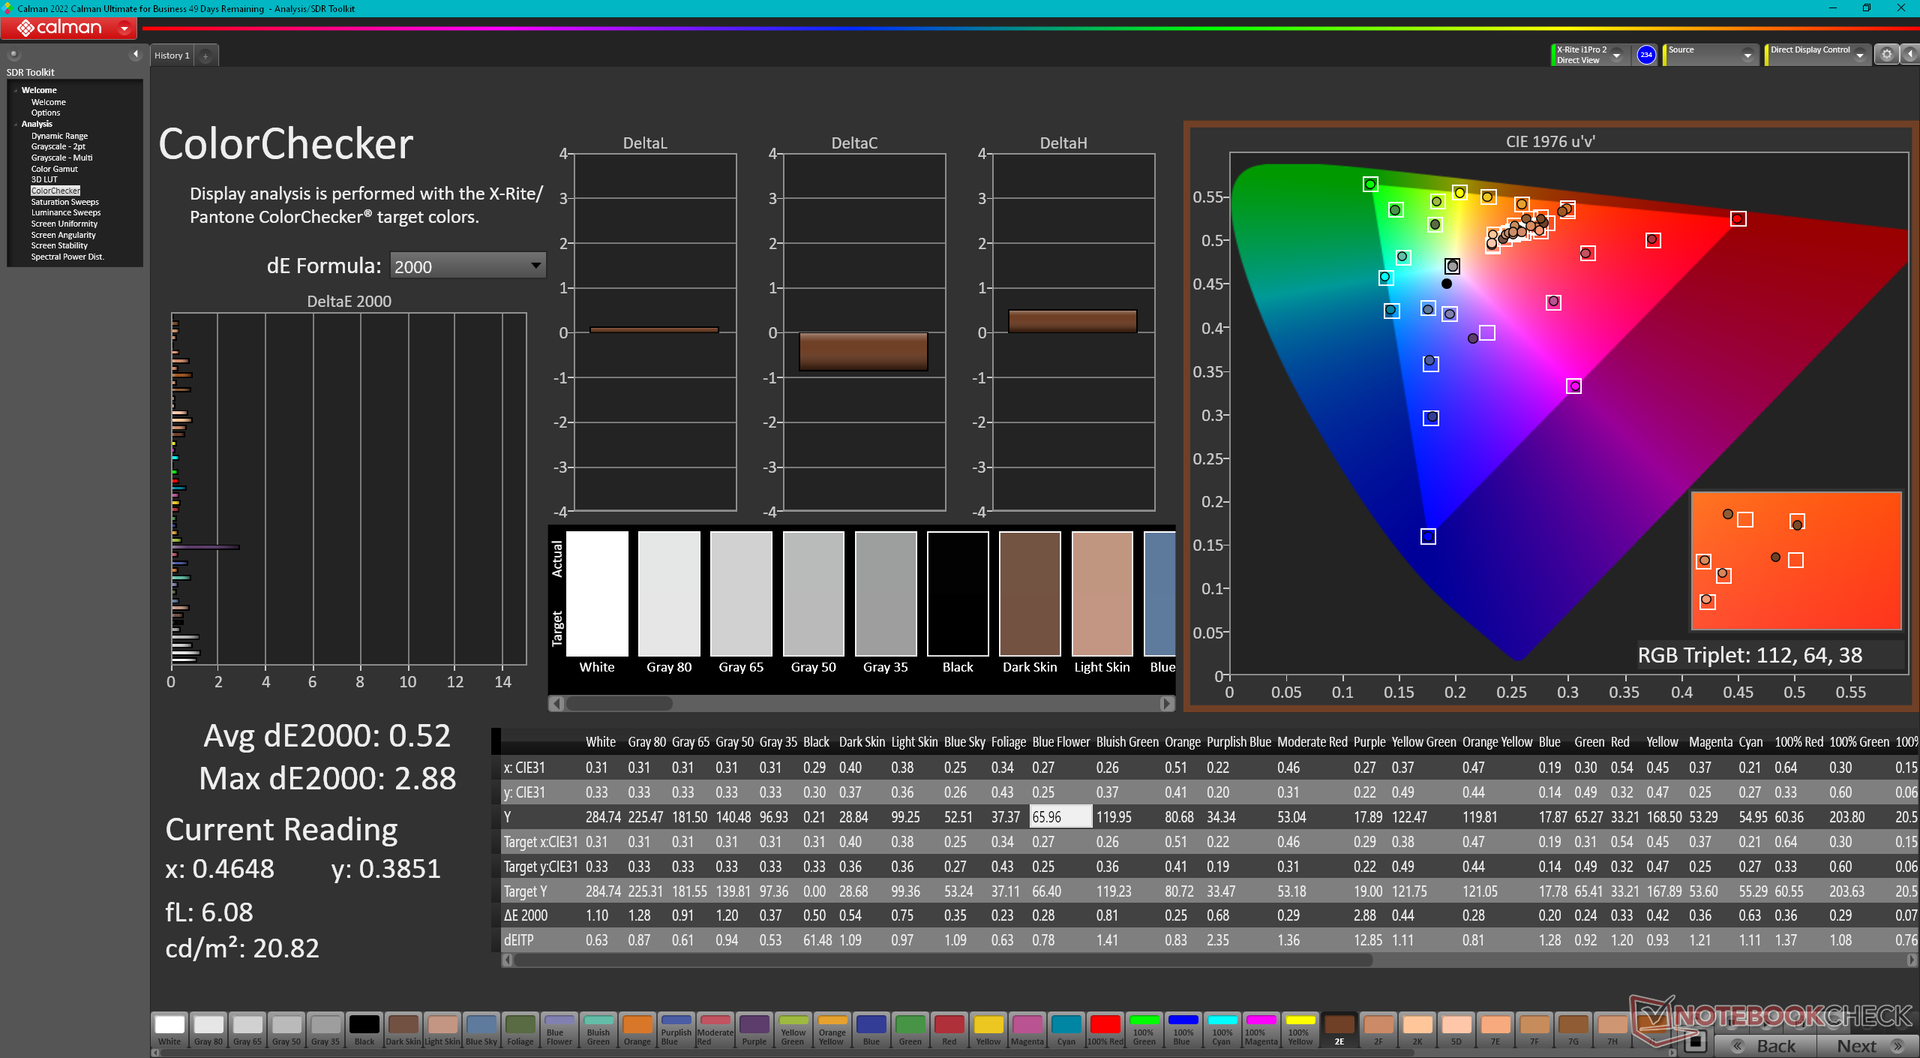
ΔE ColorChecker Calman: 4.25 | ∀{0.5-29.43 Ø4.71}
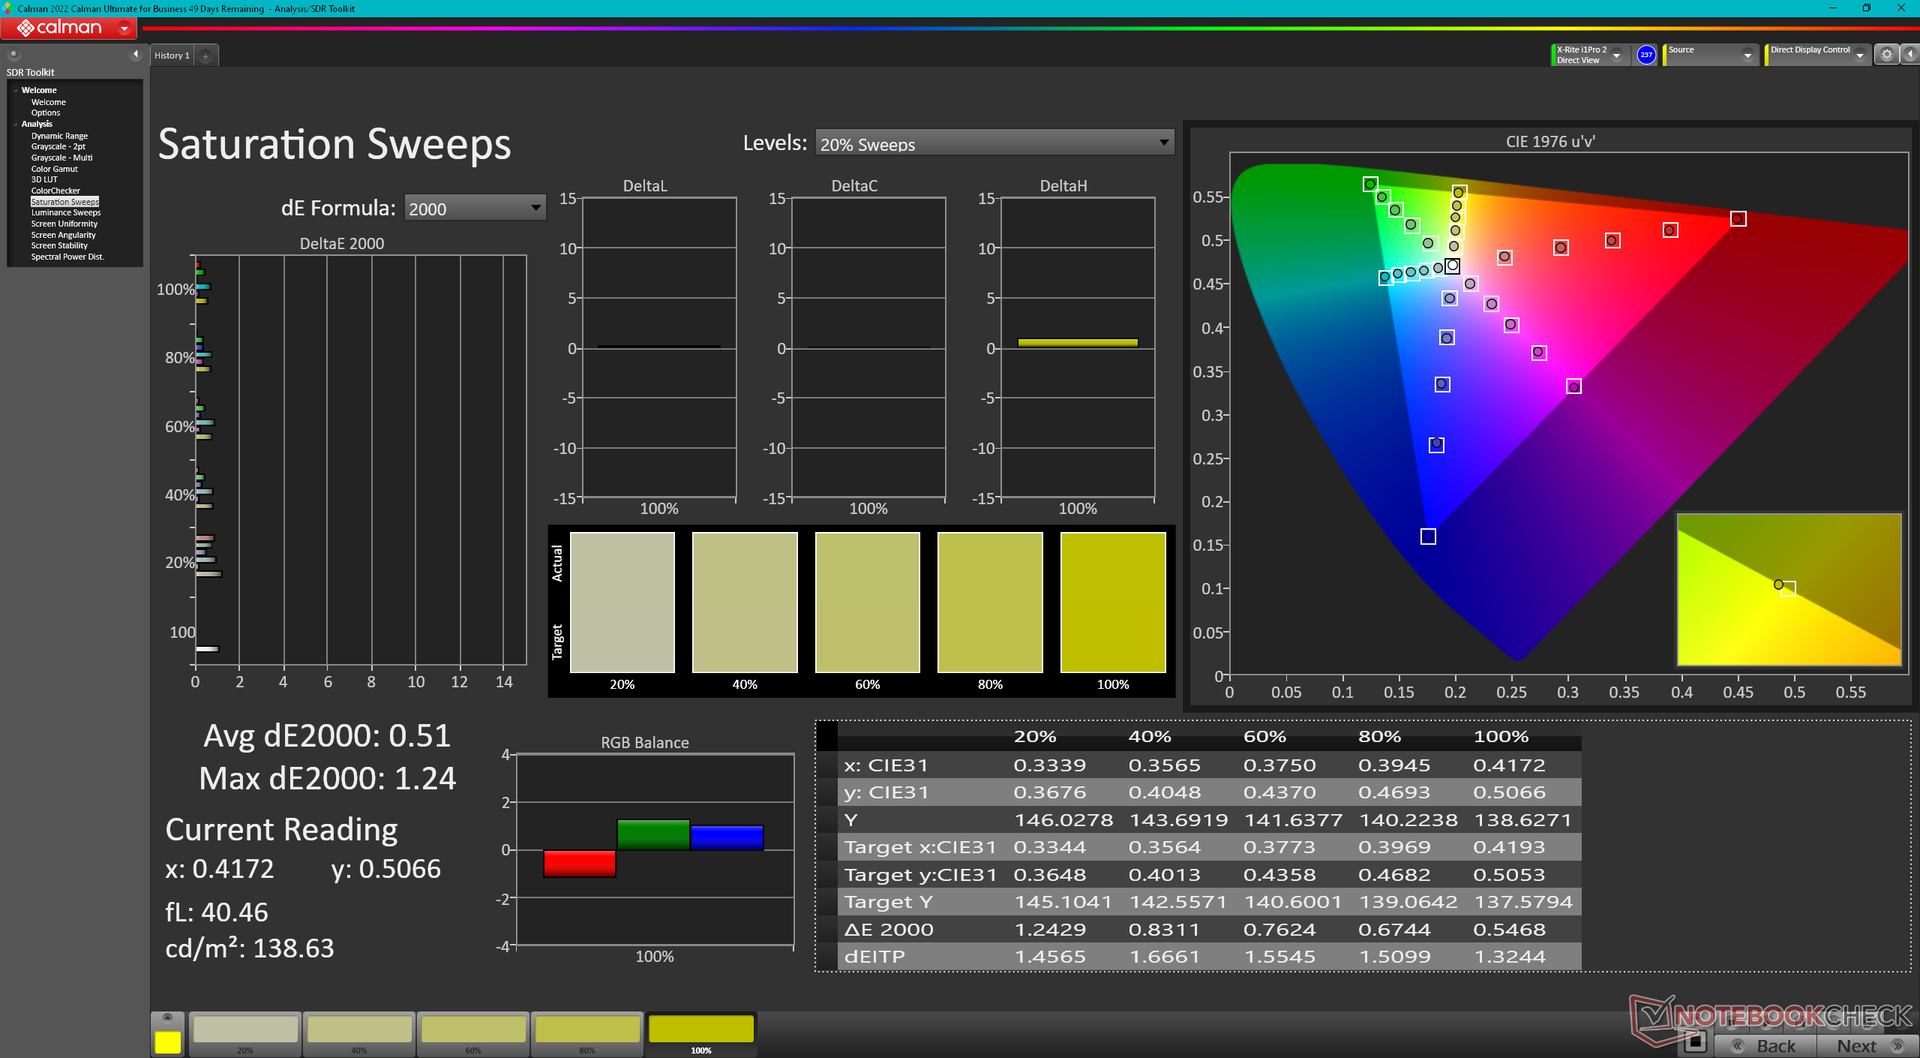
calibrated: 0.52
ΔE Greyscale Calman: 5.5 | ∀{0.09-98 Ø4.96}
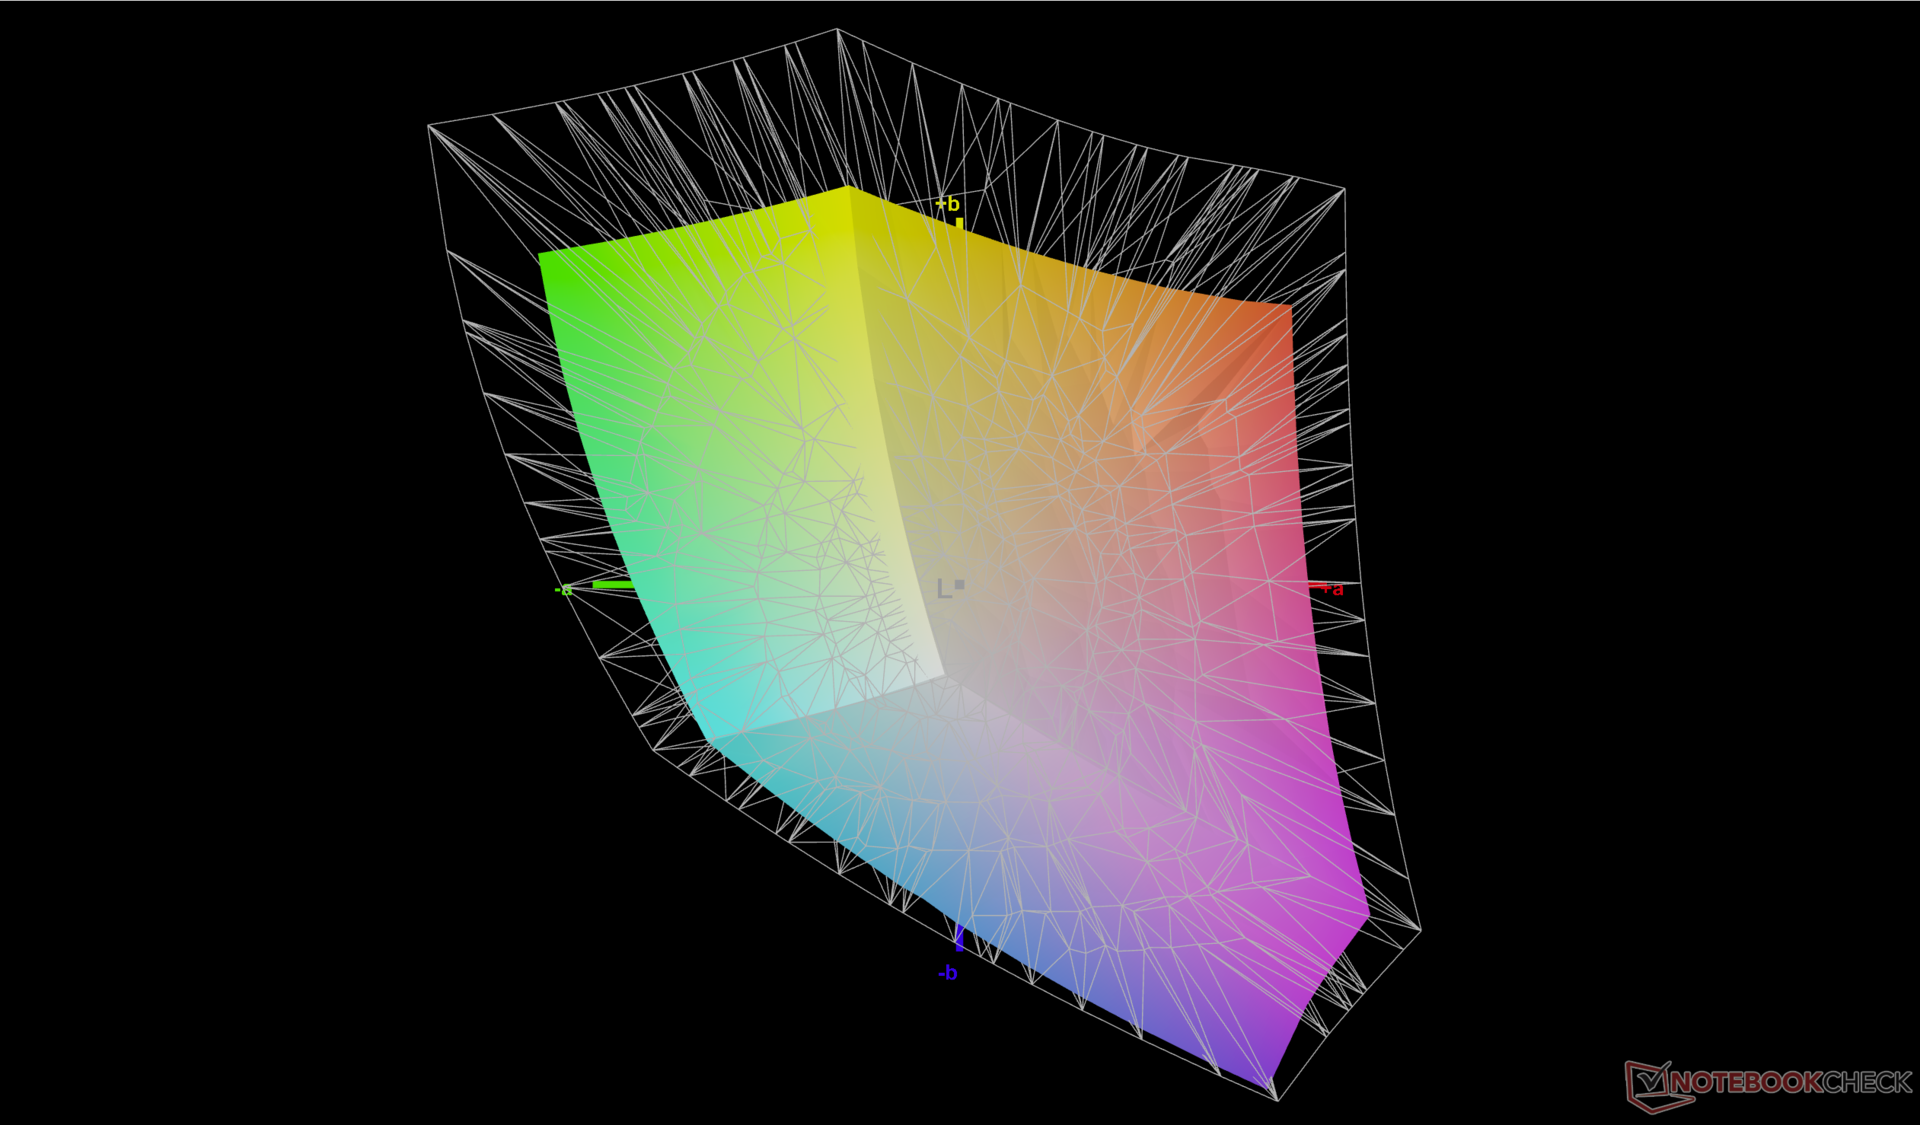
72.3% AdobeRGB 1998 (Argyll 3D)
99.6% sRGB (Argyll 3D)
70.1% Display P3 (Argyll 3D)
Gamma: 2.35
CCT: 6368 K
| Dell Inspiron 16 Plus 7630 LG Philips 160WQ2, IPS, 2560x1600, 16" | Dell Inspiron 16 Plus 7620 BOE NE16N41, IPS, 3072x1920, 16" | Lenovo Slim Pro 9i 16IRP8 LEN160-3.2K, Mini-LED, 3200x2000, 16" | Asus Vivobook Pro 16X K6604JV-MX016W Samsung SDC4178 ATNA60BX01-1, OLED, 3200x2000, 16" | HP Envy 16 h0112nr Samsung SDC4174, OLED, 3840x2400, 16" | MSI Summit E16 Flip A12UDT-031 AU Optronics B16QAN02.N, IPS, 2560x1600, 16" | |
|---|---|---|---|---|---|---|
| Display | 1% | 18% | 24% | 21% | 20% | |
| Display P3 Coverage (%) | 70.1 | 70.8 1% | 95.1 36% | 98.4 40% | 99.3 42% | 98.9 41% |
| sRGB Coverage (%) | 99.6 | 99.5 0% | 99.9 0% | 99.7 0% | 100 0% | 100 0% |
| AdobeRGB 1998 Coverage (%) | 72.3 | 73.2 1% | 84.6 17% | 95.8 33% | 88 22% | 86.5 20% |
| Response Times | -13% | 61% | 95% | 93% | 63% | |
| Response Time Grey 50% / Grey 80% * (ms) | 35 ? | 38 ? -9% | 14 ? 60% | 1.6 ? 95% | 2 ? 94% | 13 ? 63% |
| Response Time Black / White * (ms) | 24.2 ? | 28 ? -16% | 9.2 ? 62% | 1.4 ? 94% | 1.9 ? 92% | 9 ? 63% |
| PWM Frequency (Hz) | 5784 ? | 120 ? | 240.4 ? | |||
| Параметры экрана | 14% | -55% | 35% | 30% | -5% | |
| Яркость в центре (cd/m²) | 299.4 | 288.9 -4% | 627.4 110% | 347 16% | 328.8 10% | 314 5% |
| Brightness (cd/m²) | 290 | 276 -5% | 618 113% | 346 19% | 332 14% | 294 1% |
| Brightness Distribution (%) | 92 | 92 0% | 95 3% | 97 5% | 97 5% | 89 -3% |
| Уровень чёрного * (cd/m²) | 0.21 | 0.26 -24% | 0.19 10% | 0.06 71% | 0.28 -33% | |
| Контрастность (:1) | 1426 | 1111 -22% | 3302 132% | 5783 306% | 1121 -21% | |
| Colorchecker Delta E * | 4.25 | 1.88 56% | 5.84 -37% | 1.89 56% | 1.53 64% | 3.08 28% |
| Colorchecker dE 2000 max. * | 6.71 | 4.37 35% | 10.22 -52% | 3.26 51% | 6.04 10% | 5.49 18% |
| Colorchecker dE 2000 calibrated * | 0.52 | 0.42 19% | 4.45 -756% | 1.97 -279% | 0.88 -69% | |
| Delta E для серого * | 5.5 | 1.4 75% | 6.7 -22% | 1.55 72% | 1.3 76% | 3.99 27% |
| Гамма | 2.35 94% | 2.3 96% | 2.77 79% | 2.39 92% | 2.18 101% | 2.3 96% |
| CCT | 6368 102% | 6634 98% | 5795 112% | 6458 101% | 6362 102% | 6219 105% |
| Среднее значение | 1% /
8% | 8% /
-23% | 51% /
41% | 48% /
39% | 26% /
10% |
* ... меньше = лучше
Заводская калибровка экрана не проводилась, так как значения DeltaE составляют 5.5 для цвета и 4.25 для оттенков серого. Цветовая температура теплее нормы и составляет 6368K. С помощью самостоятельно калибровки спектрофотометром X-Rite и ПО CalMAN нам удалось существенно улучшить показатели. Наш цветовой профиль можно скачать бесплатно в таблице с параметрами дисплея выше.
Дисплей: тест на время отклика
| ↔ Перемена цвета пикселей, чёрный - белый (1) и белый - чёрный (2) | ||
|---|---|---|
| 24.2 ms ... стадия 1 ↗ и стадия 2 ↘ в сумме | ↗ 10.8 ms стадия 1 | 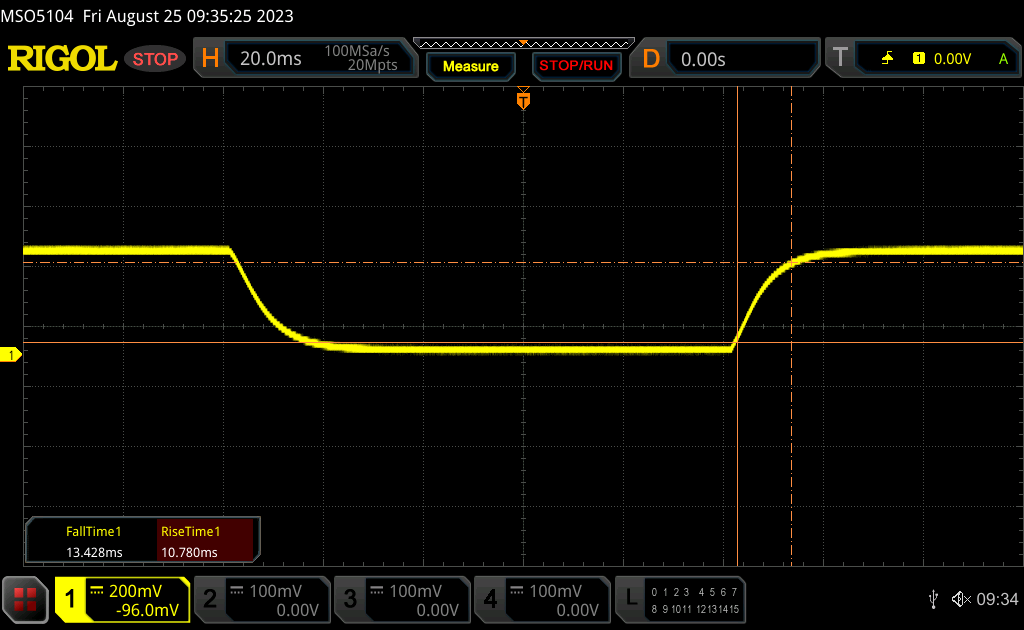 |
| ↘ 13.4 ms стадия 2 | ||
| Это неплохое время отклика. Оно подходит для игр и подобных применений, хоть и не идеально. Для сравнения, самый лучший результат среди всех известных нам устройств равен 0.1 миллисек., самый худший - 240 миллисек. » 57% экранов из нашей базы данных показали более хороший результат. Таким образом, тестируемое устройство находится в нижней половине рейтинга (оно отстаёт от среднего результата, равного 19.8 миллисек.) | ||
| ↔ Перемена цвета пикселей, серый 50% - серый 80% (1) и серый 80% - серый 50% (2) | ||
| 35 ms ... стадия 1 ↗ и стадия 2 ↘ в сумме | ↗ 15.7 ms стадия 1 | 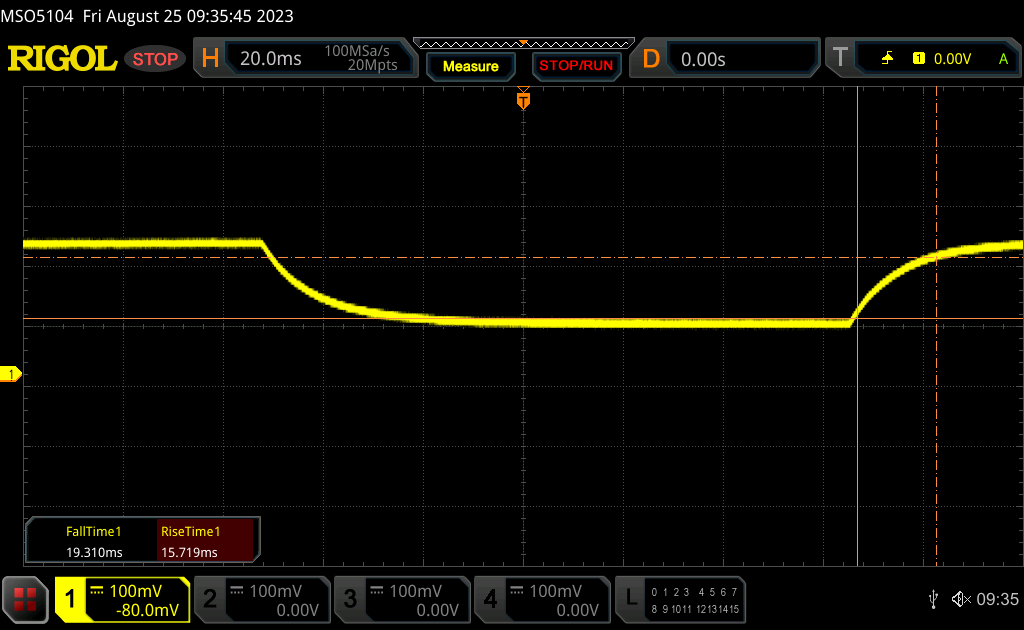 |
| ↘ 19.3 ms стадия 2 | ||
| Это очень большое время отклика. Экран явно не ориентирован на игры и подобные применения. Для сравнения, самый лучший результат среди всех известных нам устройств равен 0.165 миллисек., самый худший - 636 миллисек. » 49% экранов из нашей базы данных показали более хороший результат. Таким образом, тестируемое устройство находится в нижней половине рейтинга (оно отстаёт от среднего результата, равного 31 миллисек.) | ||
Тест на мерцание
| Ура! ШИМ не обнаружено | 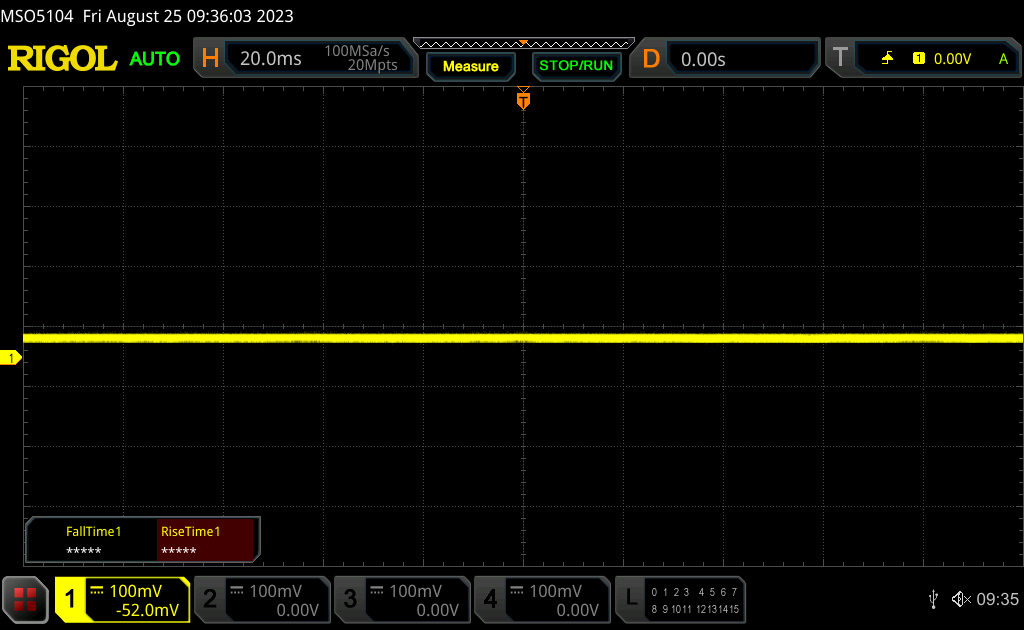 | ||
Для сравнения, 52 % известных нам устройств не применяют PWM для изменения яркости, а среди тех, где PWM используется, типичная частота модуляции составляет 7757 Гц (мин. 5 Гц, макс. 343500 Гц). | |||
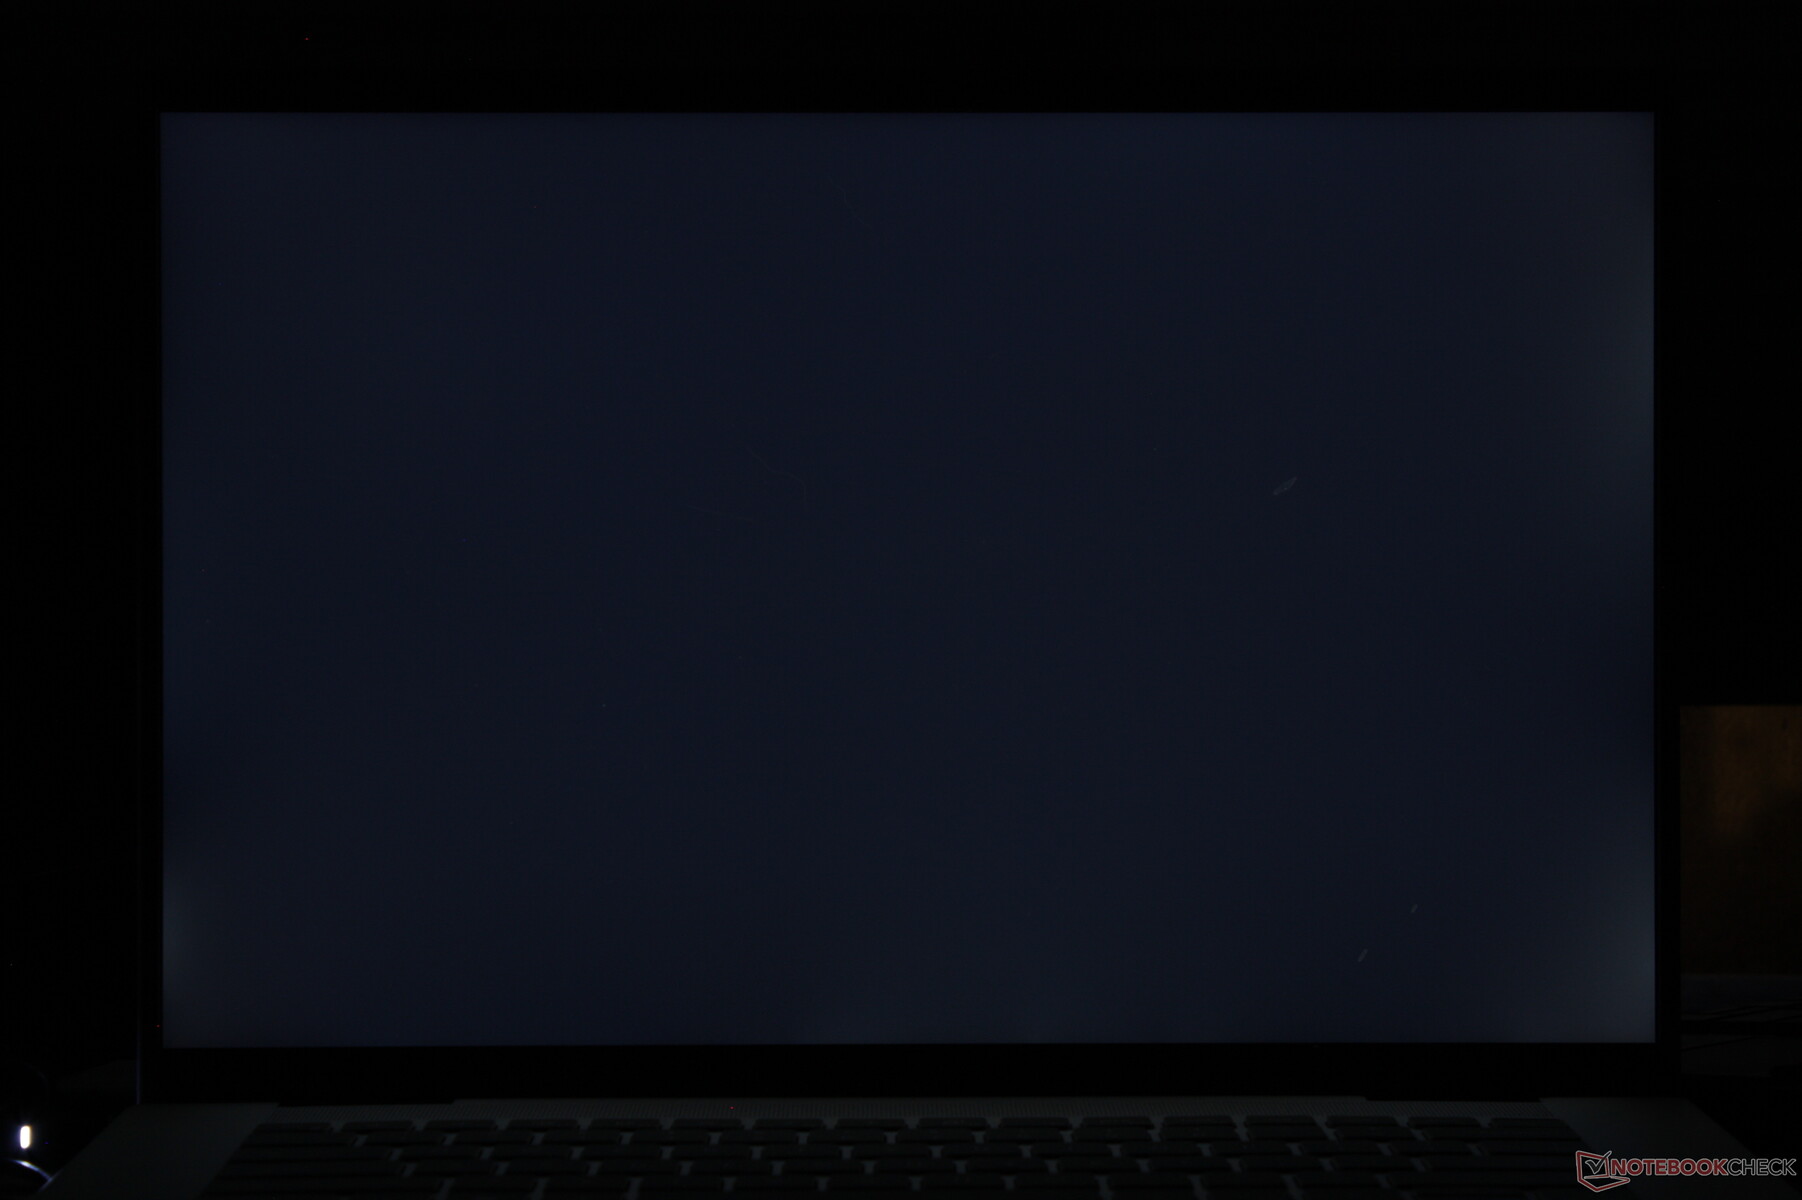
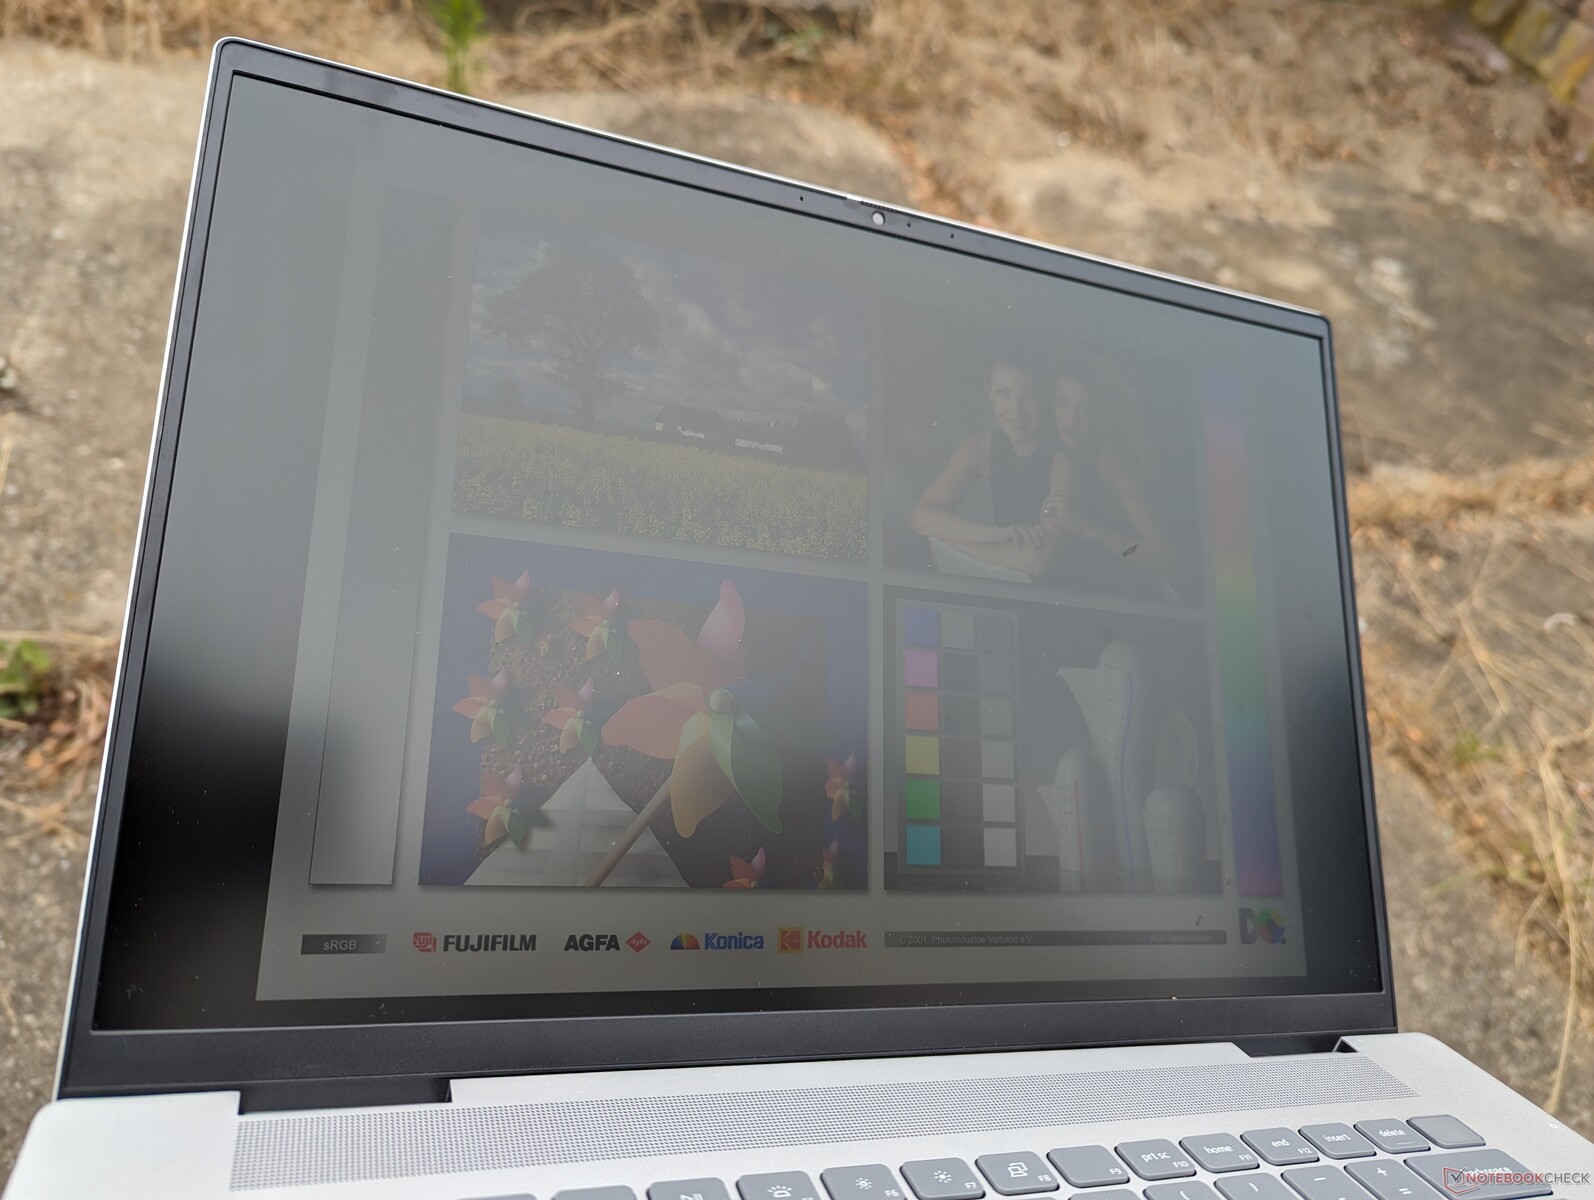
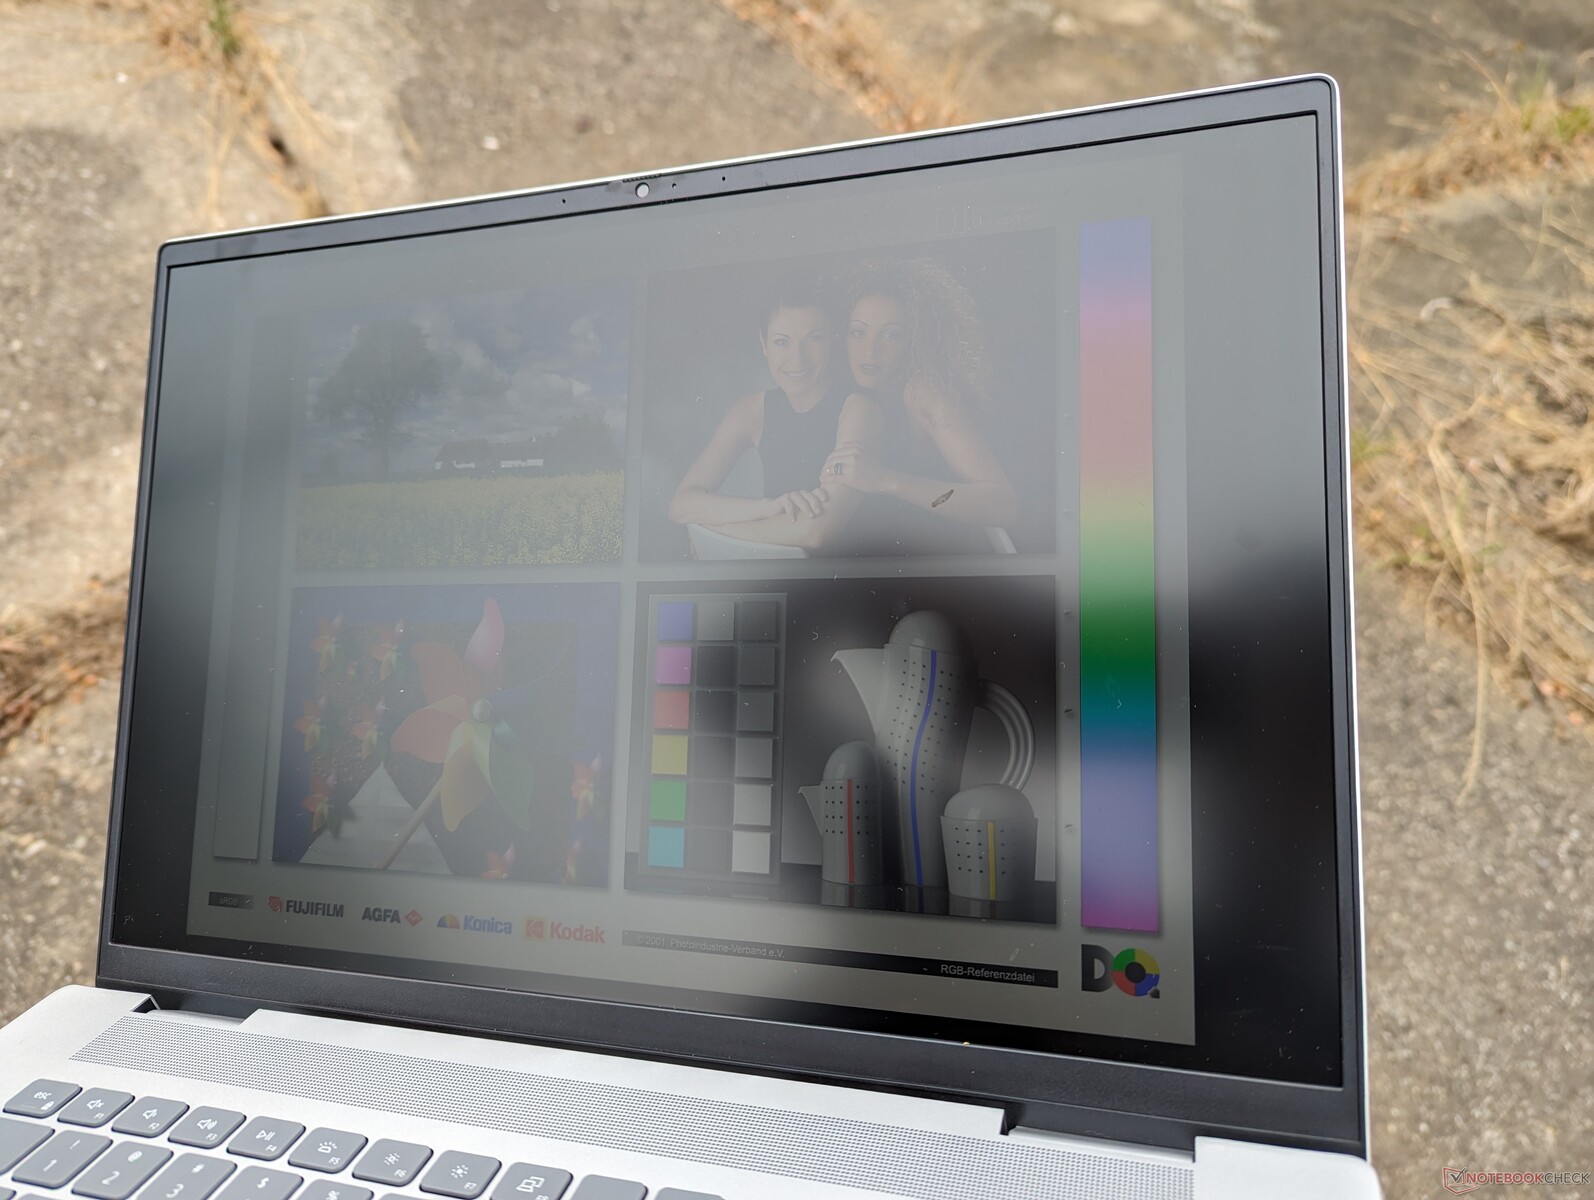
Читабельность экрана такая же, как у прошлогодней модели и нормальная только при отсутствии бликов. Мультимедийные ноутбуки с mini-LED и OLED экранами, такие как Yoga 9i 16 и Razer Blade 16, дают лучшую читабельность на улице, но они также гораздо дороже Dell.
Производительность
Параметры тестирования
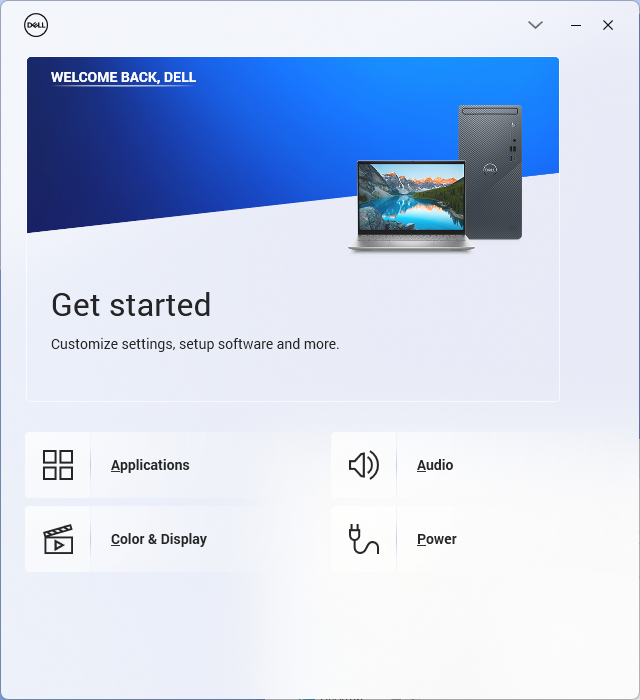
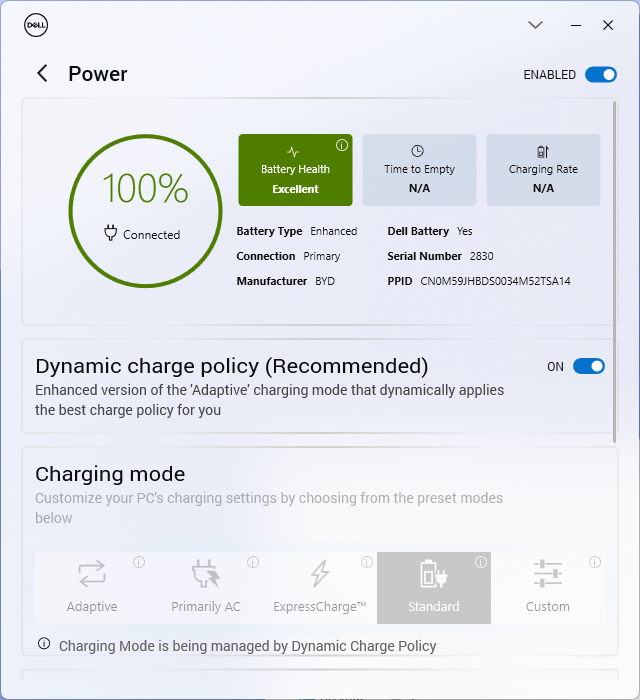
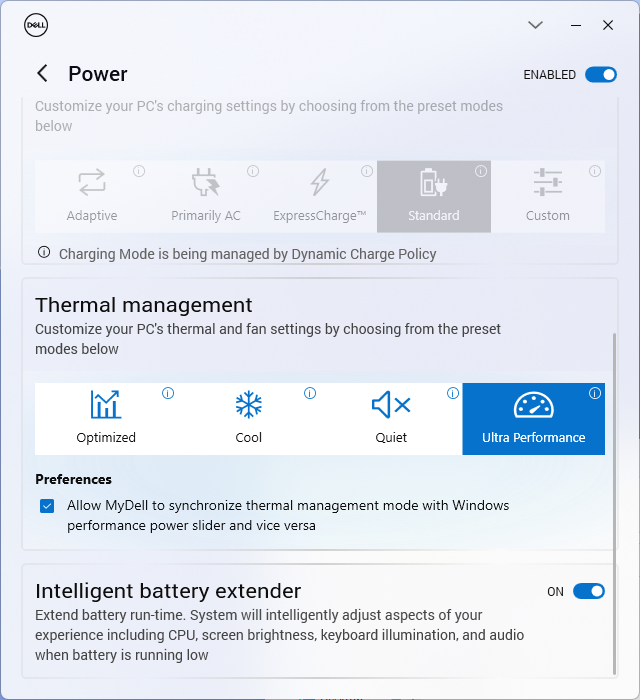
Для проведения тестов мы выставили профиль Performance в предустановленном приложении MyDell. Профили в данном приложении синхронизированы со схемами электропитания Windows, что исключает неоптимальные настройки.
Inspiron не поддерживает Advanced Optimus и MUX, которые обычно присущи игровым моделям Dell G-серии и Alienware.
Процессор
Производительность процессора Intel Core i7-13700H всего на 10% выше, чем у предыдущего Core i7-12700H. Разница в основном заметна при краткосрочных нагрузках, тогда как в многопоточном тесте CineBench R15, что запущен на длительное время, результаты сравниваются. Все это делает Inspiron 16 Plus 7630 лишь минимально быстрее прошлогодней модели по производительности процессора.
Выбор в пользу конфигурации на Core i5-13500H принесет 10% потерю производительности - наша оценка базируется на тестах Asus VivoBook 14X. В то же время, модель на AMD Ryzen 7 7840HS, по нашим ожиданиям, должна быть наравне с Core i7-13700H.
Многопоточный тест CB15
Cinebench R23: Multi Core | Single Core
Cinebench R20: CPU (Multi Core) | CPU (Single Core)
Cinebench R15: CPU Multi 64Bit | CPU Single 64Bit
Blender: v2.79 BMW27 CPU
7-Zip 18.03: 7z b 4 | 7z b 4 -mmt1
Geekbench 5.5: Multi-Core | Single-Core
HWBOT x265 Benchmark v2.2: 4k Preset
LibreOffice : 20 Documents To PDF
R Benchmark 2.5: Overall mean
* ... меньше = лучше
AIDA64: FP32 Ray-Trace | FPU Julia | CPU SHA3 | CPU Queen | FPU SinJulia | FPU Mandel | CPU AES | CPU ZLib | FP64 Ray-Trace | CPU PhotoWorxx
| Performance rating | |
| Asus Vivobook Pro 16X K6604JV-MX016W | |
| Lenovo Slim Pro 9i 16IRP8 | |
| Усредн. модель с Intel Core i7-13700H | |
| Dell Inspiron 16 Plus 7630 | |
| MSI Summit E16 Flip A12UDT-031 | |
| HP Envy 16 h0112nr | |
| Dell Inspiron 16 Plus 7620 | |
| AIDA64 / FP32 Ray-Trace | |
| Asus Vivobook Pro 16X K6604JV-MX016W | |
| Lenovo Slim Pro 9i 16IRP8 | |
| Усредн. модель с Intel Core i7-13700H (4986 - 18908, n=29) | |
| Dell Inspiron 16 Plus 7630 | |
| MSI Summit E16 Flip A12UDT-031 | |
| Dell Inspiron 16 Plus 7620 | |
| HP Envy 16 h0112nr | |
| AIDA64 / FPU Julia | |
| Asus Vivobook Pro 16X K6604JV-MX016W | |
| Lenovo Slim Pro 9i 16IRP8 | |
| Усредн. модель с Intel Core i7-13700H (25360 - 92359, n=29) | |
| Dell Inspiron 16 Plus 7630 | |
| MSI Summit E16 Flip A12UDT-031 | |
| Dell Inspiron 16 Plus 7620 | |
| HP Envy 16 h0112nr | |
| AIDA64 / CPU SHA3 | |
| Asus Vivobook Pro 16X K6604JV-MX016W | |
| Lenovo Slim Pro 9i 16IRP8 | |
| Усредн. модель с Intel Core i7-13700H (1339 - 4224, n=29) | |
| Dell Inspiron 16 Plus 7630 | |
| MSI Summit E16 Flip A12UDT-031 | |
| Dell Inspiron 16 Plus 7620 | |
| HP Envy 16 h0112nr | |
| AIDA64 / CPU Queen | |
| Asus Vivobook Pro 16X K6604JV-MX016W | |
| Lenovo Slim Pro 9i 16IRP8 | |
| Dell Inspiron 16 Plus 7630 | |
| HP Envy 16 h0112nr | |
| MSI Summit E16 Flip A12UDT-031 | |
| Усредн. модель с Intel Core i7-13700H (59324 - 107159, n=29) | |
| Dell Inspiron 16 Plus 7620 | |
| AIDA64 / FPU SinJulia | |
| Asus Vivobook Pro 16X K6604JV-MX016W | |
| Lenovo Slim Pro 9i 16IRP8 | |
| Dell Inspiron 16 Plus 7630 | |
| Усредн. модель с Intel Core i7-13700H (4800 - 11050, n=29) | |
| MSI Summit E16 Flip A12UDT-031 | |
| Dell Inspiron 16 Plus 7620 | |
| HP Envy 16 h0112nr | |
| AIDA64 / FPU Mandel | |
| Asus Vivobook Pro 16X K6604JV-MX016W | |
| Lenovo Slim Pro 9i 16IRP8 | |
| Усредн. модель с Intel Core i7-13700H (12321 - 45118, n=29) | |
| Dell Inspiron 16 Plus 7630 | |
| MSI Summit E16 Flip A12UDT-031 | |
| Dell Inspiron 16 Plus 7620 | |
| HP Envy 16 h0112nr | |
| AIDA64 / CPU AES | |
| HP Envy 16 h0112nr | |
| Asus Vivobook Pro 16X K6604JV-MX016W | |
| Lenovo Slim Pro 9i 16IRP8 | |
| Усредн. модель с Intel Core i7-13700H (28769 - 151254, n=29) | |
| Dell Inspiron 16 Plus 7620 | |
| MSI Summit E16 Flip A12UDT-031 | |
| Dell Inspiron 16 Plus 7630 | |
| AIDA64 / CPU ZLib | |
| Asus Vivobook Pro 16X K6604JV-MX016W | |
| Lenovo Slim Pro 9i 16IRP8 | |
| Dell Inspiron 16 Plus 7620 | |
| Усредн. модель с Intel Core i7-13700H (389 - 1215, n=29) | |
| MSI Summit E16 Flip A12UDT-031 | |
| Dell Inspiron 16 Plus 7630 | |
| HP Envy 16 h0112nr | |
| AIDA64 / FP64 Ray-Trace | |
| Asus Vivobook Pro 16X K6604JV-MX016W | |
| Lenovo Slim Pro 9i 16IRP8 | |
| Усредн. модель с Intel Core i7-13700H (2540 - 10135, n=29) | |
| Dell Inspiron 16 Plus 7630 | |
| MSI Summit E16 Flip A12UDT-031 | |
| Dell Inspiron 16 Plus 7620 | |
| HP Envy 16 h0112nr | |
| AIDA64 / CPU PhotoWorxx | |
| Lenovo Slim Pro 9i 16IRP8 | |
| Asus Vivobook Pro 16X K6604JV-MX016W | |
| MSI Summit E16 Flip A12UDT-031 | |
| Усредн. модель с Intel Core i7-13700H (12872 - 52727, n=29) | |
| Dell Inspiron 16 Plus 7630 | |
| HP Envy 16 h0112nr | |
| Dell Inspiron 16 Plus 7620 | |
Общая производительность
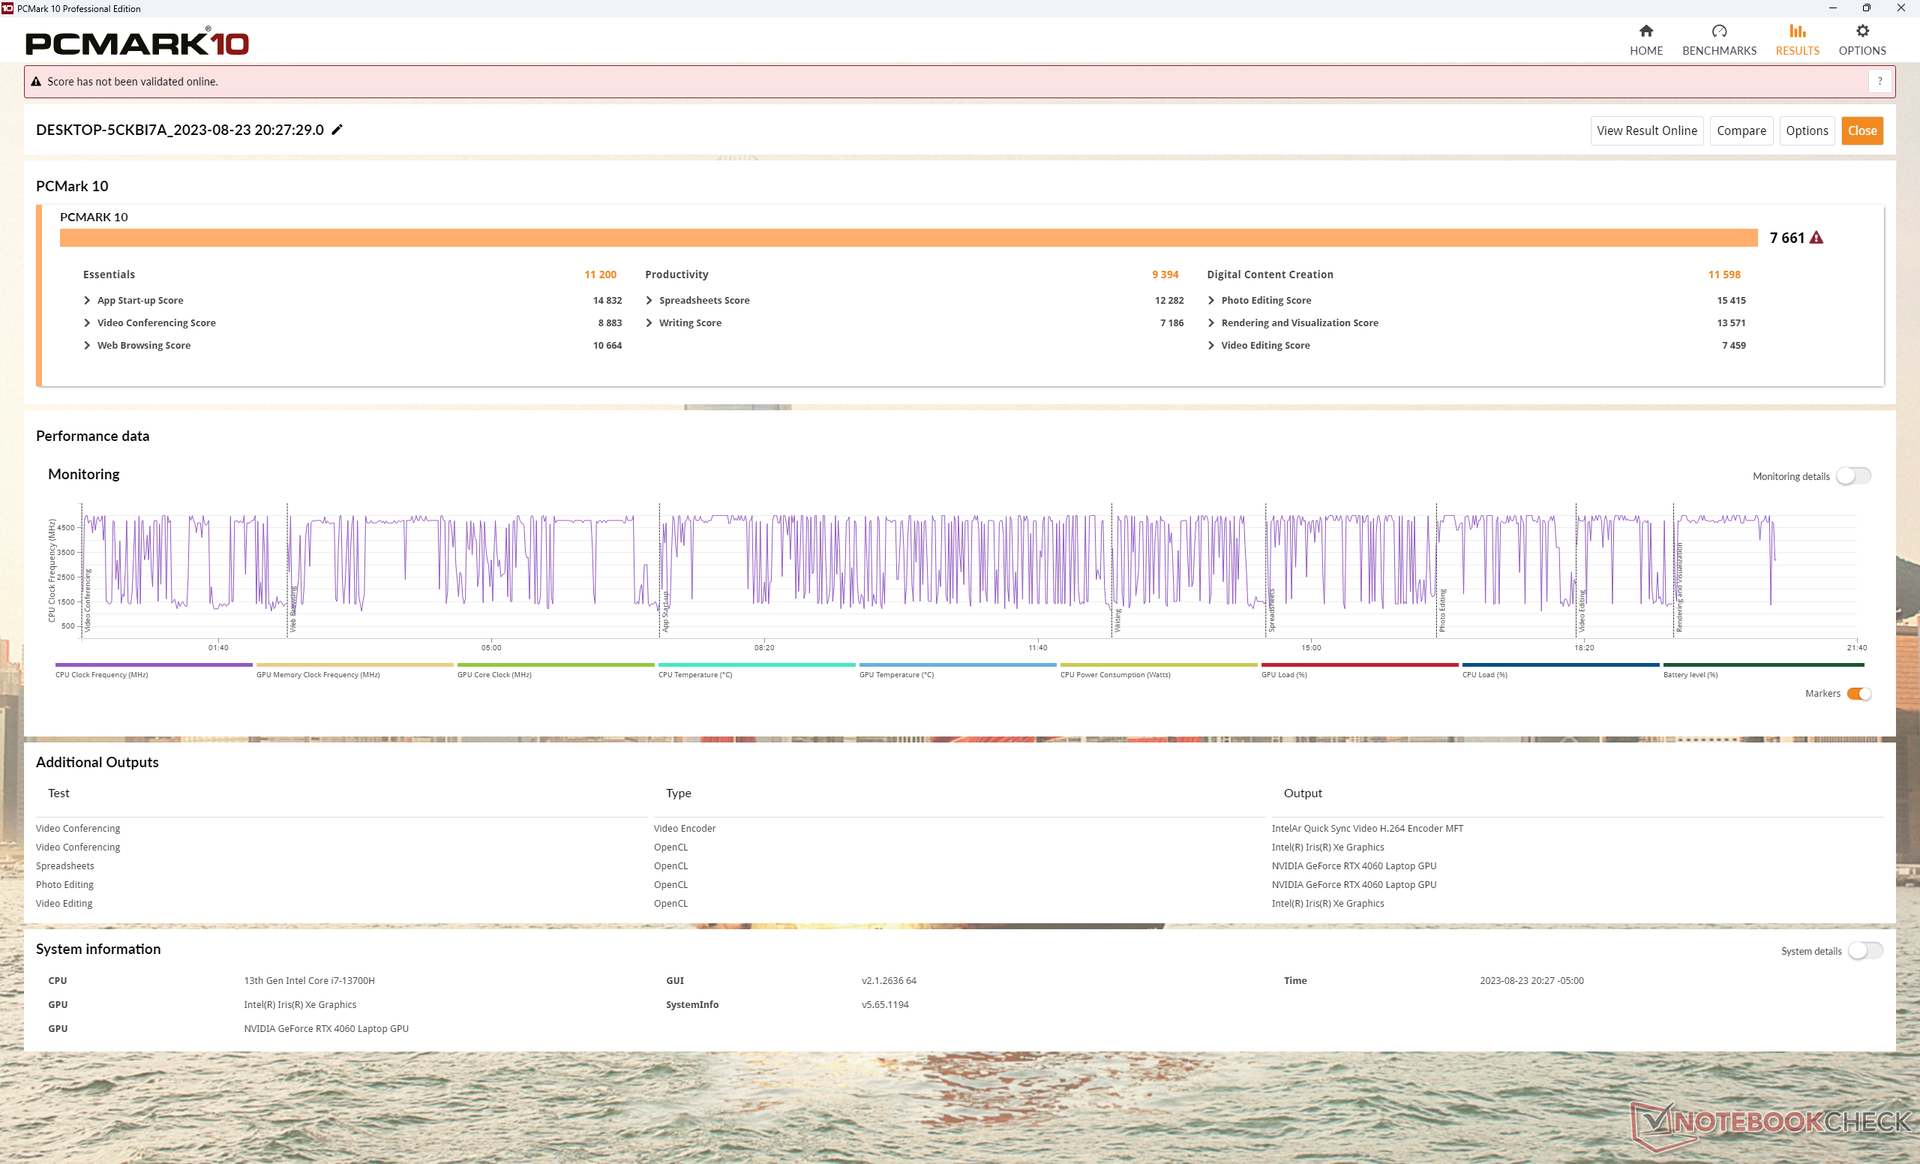
Оценки в PCMark выше чем у прошлогоднего Inspiron 16 Plus 7620, особенно в субтесте Digital Content Creation, который сильно зависит от видеокарты.
За время тестирования ноутбука мы не столкнулись с проблемами в работе системы, такими как синий экран смерти, что наблюдался у Alienware m16 R1.
CrossMark: Overall | Productivity | Creativity | Responsiveness
| PCMark 10 / Score | |
| Lenovo Slim Pro 9i 16IRP8 | |
| Dell Inspiron 16 Plus 7630 | |
| HP Envy 16 h0112nr | |
| Усредн. модель с Intel Core i7-13700H, NVIDIA GeForce RTX 4060 Laptop GPU (7157 - 7661, n=5) | |
| Asus Vivobook Pro 16X K6604JV-MX016W | |
| Dell Inspiron 16 Plus 7620 | |
| MSI Summit E16 Flip A12UDT-031 | |
| PCMark 10 / Essentials | |
| HP Envy 16 h0112nr | |
| Lenovo Slim Pro 9i 16IRP8 | |
| Dell Inspiron 16 Plus 7630 | |
| Усредн. модель с Intel Core i7-13700H, NVIDIA GeForce RTX 4060 Laptop GPU (10179 - 11200, n=5) | |
| Asus Vivobook Pro 16X K6604JV-MX016W | |
| Dell Inspiron 16 Plus 7620 | |
| MSI Summit E16 Flip A12UDT-031 | |
| PCMark 10 / Productivity | |
| Lenovo Slim Pro 9i 16IRP8 | |
| Усредн. модель с Intel Core i7-13700H, NVIDIA GeForce RTX 4060 Laptop GPU (8238 - 10249, n=5) | |
| Dell Inspiron 16 Plus 7630 | |
| HP Envy 16 h0112nr | |
| Dell Inspiron 16 Plus 7620 | |
| Asus Vivobook Pro 16X K6604JV-MX016W | |
| MSI Summit E16 Flip A12UDT-031 | |
| PCMark 10 / Digital Content Creation | |
| Dell Inspiron 16 Plus 7630 | |
| Lenovo Slim Pro 9i 16IRP8 | |
| Усредн. модель с Intel Core i7-13700H, NVIDIA GeForce RTX 4060 Laptop GPU (10308 - 11862, n=5) | |
| HP Envy 16 h0112nr | |
| Dell Inspiron 16 Plus 7620 | |
| Asus Vivobook Pro 16X K6604JV-MX016W | |
| MSI Summit E16 Flip A12UDT-031 | |
| CrossMark / Overall | |
| Asus Vivobook Pro 16X K6604JV-MX016W | |
| Dell Inspiron 16 Plus 7630 | |
| HP Envy 16 h0112nr | |
| Lenovo Slim Pro 9i 16IRP8 | |
| Dell Inspiron 16 Plus 7620 | |
| Усредн. модель с Intel Core i7-13700H, NVIDIA GeForce RTX 4060 Laptop GPU (1629 - 1849, n=5) | |
| MSI Summit E16 Flip A12UDT-031 | |
| CrossMark / Productivity | |
| Asus Vivobook Pro 16X K6604JV-MX016W | |
| Dell Inspiron 16 Plus 7630 | |
| HP Envy 16 h0112nr | |
| Dell Inspiron 16 Plus 7620 | |
| Lenovo Slim Pro 9i 16IRP8 | |
| Усредн. модель с Intel Core i7-13700H, NVIDIA GeForce RTX 4060 Laptop GPU (1561 - 1743, n=5) | |
| MSI Summit E16 Flip A12UDT-031 | |
| CrossMark / Creativity | |
| Asus Vivobook Pro 16X K6604JV-MX016W | |
| Lenovo Slim Pro 9i 16IRP8 | |
| Dell Inspiron 16 Plus 7630 | |
| HP Envy 16 h0112nr | |
| Dell Inspiron 16 Plus 7620 | |
| Усредн. модель с Intel Core i7-13700H, NVIDIA GeForce RTX 4060 Laptop GPU (1691 - 2064, n=5) | |
| MSI Summit E16 Flip A12UDT-031 | |
| CrossMark / Responsiveness | |
| Asus Vivobook Pro 16X K6604JV-MX016W | |
| HP Envy 16 h0112nr | |
| Dell Inspiron 16 Plus 7630 | |
| MSI Summit E16 Flip A12UDT-031 | |
| Dell Inspiron 16 Plus 7620 | |
| Усредн. модель с Intel Core i7-13700H, NVIDIA GeForce RTX 4060 Laptop GPU (1381 - 1656, n=5) | |
| Lenovo Slim Pro 9i 16IRP8 | |
| PCMark 10 Score | 7661 баллов | |
? | ||
| AIDA64 / Memory Copy | |
| Lenovo Slim Pro 9i 16IRP8 | |
| Asus Vivobook Pro 16X K6604JV-MX016W | |
| MSI Summit E16 Flip A12UDT-031 | |
| Усредн. модель с Intel Core i7-13700H (24334 - 78081, n=29) | |
| Dell Inspiron 16 Plus 7630 | |
| HP Envy 16 h0112nr | |
| Dell Inspiron 16 Plus 7620 | |
| AIDA64 / Memory Read | |
| Asus Vivobook Pro 16X K6604JV-MX016W | |
| Lenovo Slim Pro 9i 16IRP8 | |
| Dell Inspiron 16 Plus 7630 | |
| HP Envy 16 h0112nr | |
| MSI Summit E16 Flip A12UDT-031 | |
| Усредн. модель с Intel Core i7-13700H (23681 - 79656, n=29) | |
| Dell Inspiron 16 Plus 7620 | |
| AIDA64 / Memory Write | |
| Lenovo Slim Pro 9i 16IRP8 | |
| Asus Vivobook Pro 16X K6604JV-MX016W | |
| Усредн. модель с Intel Core i7-13700H (22986 - 99898, n=29) | |
| Dell Inspiron 16 Plus 7630 | |
| HP Envy 16 h0112nr | |
| MSI Summit E16 Flip A12UDT-031 | |
| Dell Inspiron 16 Plus 7620 | |
| AIDA64 / Memory Latency | |
| MSI Summit E16 Flip A12UDT-031 | |
| Lenovo Slim Pro 9i 16IRP8 | |
| Dell Inspiron 16 Plus 7620 | |
| Усредн. модель с Intel Core i7-13700H (82.4 - 136.8, n=29) | |
| Dell Inspiron 16 Plus 7630 | |
| HP Envy 16 h0112nr | |
| Asus Vivobook Pro 16X K6604JV-MX016W | |
* ... меньше = лучше
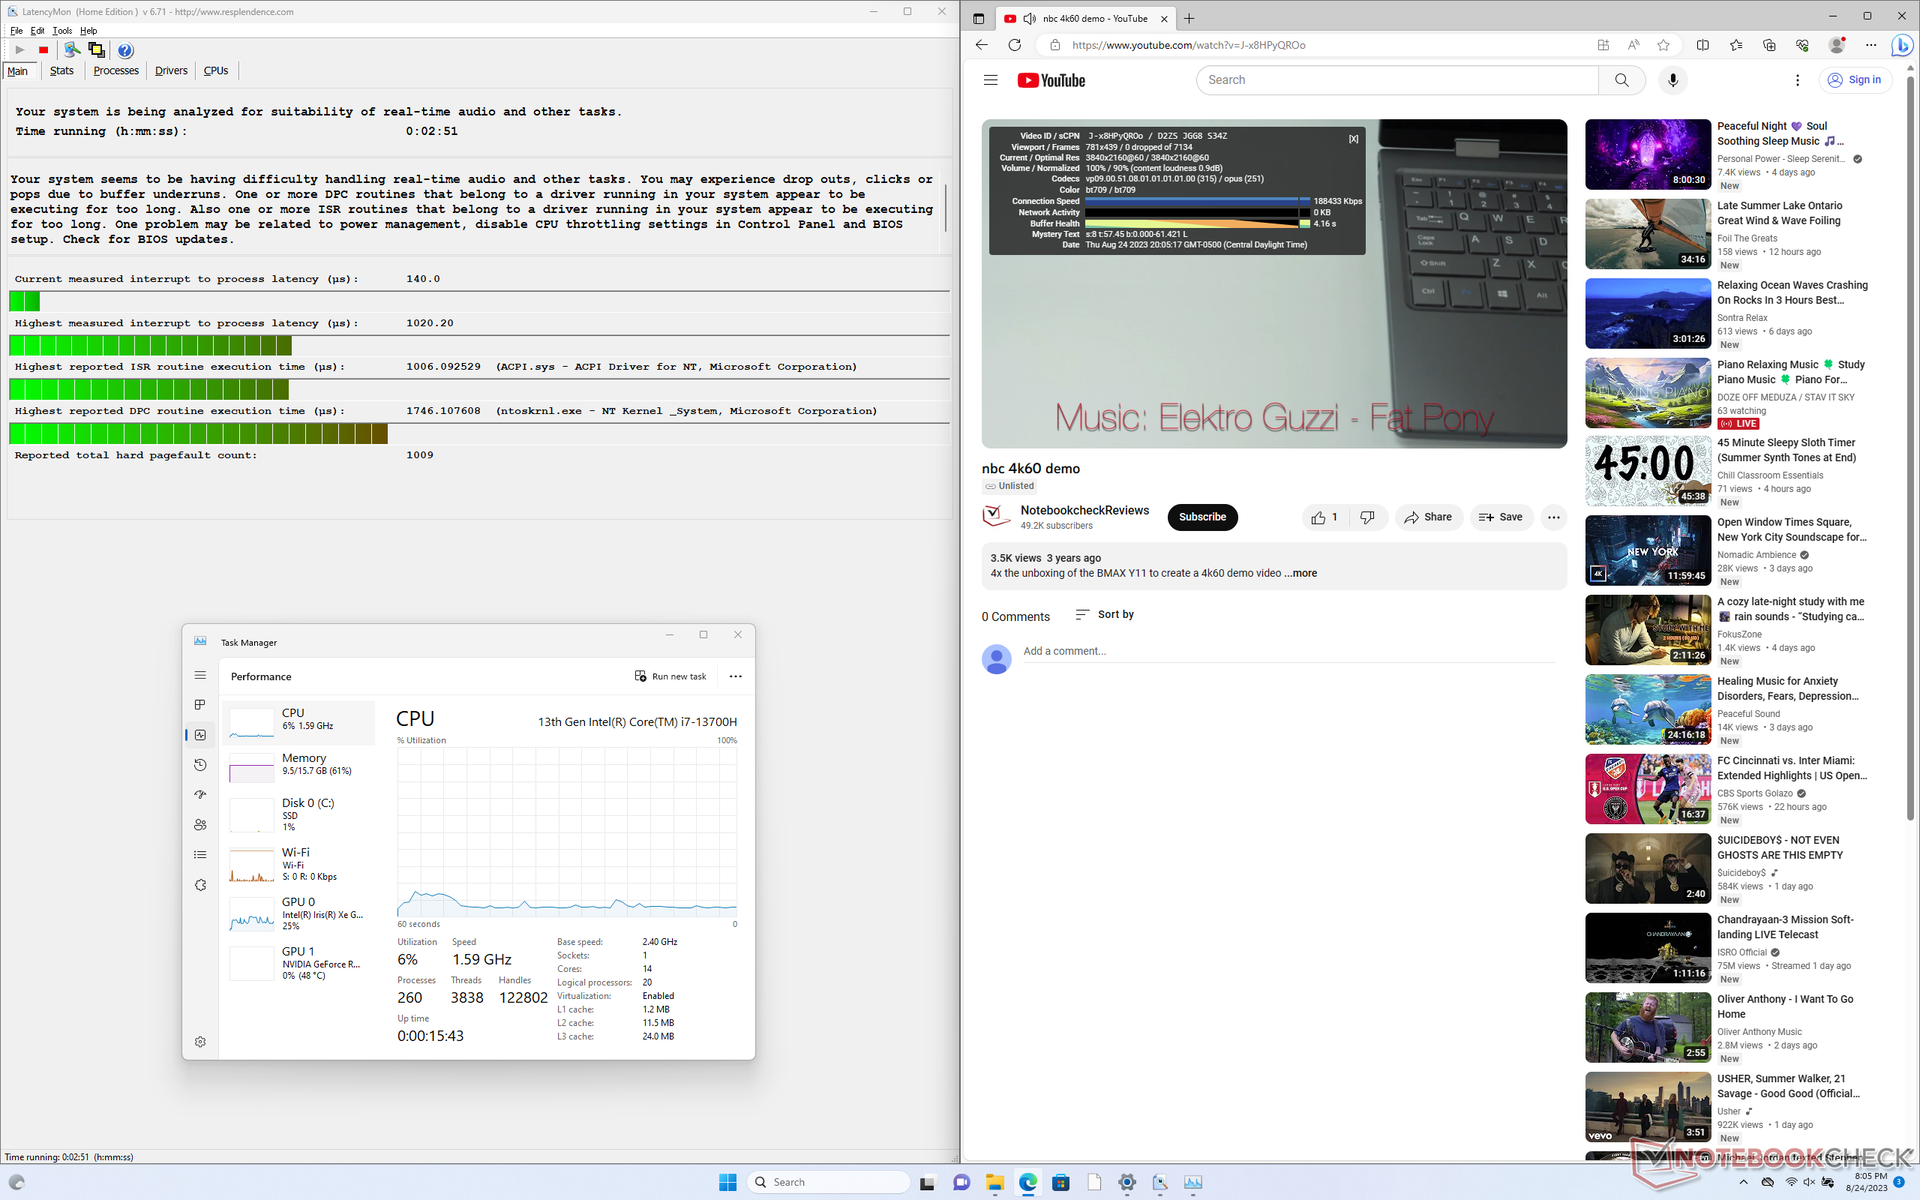
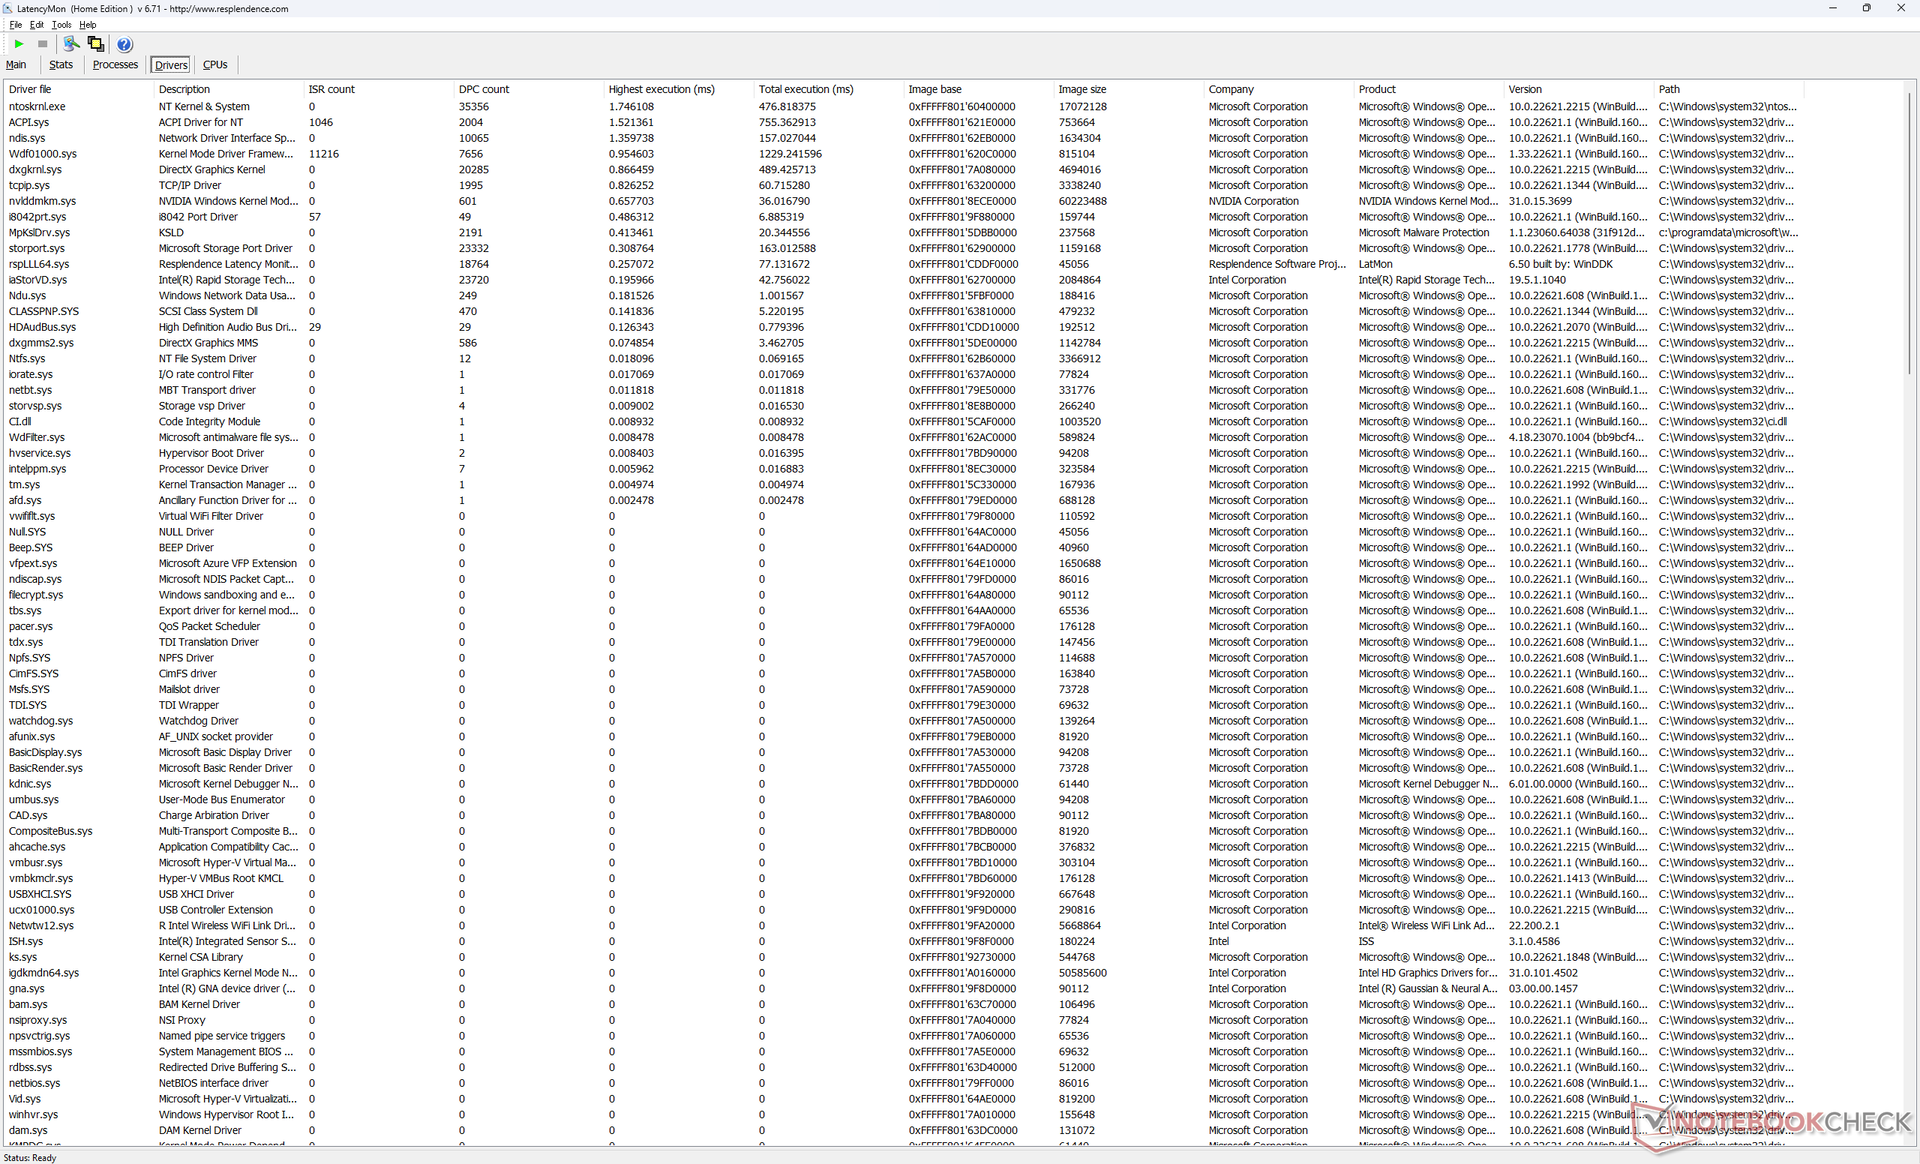
Задержки DPC
Как показал наш стандартный тест (множество вкладок в браузере, 4K YouTube видео, Prime95) в системе присутствуют значительные задержки DPC.
| DPC Latencies / LatencyMon - interrupt to process latency (max), Web, Youtube, Prime95 | |
| Asus Vivobook Pro 16X K6604JV-MX016W | |
| Lenovo Slim Pro 9i 16IRP8 | |
| Dell Inspiron 16 Plus 7630 | |
| Dell Inspiron 16 Plus 7620 | |
| MSI Summit E16 Flip A12UDT-031 | |
| HP Envy 16 h0112nr | |
* ... меньше = лучше
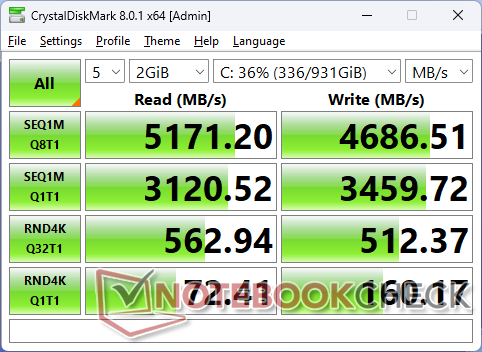
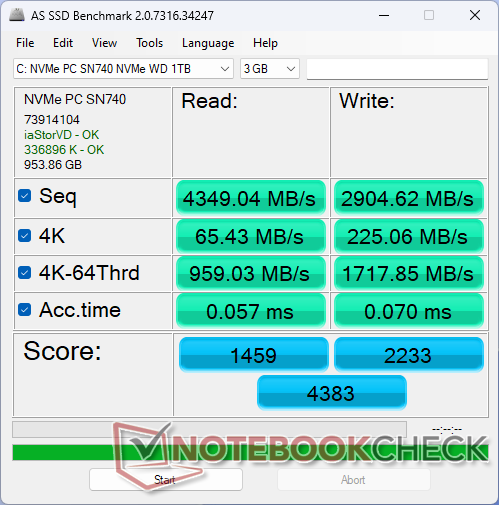
Хранение данных
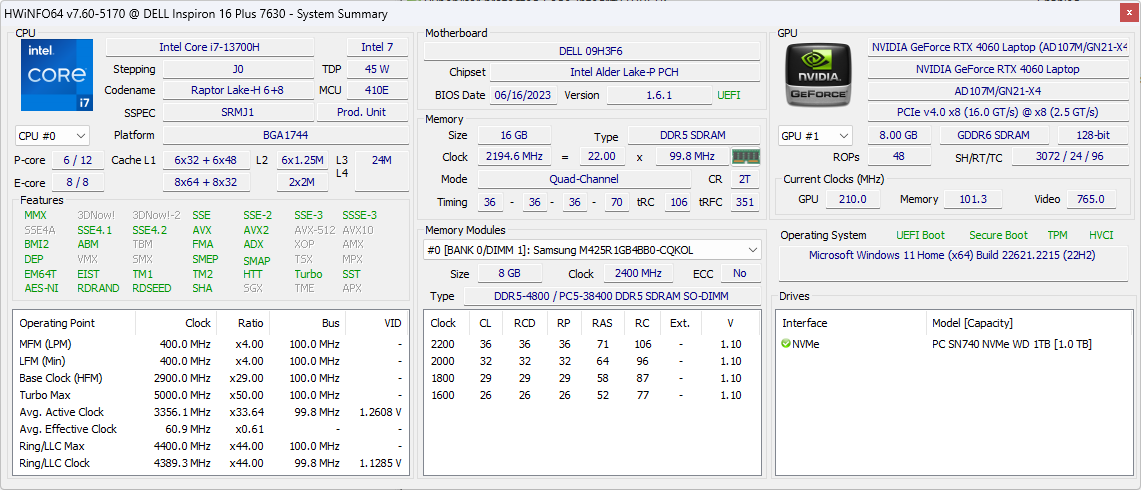
В нашем тестовом образце был установлен Western Digital SN740 со скоростью до 5200 МБ/с. Максимальную скорость накопитель способен удерживать лишь минуту, после чего она падает до 2400 МБ/с, что демонстрирует тест длительного чтения в DiskSpd.
В ноутбуке всего один слот для SSD, тогда как у 16-дюймовых конкурентов, среди которых Envy 16, их два.

| Drive Performance rating - Percent | |
| MSI Summit E16 Flip A12UDT-031 | |
| Lenovo Slim Pro 9i 16IRP8 | |
| HP Envy 16 h0112nr | |
| Dell Inspiron 16 Plus 7630 | |
| Asus Vivobook Pro 16X K6604JV-MX016W | |
| Dell Inspiron 16 Plus 7620 | |
* ... меньше = лучше
Чтение в DiskSpd, Глубина запроса 8
Видеокарта
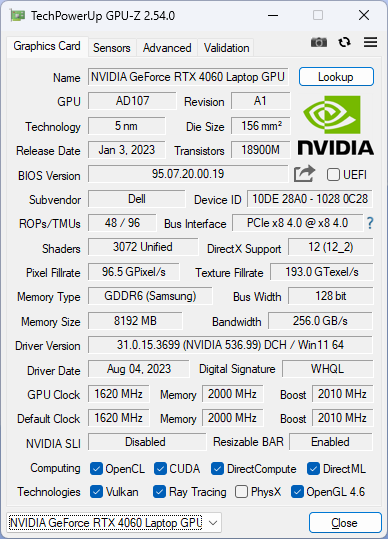
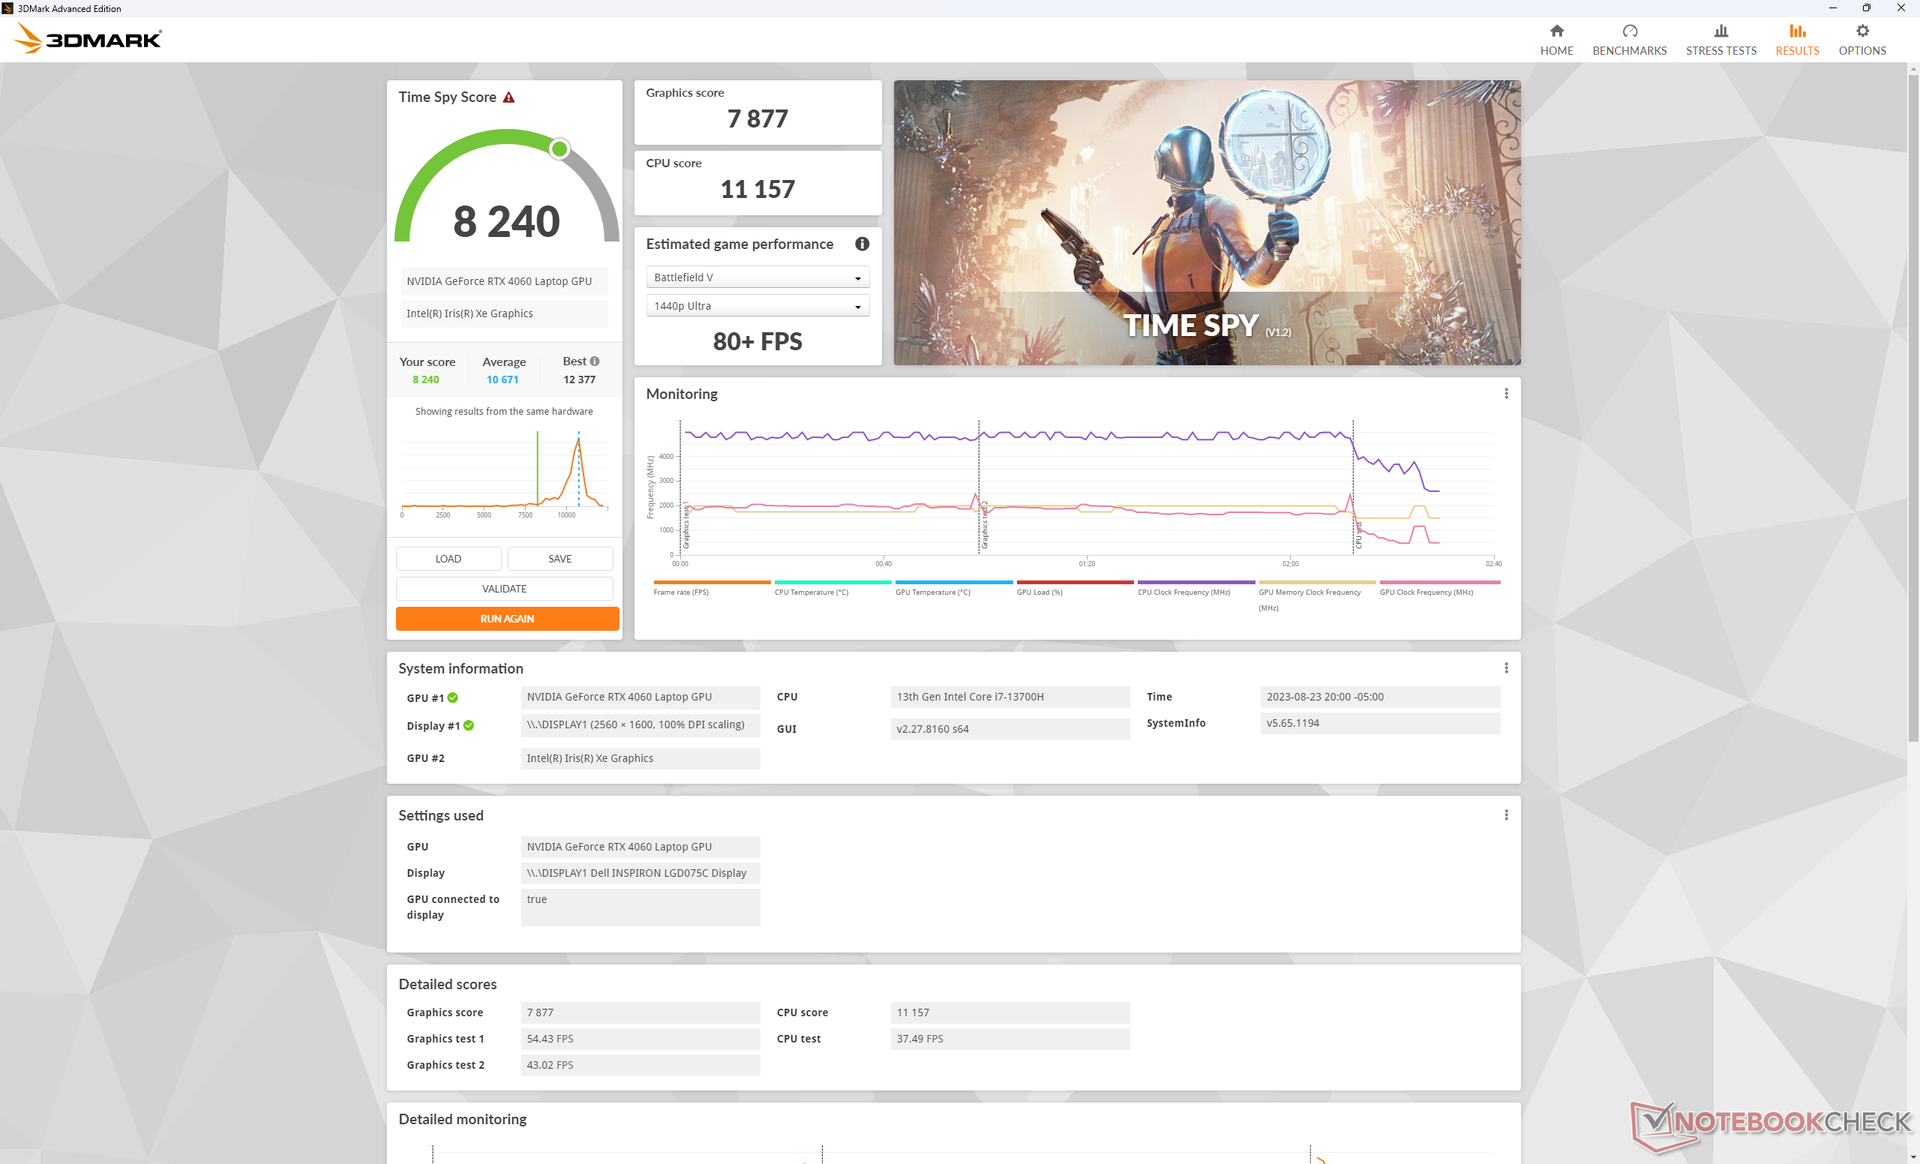
Nvidia RTX 4060 в тестируемом Dell примерно на 10-15% медленнее нормы по нашей базе данных. Отставание обусловлено низким уровнем TGP 60 Вт, ведь у большинства ноутбуков на базе данной видеокарты выставлены 90 Вт или больше. Общая производительность больше на уровне RTX 4050 (Lenovo Slim Pro 9i 16), что, конечно, расстраивает. Однако даже так прирост производительности по сравнению с RTX 3050 Ti предшественника огромный и варьируется от 40% до 60%.
С учетом вышесказанного возможно есть смысл выбирать версию Inspiron 16 Plus 7630 на базе RTX 4050, ведь для нее будут выставлены те же 60 Вт.
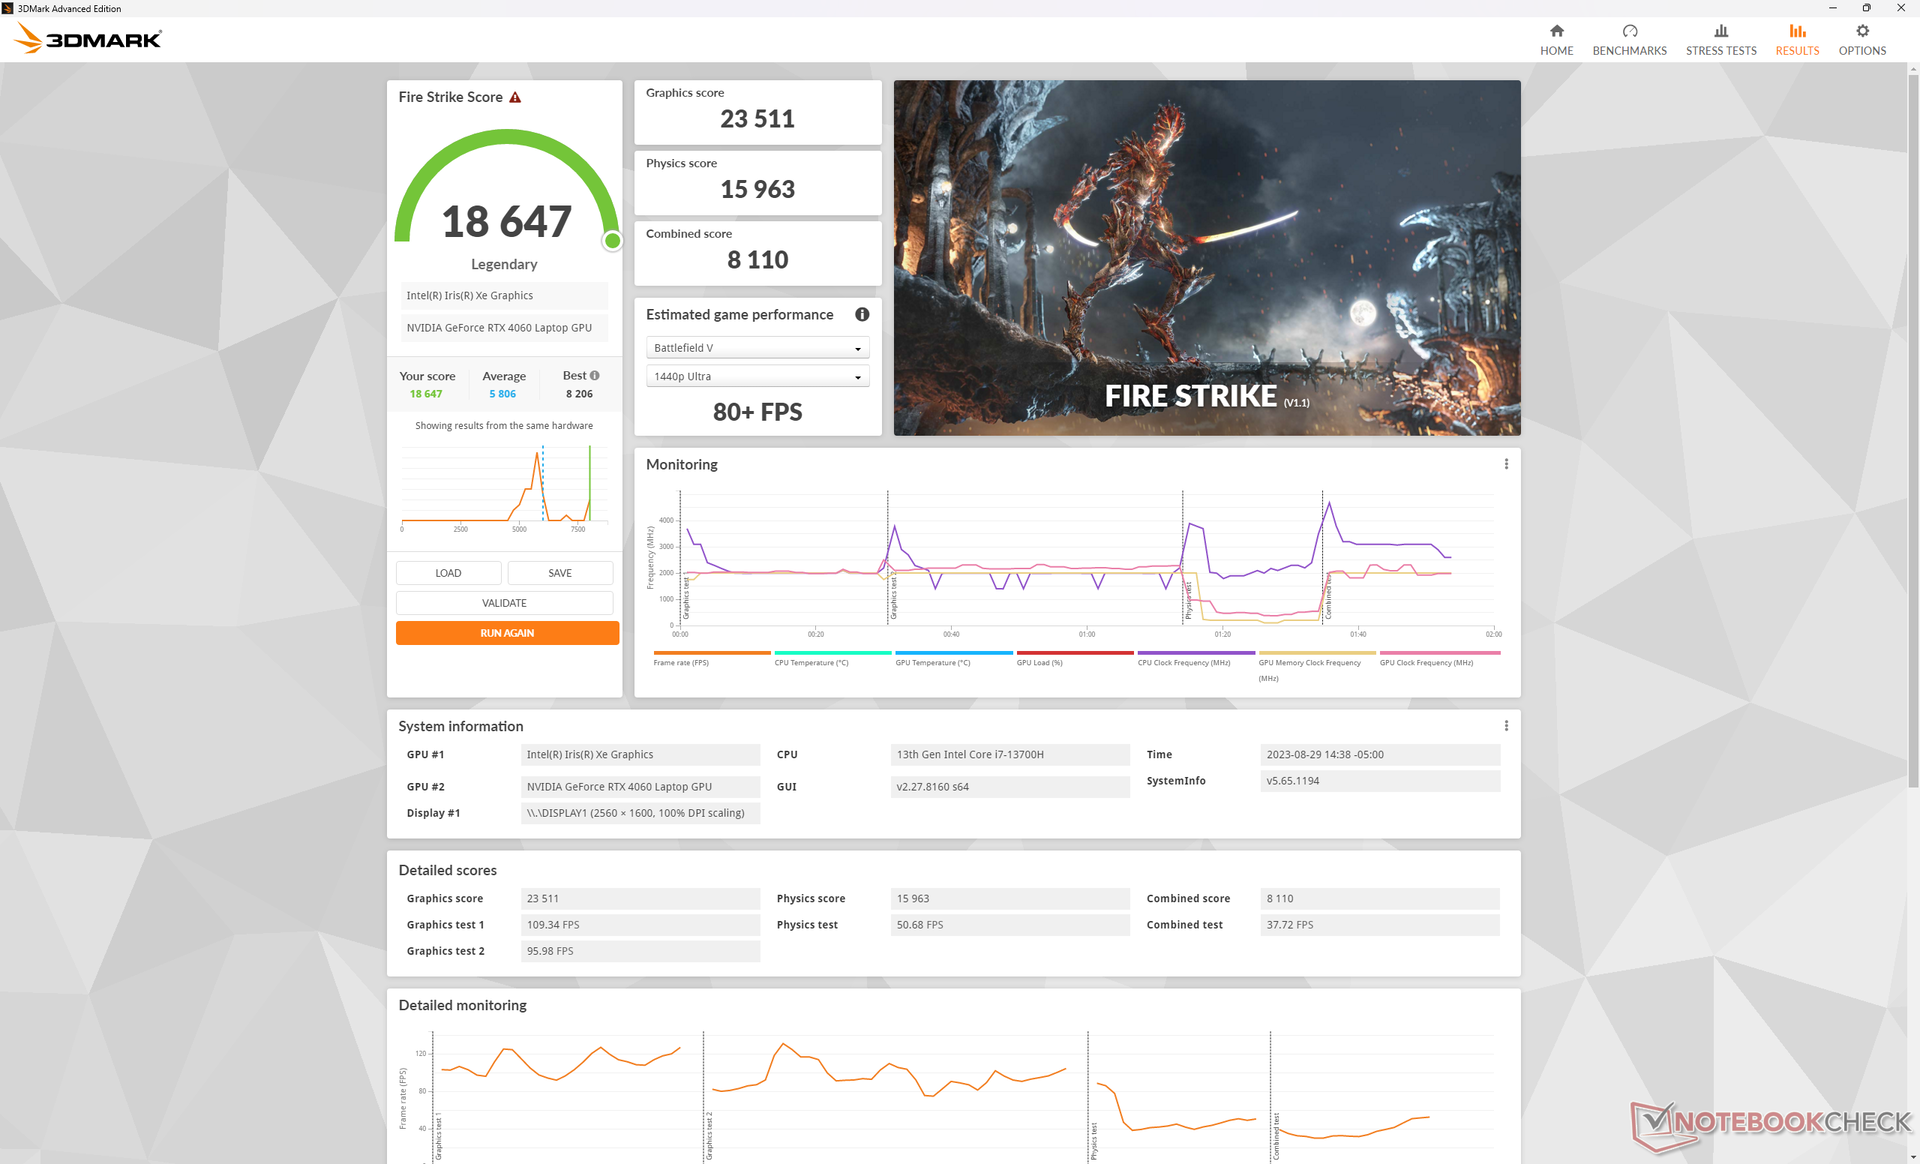
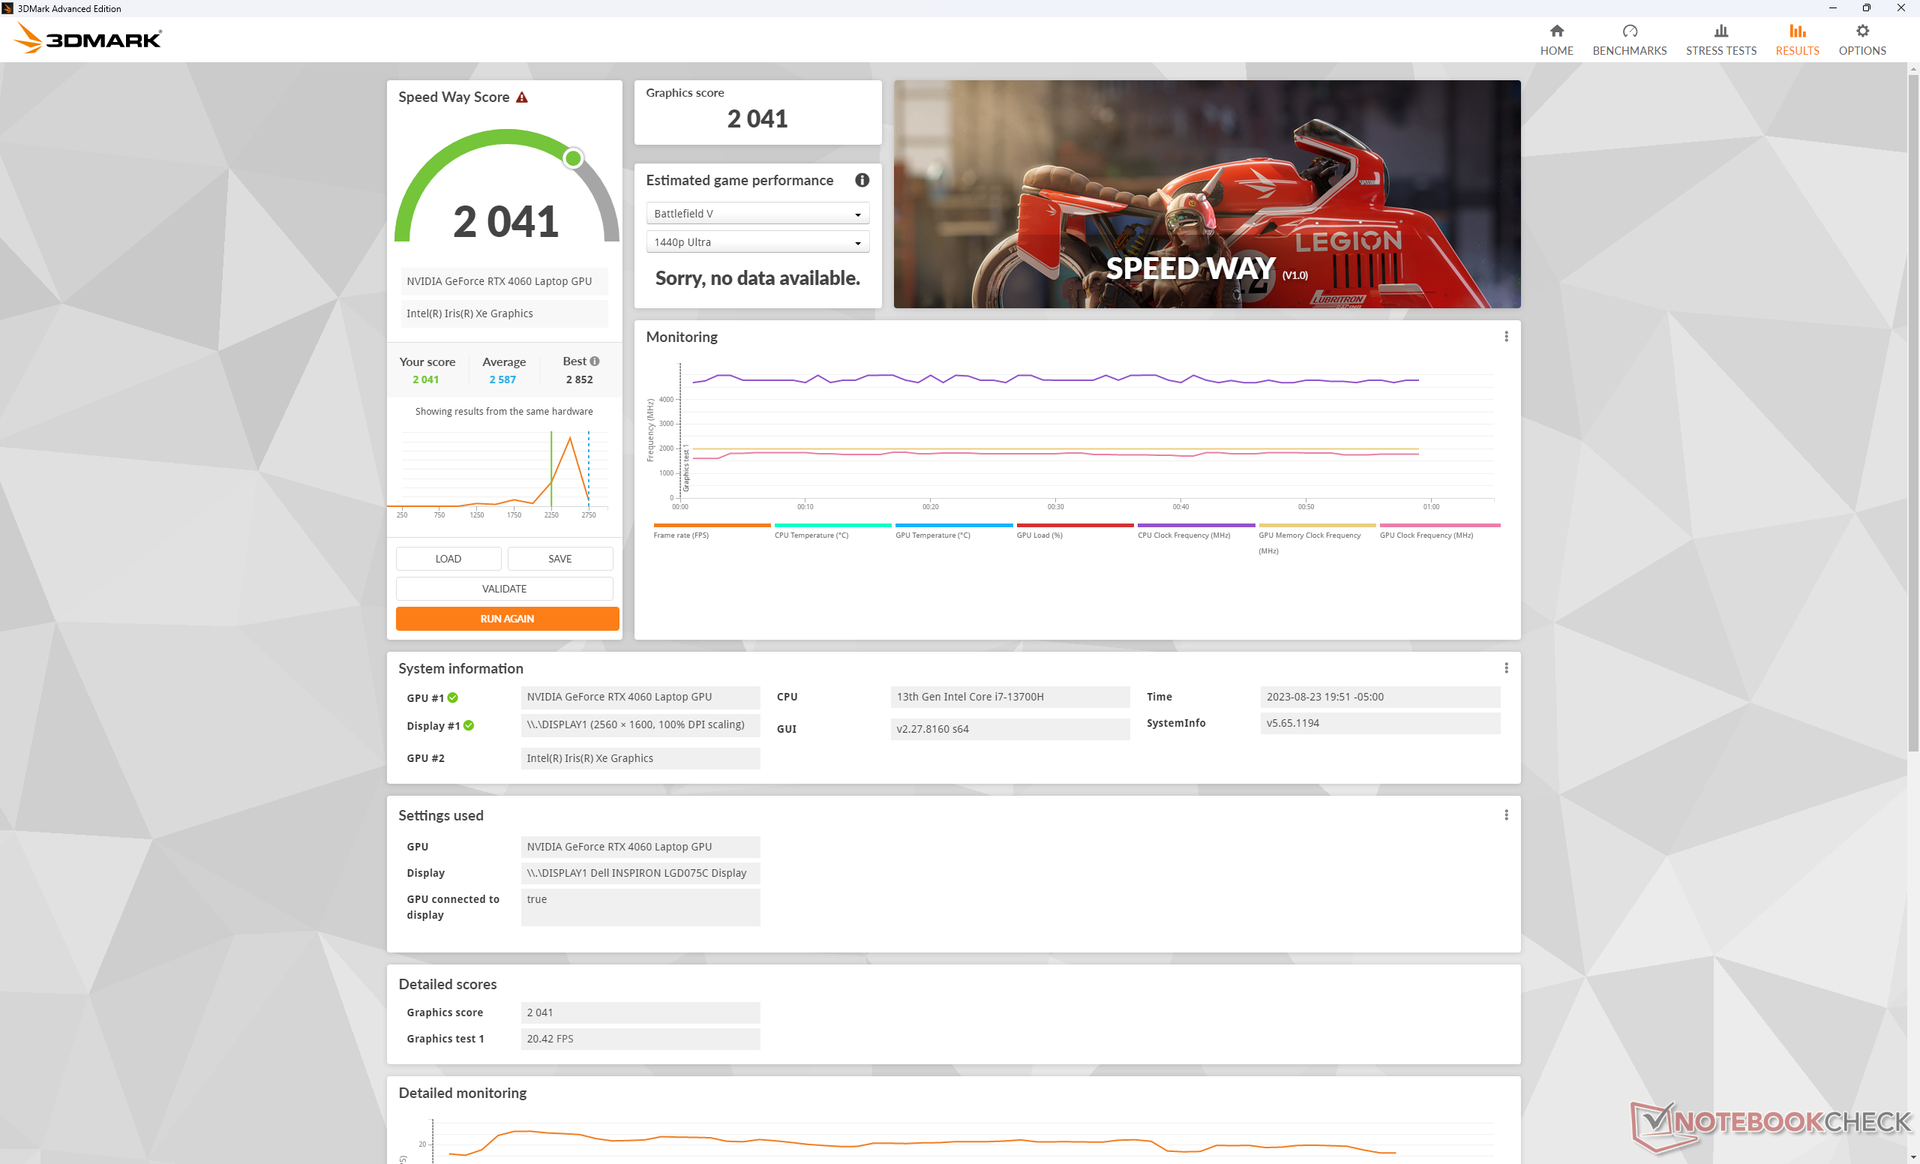
Переключение с профиля Performance на Balanced сильно влияет на производительность процессора, тогда как показатели видеокарты практически не меняются - об этом говорят оценки в Fire Strike. Таким образом, при запуске требовательных к процессору приложений лучше переключаться на Performance.
| Профиль | Graphics | Physics | Combined |
| Питание от батареи | 19574 (-9%) | 10010 (-61%) | 4793 (-46%) |
| Balanced | 23511 (-2%) | 15963 (-41%) | 8110 (-21%) |
| Performance | 24008 | 26852 | 10239 |

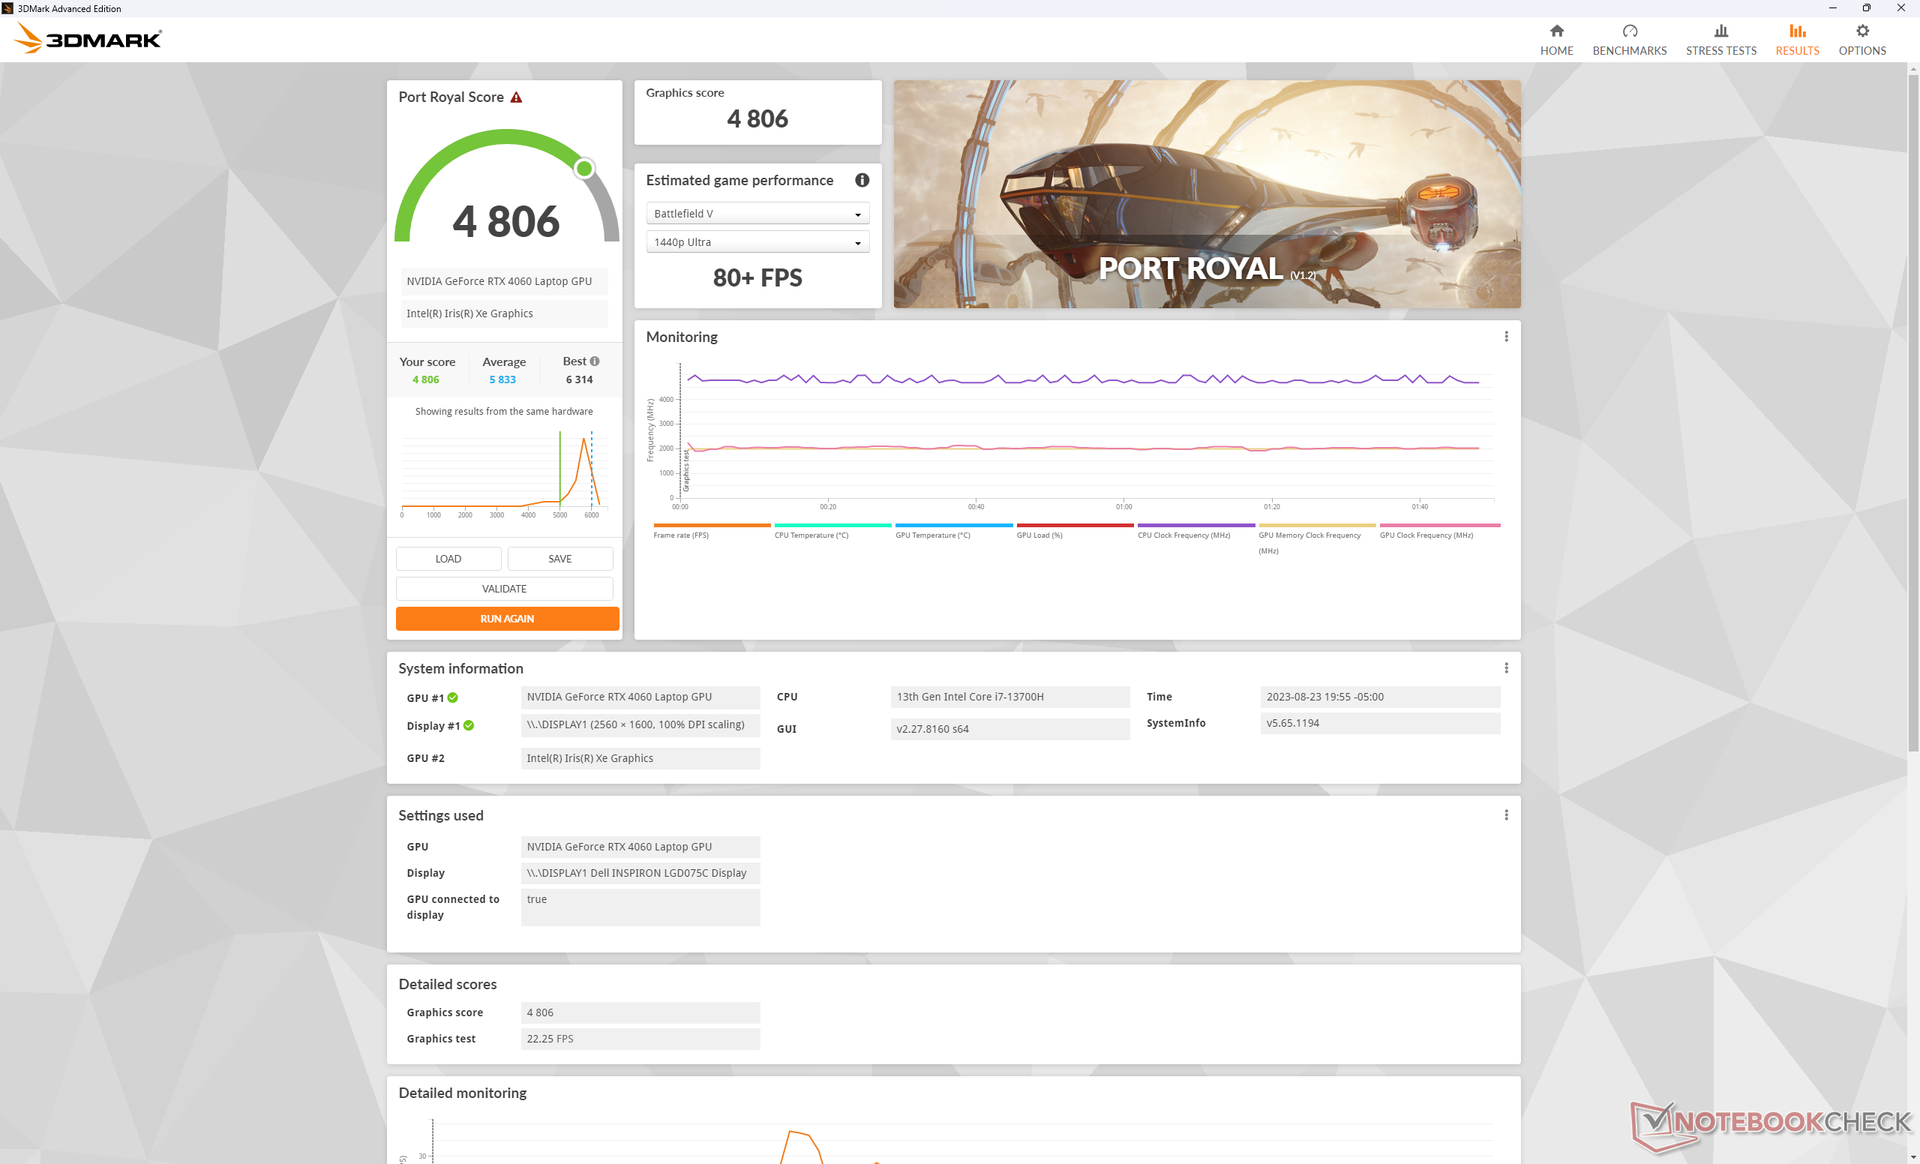
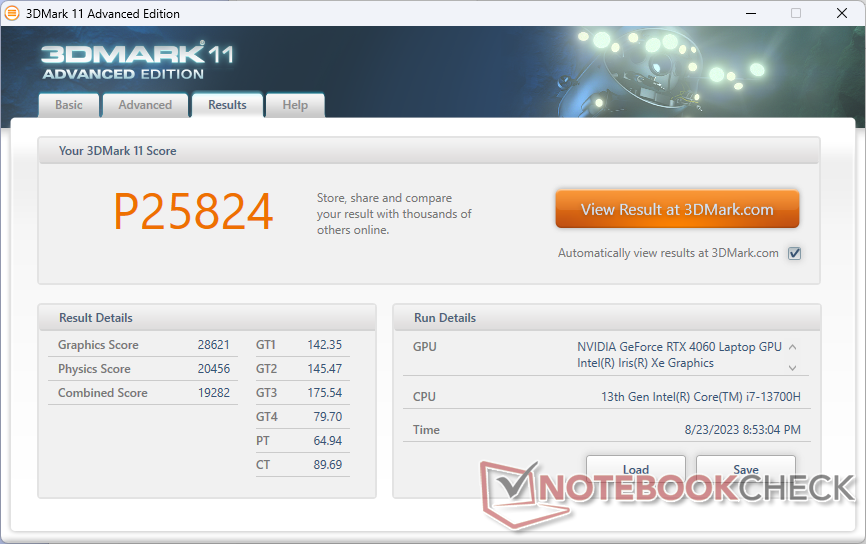
| 3DMark 11 Performance | 25824 баллов | |
| 3DMark Fire Strike Score | 19289 баллов | |
| 3DMark Time Spy Score | 8240 баллов | |
? | ||
* ... меньше = лучше
Игры
Как и предвещали тесты 3DMark, общая игровая производительность немного ниже нормы мобильной RTX 4060. Tiny Tina's Wonderlands, для примера, идет с частотой 48 к/с на максимальных настройках в 1440p, тогда как в норме здесь должны быть 57 к/с. Технология G-Sync не поддерживается.
Частота кадров, Witcher 3
| мин. | сред. | выс. | макс. | QHD | |
|---|---|---|---|---|---|
| The Witcher 3 (2015) | 409.3 | 275.3 | 169.5 | 90.9 | 68 |
| Dota 2 Reborn (2015) | 184.7 | 166.6 | 157.9 | 146.1 | |
| Final Fantasy XV Benchmark (2018) | 172.2 | 122.2 | 88.9 | 64.4 | |
| X-Plane 11.11 (2018) | 153.5 | 135.7 | 109.7 | ||
| Far Cry 5 (2018) | 133 | 120 | 115 | 103 | 83 |
| Strange Brigade (2018) | 378 | 234 | 185.9 | 161 | 110.9 |
| Cyberpunk 2077 1.6 (2022) | 108.1 | 84.2 | 72.9 | 65.7 | 40.8 |
| Tiny Tina's Wonderlands (2022) | 169.5 | 141.5 | 92.1 | 71.4 | 48 |
| F1 22 (2022) | 205 | 201 | 148.4 | 53.8 | 34.1 |
| Returnal (2023) | 71 | 68 | 63 | 57 | 39 |
Температурные и акустические показатели
Система охлаждения
В состоянии простоя вентиляторы время от времени отключаются, но зачастую работают на минимуме, выдавая 26-28 дБ(A), при просмотре видео и сайтов в браузере. Из хорошего можно отметить неспешность с которой вентиляторы набирают скорость даже при появлении высокой нагрузки, тогда как у предыдущего Inspiron 16 Plus 7620 они часто и резко разгонялись и стихали. В 3DMark 06 уровень шума достигает всего 35 дБ(A) к концу первой 90-секундной сцены бенчмарка.
В играх шумность значительно возрастает и если при малых нагрузках Inspiron был тише предшественника, то здесь все ровно наоборот. Значение достигает почти 53 дБ(A) в Witcher 3, тогда как у прошлой модели мы измеряли 49 дБ(A). Как бы там ни было, немного свыше 50 дБ(A) - это также показатели и таких соперников, как Slim Pro 9i 16 и Envy 16.
Интересно, что переключение профилей Balanced и Performance никак не влияет на шумность в играх.
Уровень шума
| Ожидание |
| 23.2 / 23.2 / 23.2 дБ |
| Нагрузка |
| 35.1 / 52.5 дБ |
 | ||
30 dB бесшумно 40 dB(A) различимо 50 dB(A) громко |
||
min: | ||
| Dell Inspiron 16 Plus 7630 GeForce RTX 4060 Laptop GPU, i7-13700H, WD PC SN740 SDDPTQD-1T00 | Dell Inspiron 16 Plus 7620 GeForce RTX 3050 Ti Laptop GPU, i7-12700H, Kioxia BG5 KBG50ZNS512G | Lenovo Slim Pro 9i 16IRP8 GeForce RTX 4050 Laptop GPU, i9-13905H, Samsung PM9A1 MZVL21T0HCLR | Asus Vivobook Pro 16X K6604JV-MX016W GeForce RTX 4060 Laptop GPU, i9-13980HX, Solidigm P41 Plus SSDPFKNU010TZ | HP Envy 16 h0112nr GeForce RTX 3060 Laptop GPU, i7-12700H, Micron 3400 1TB MTFDKBA1T0TFH | MSI Summit E16 Flip A12UDT-031 GeForce RTX 3050 Ti Laptop GPU, i7-1280P, Samsung PM9A1 MZVL22T0HBLB | |
|---|---|---|---|---|---|---|
| Уровень шума | -11% | 1% | -21% | -6% | -14% | |
| в выкл. виде (фон) * (dB) | 23.2 | 23.3 -0% | 22.7 2% | 25.2 -9% | 22.8 2% | 25 -8% |
| Мин. в простое * (dB) | 23.2 | 25.7 -11% | 22.7 2% | 26.6 -15% | 22.9 1% | 25 -8% |
| В простое, сред. * (dB) | 23.2 | 26.1 -13% | 22.7 2% | 26.6 -15% | 22.9 1% | 25 -8% |
| В простое, макс. * (dB) | 23.2 | 30.6 -32% | 27.5 -19% | 29.2 -26% | 30.5 -31% | 28.9 -25% |
| Нагрузка, сред. * (dB) | 35.1 | 46.2 -32% | 28.9 18% | 53.4 -52% | 41.4 -18% | 49.3 -40% |
| Witcher 3 ultra * (dB) | 52.5 | 49.2 6% | 52.6 -0% | 51.1 3% | ||
| Нагрузка, макс. * (dB) | 52.5 | 49.4 6% | 52.5 -0% | 56.9 -8% | 51.4 2% | 48.2 8% |
* ... меньше = лучше
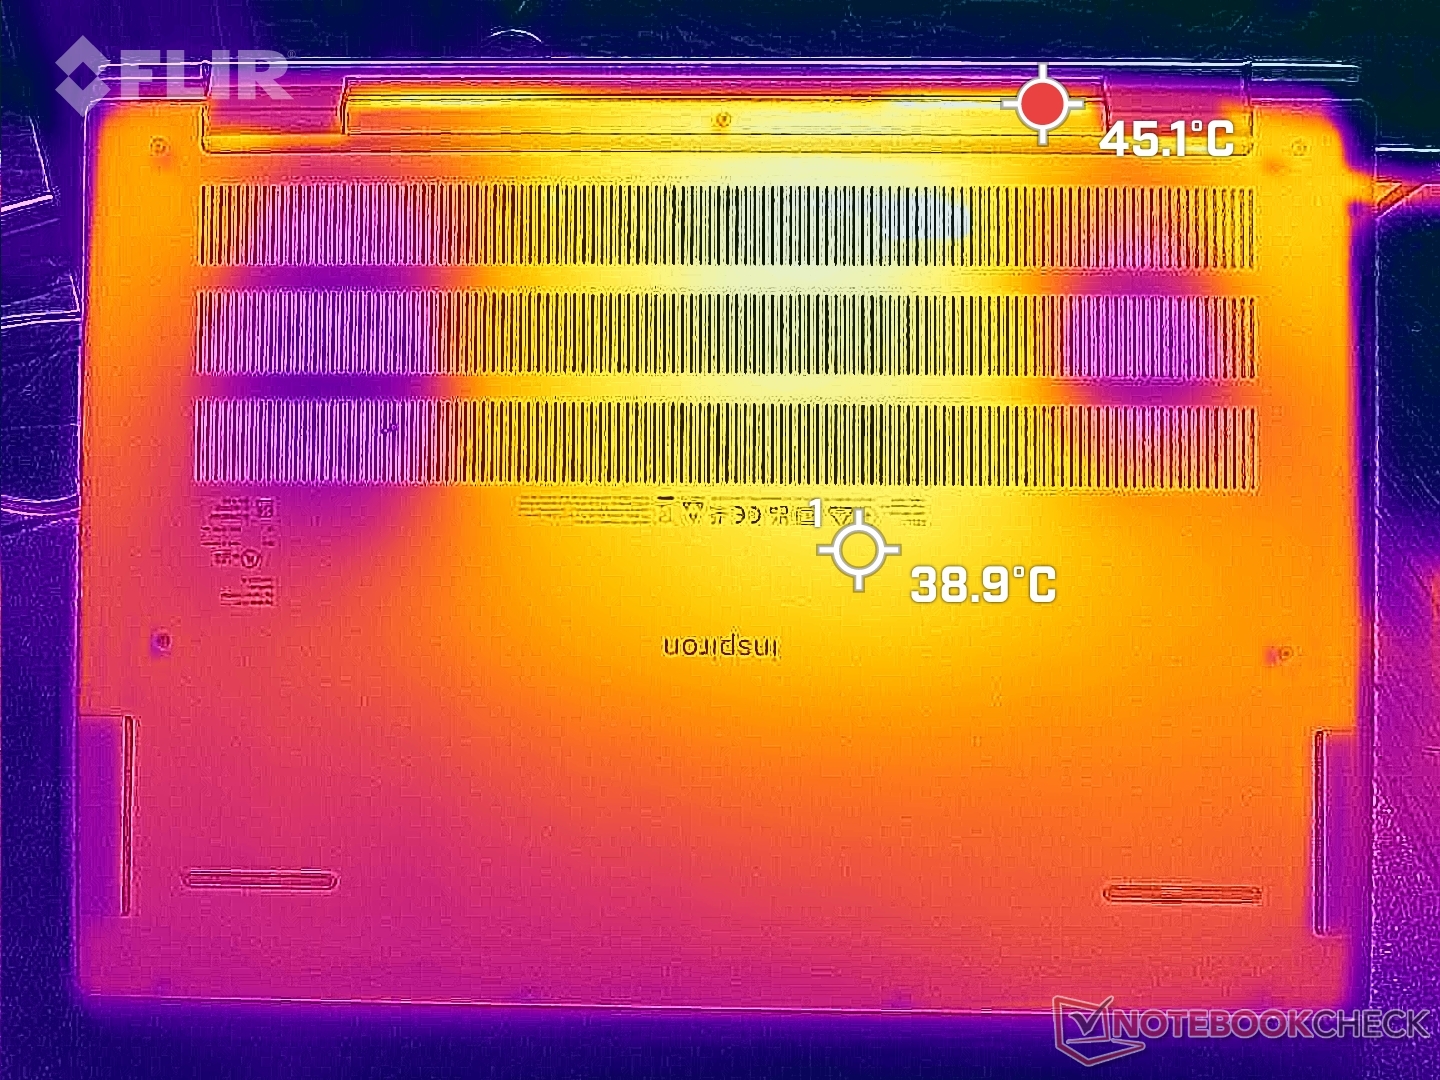
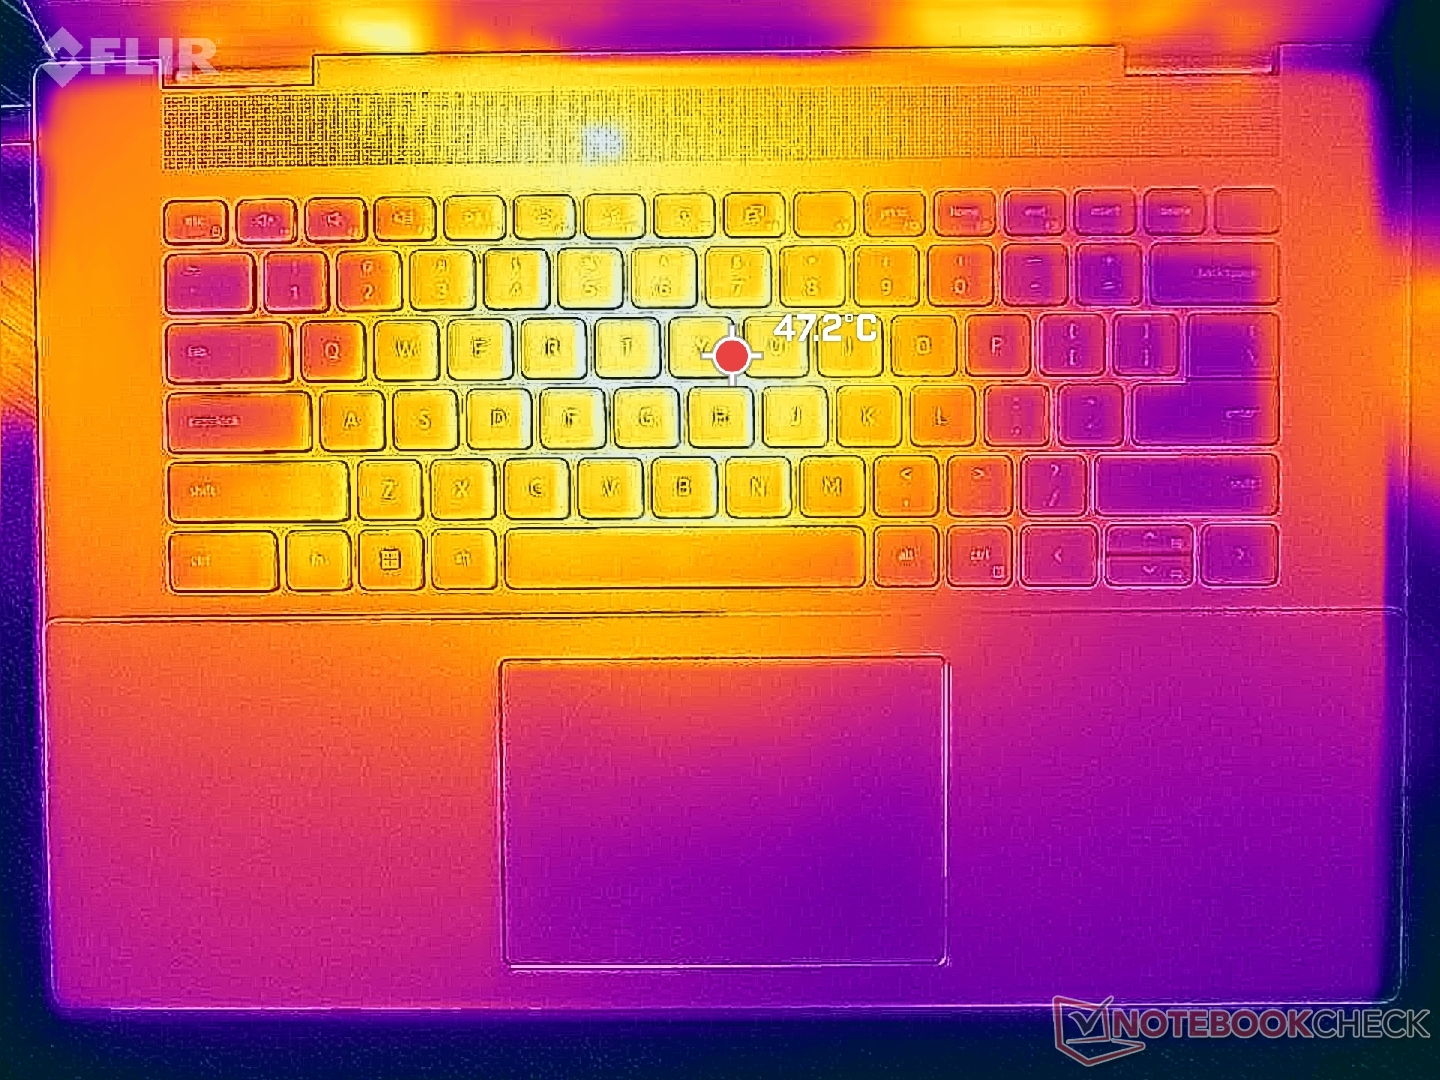
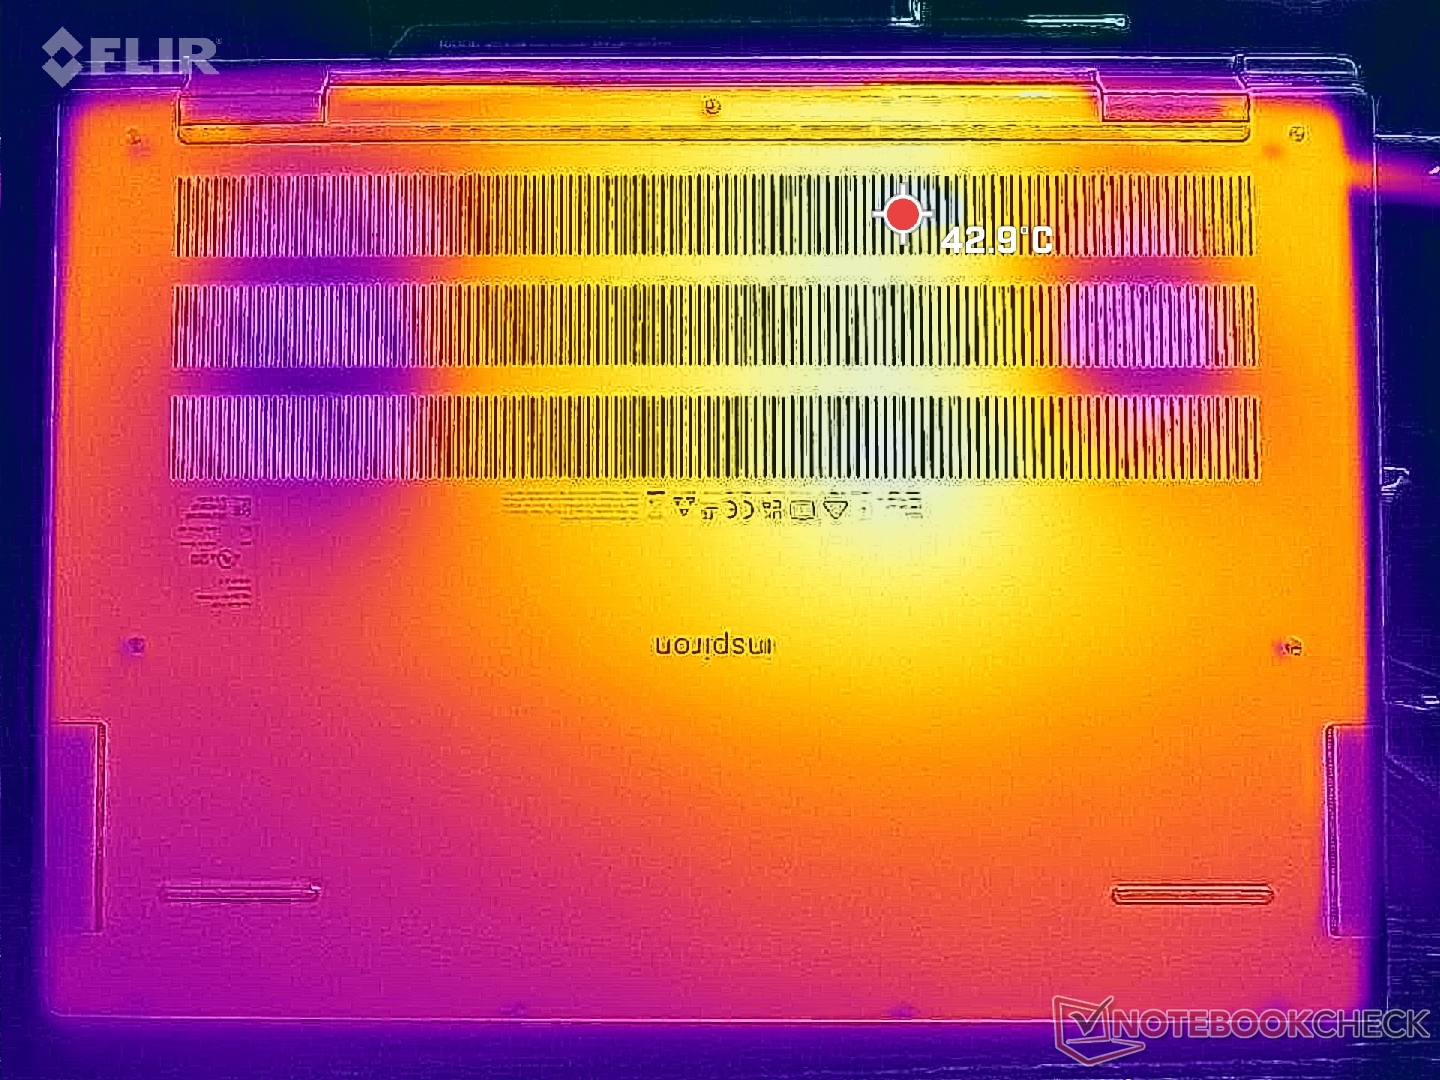
Нагрев
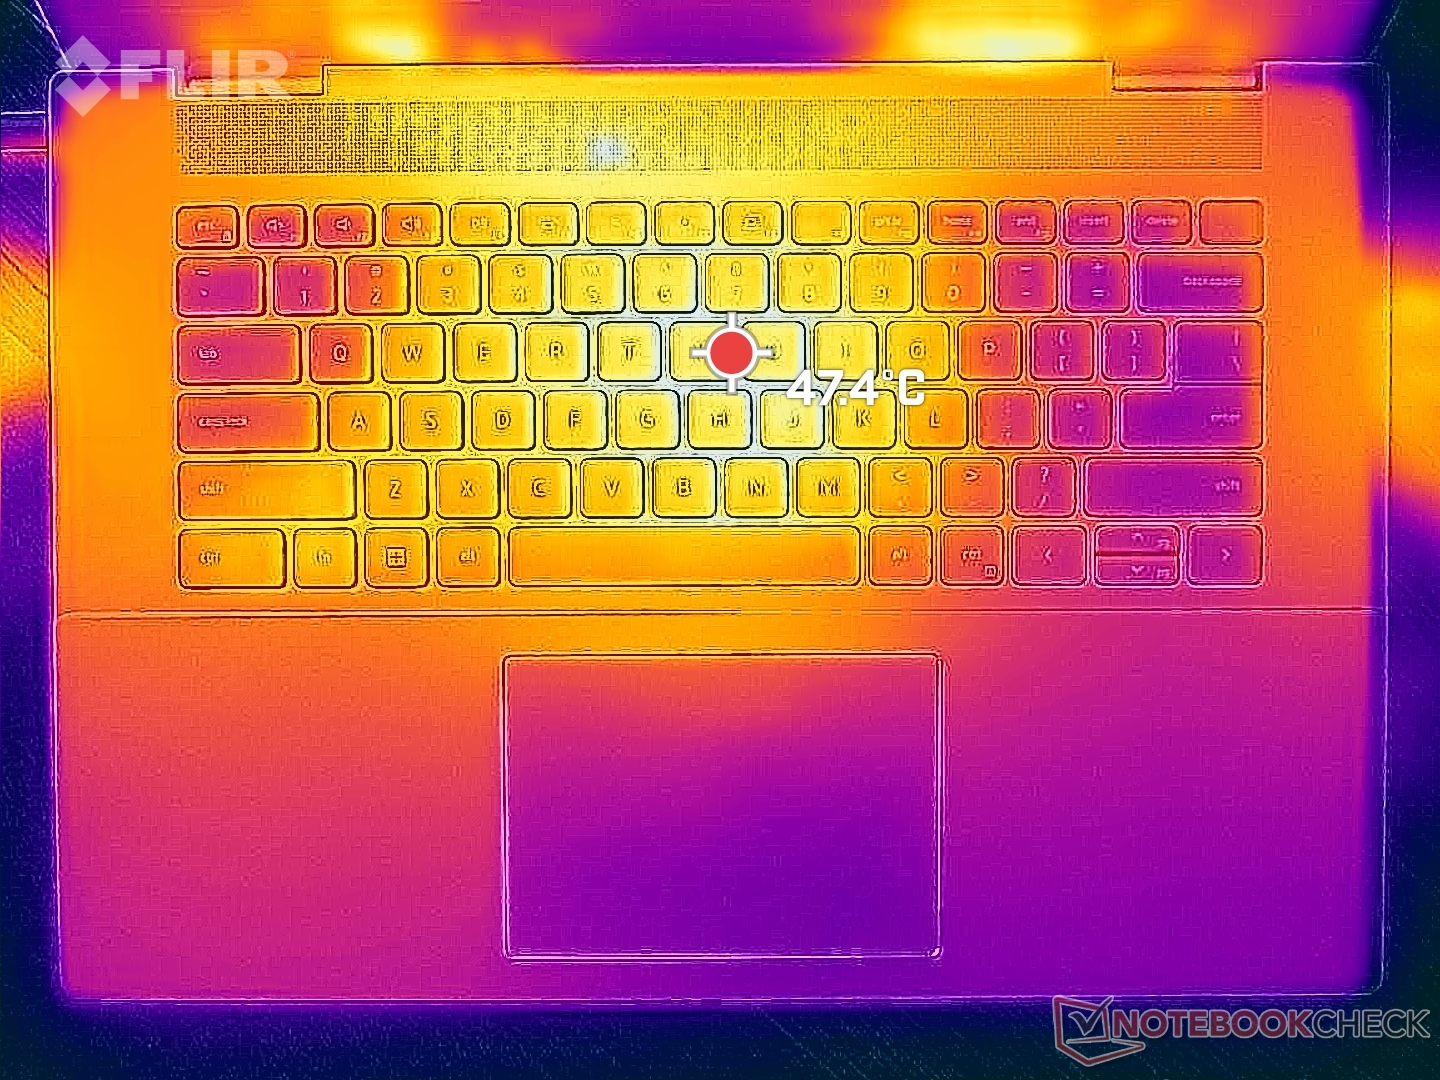
Нагрев корпуса при запуске нетребовательных игр ниже ожидаемого. Температура на палубе и днище может достигать 48 и 43 градусов Цельсия соответственно (область по центру клавиатуры). Палмрест может прогреваться до 37 градусов, тогда как у Asus Vivobook Pro 16X и HP Envy 16 мы измеряли 31 градус.
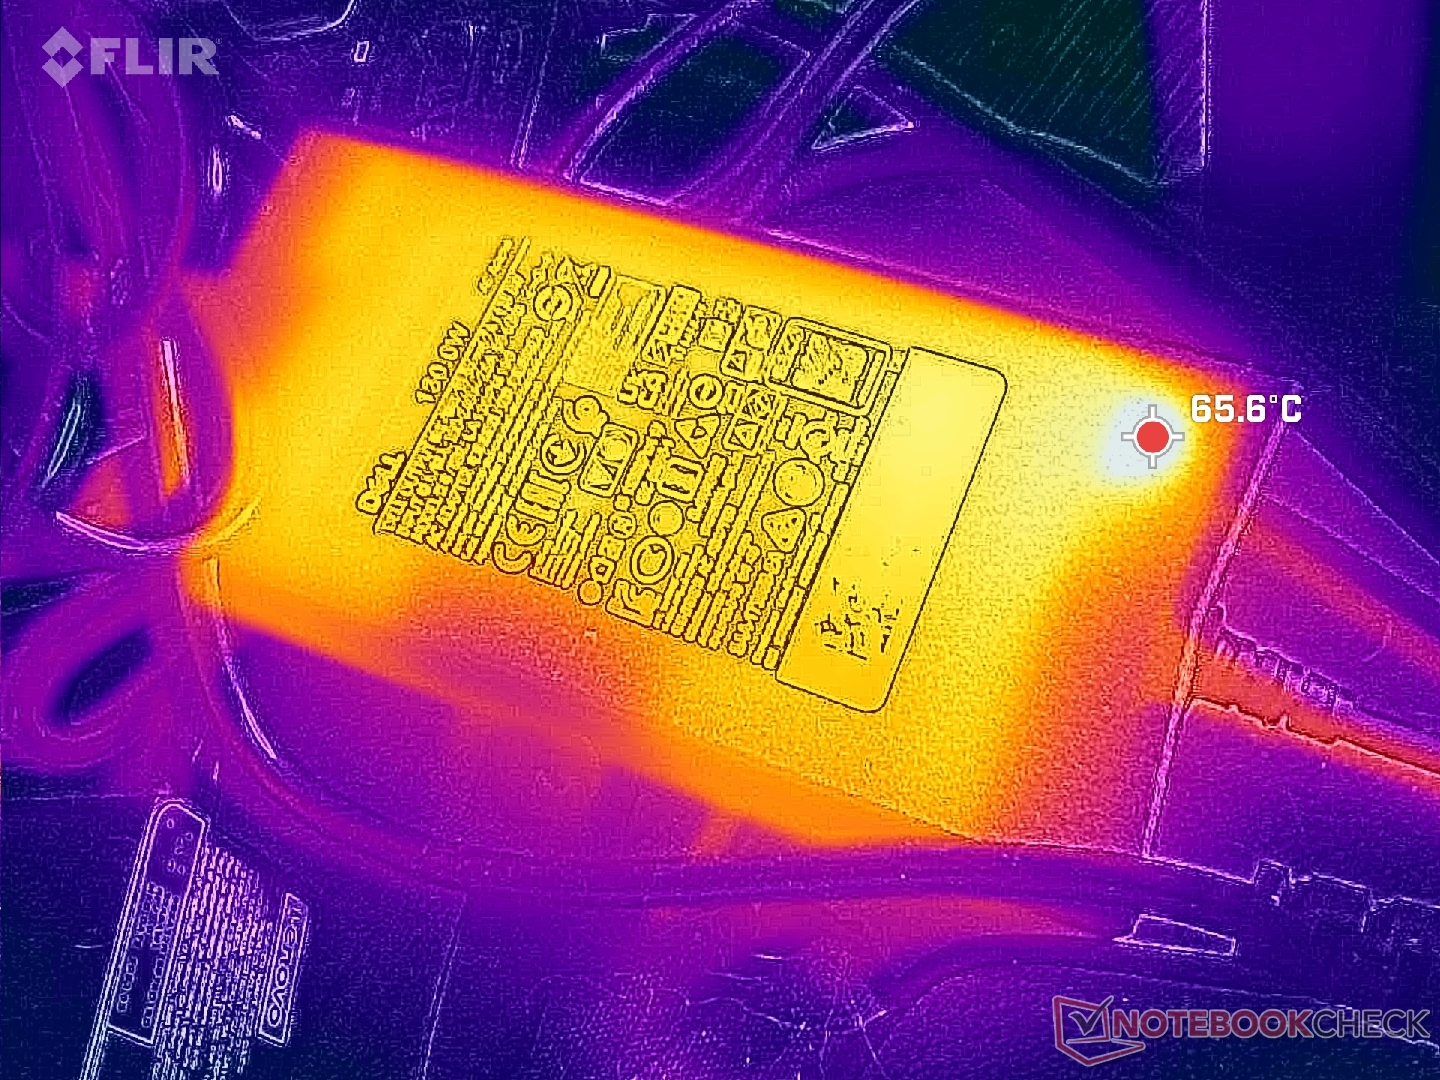
Также мы заметили, что под нагрузкой адаптер питания греется слишком сильно - до 65 градусов Цельсия.
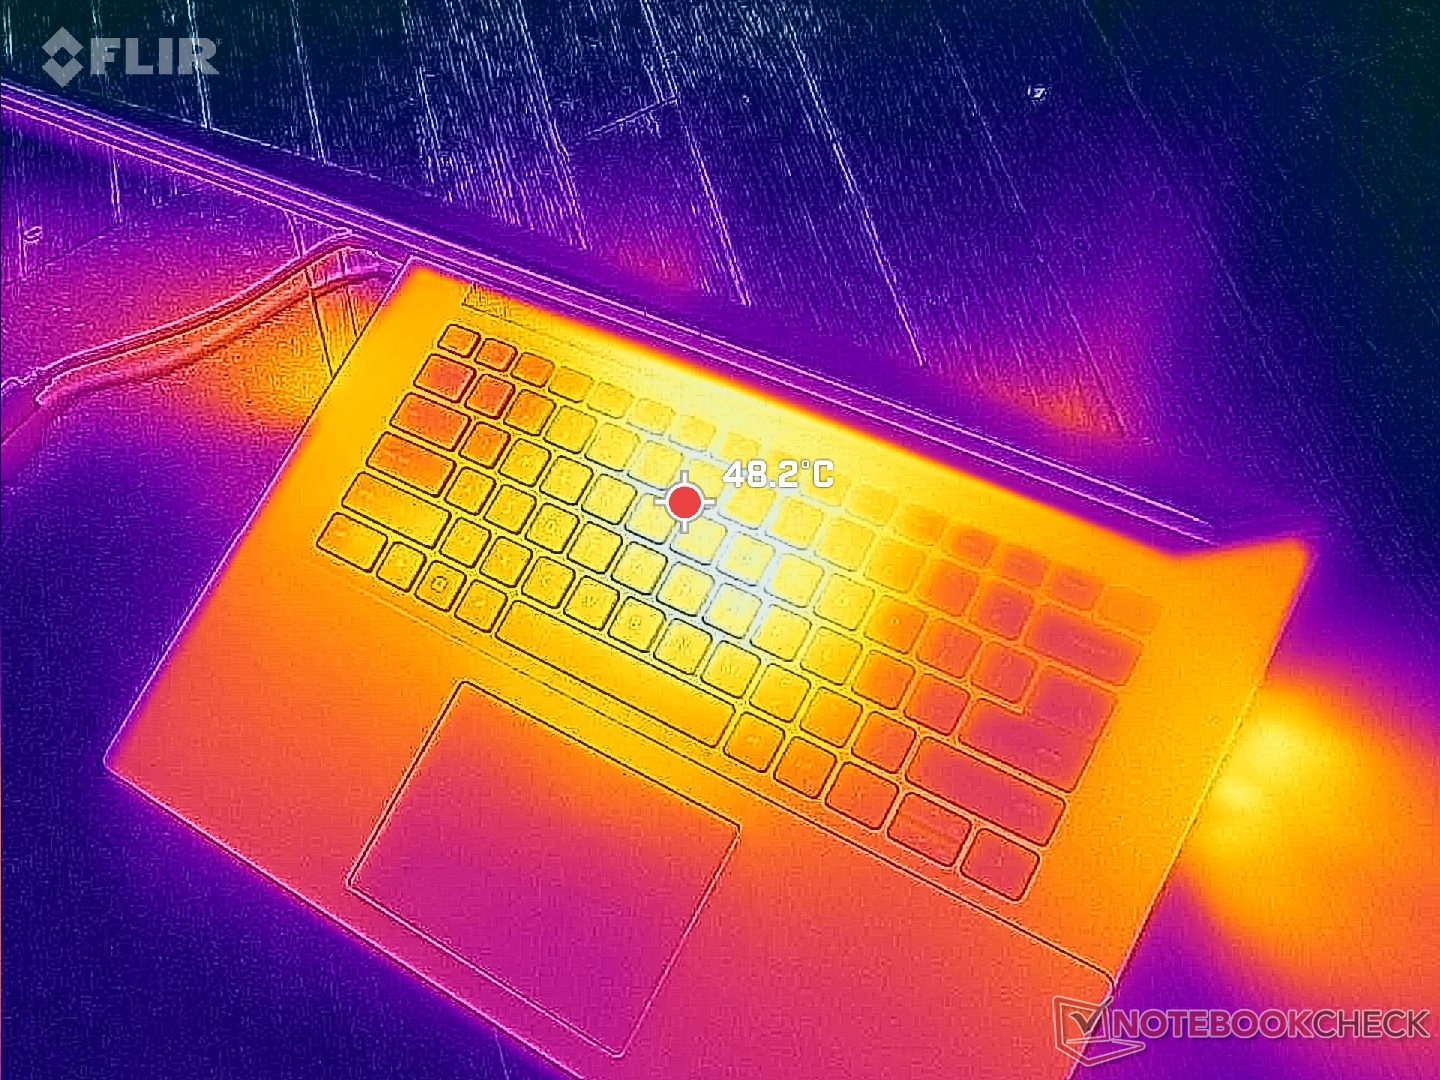
(-) Макс. температура верха корпуса составила 47.8 град. Цельсия. Типичное значение для устройств этого же класса (Multimedia) = 36.8 градуса (-ов) при минимуме в 21 град. и максимуме в 71 град.
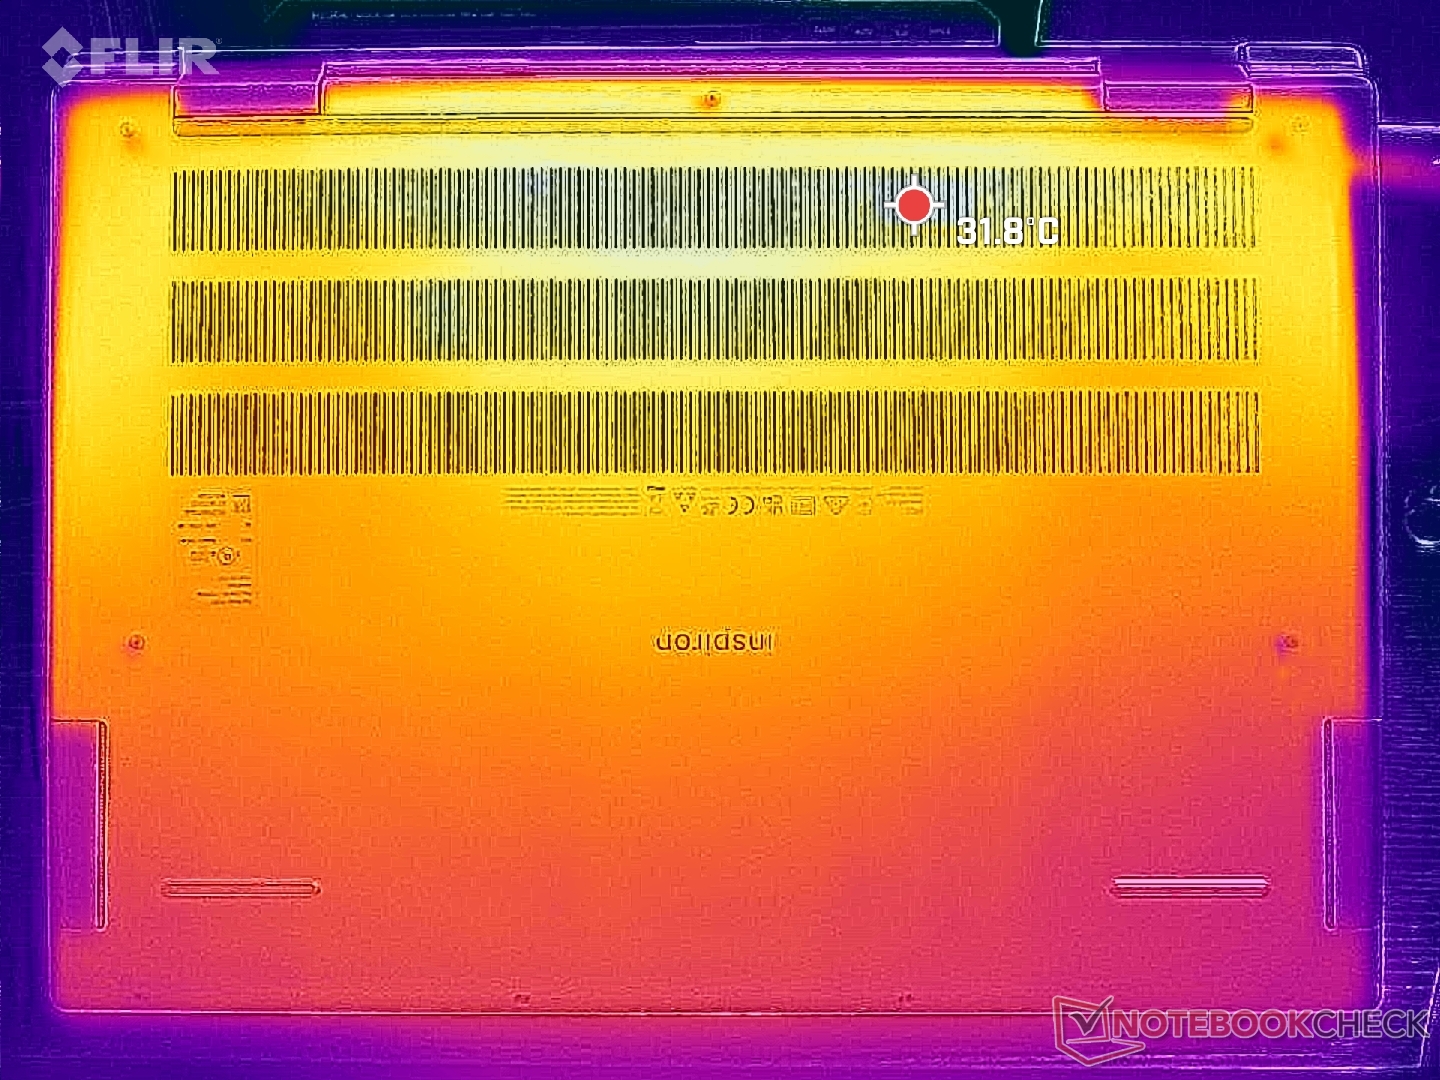
(±) Макс. температура дна составила 42.2 град. Цельсия. Типичное значение для устройств этого же класса = 39.1 градуса (-ов).
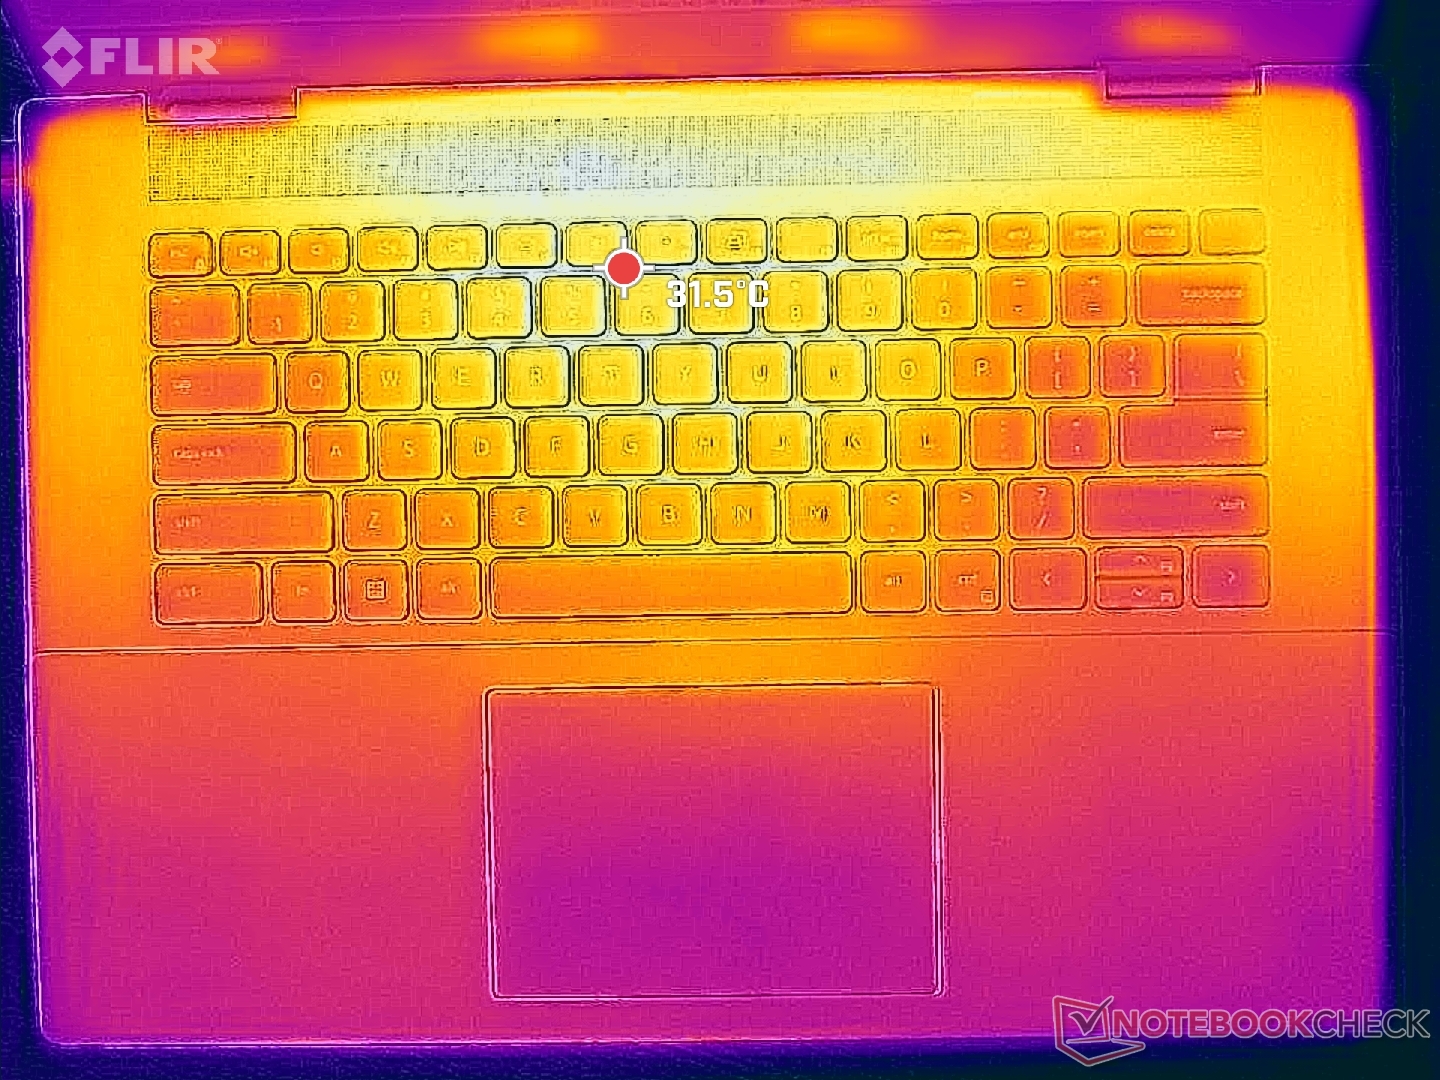
(±) При отсутствии вычислительной нагрузки верх корпуса нагревается в среднем до 32 град. Типичное значение для устройств этого же класса = 31.3 градуса (-ов).
(-) При игре в Ведьмак 3 верх корпуса нагревается в среднем до 40.6 град. Типичное значение для устройств этого же класса = 31.3 градуса (-ов).
(±) Палуба на ощупь: Мои пальцы!!! (36.6 град. Цельсия).
(-) Средняя температура палубы у похожих моделей составила 28.7 град. Цельсия, это -7.9 градуса (-ов) разницы.
| Dell Inspiron 16 Plus 7630 Intel Core i7-13700H, NVIDIA GeForce RTX 4060 Laptop GPU | Dell Inspiron 16 Plus 7620 Intel Core i7-12700H, NVIDIA GeForce RTX 3050 Ti Laptop GPU | Lenovo Slim Pro 9i 16IRP8 Intel Core i9-13905H, NVIDIA GeForce RTX 4050 Laptop GPU | Asus Vivobook Pro 16X K6604JV-MX016W Intel Core i9-13980HX, NVIDIA GeForce RTX 4060 Laptop GPU | HP Envy 16 h0112nr Intel Core i7-12700H, NVIDIA GeForce RTX 3060 Laptop GPU | MSI Summit E16 Flip A12UDT-031 Intel Core i7-1280P, NVIDIA GeForce RTX 3050 Ti Laptop GPU | |
|---|---|---|---|---|---|---|
| Нагрев | 6% | 10% | -3% | 3% | 2% | |
| Нагрузка, макс. сверху * (°C) | 47.8 | 46 4% | 37.8 21% | 39.7 17% | 45.2 5% | 49.2 -3% |
| Нагрузка, макс. на дне * (°C) | 42.2 | 45.8 -9% | 44.8 -6% | 60 -42% | 44 -4% | 50.2 -19% |
| В простое сверху * (°C) | 35.2 | 29.2 17% | 30.6 13% | 30.9 12% | 33.6 5% | 29.4 16% |
| В простое на дне * (°C) | 35 | 31 11% | 31 11% | 34.7 1% | 32.6 7% | 30 14% |
* ... меньше = лучше
Стресс-тест
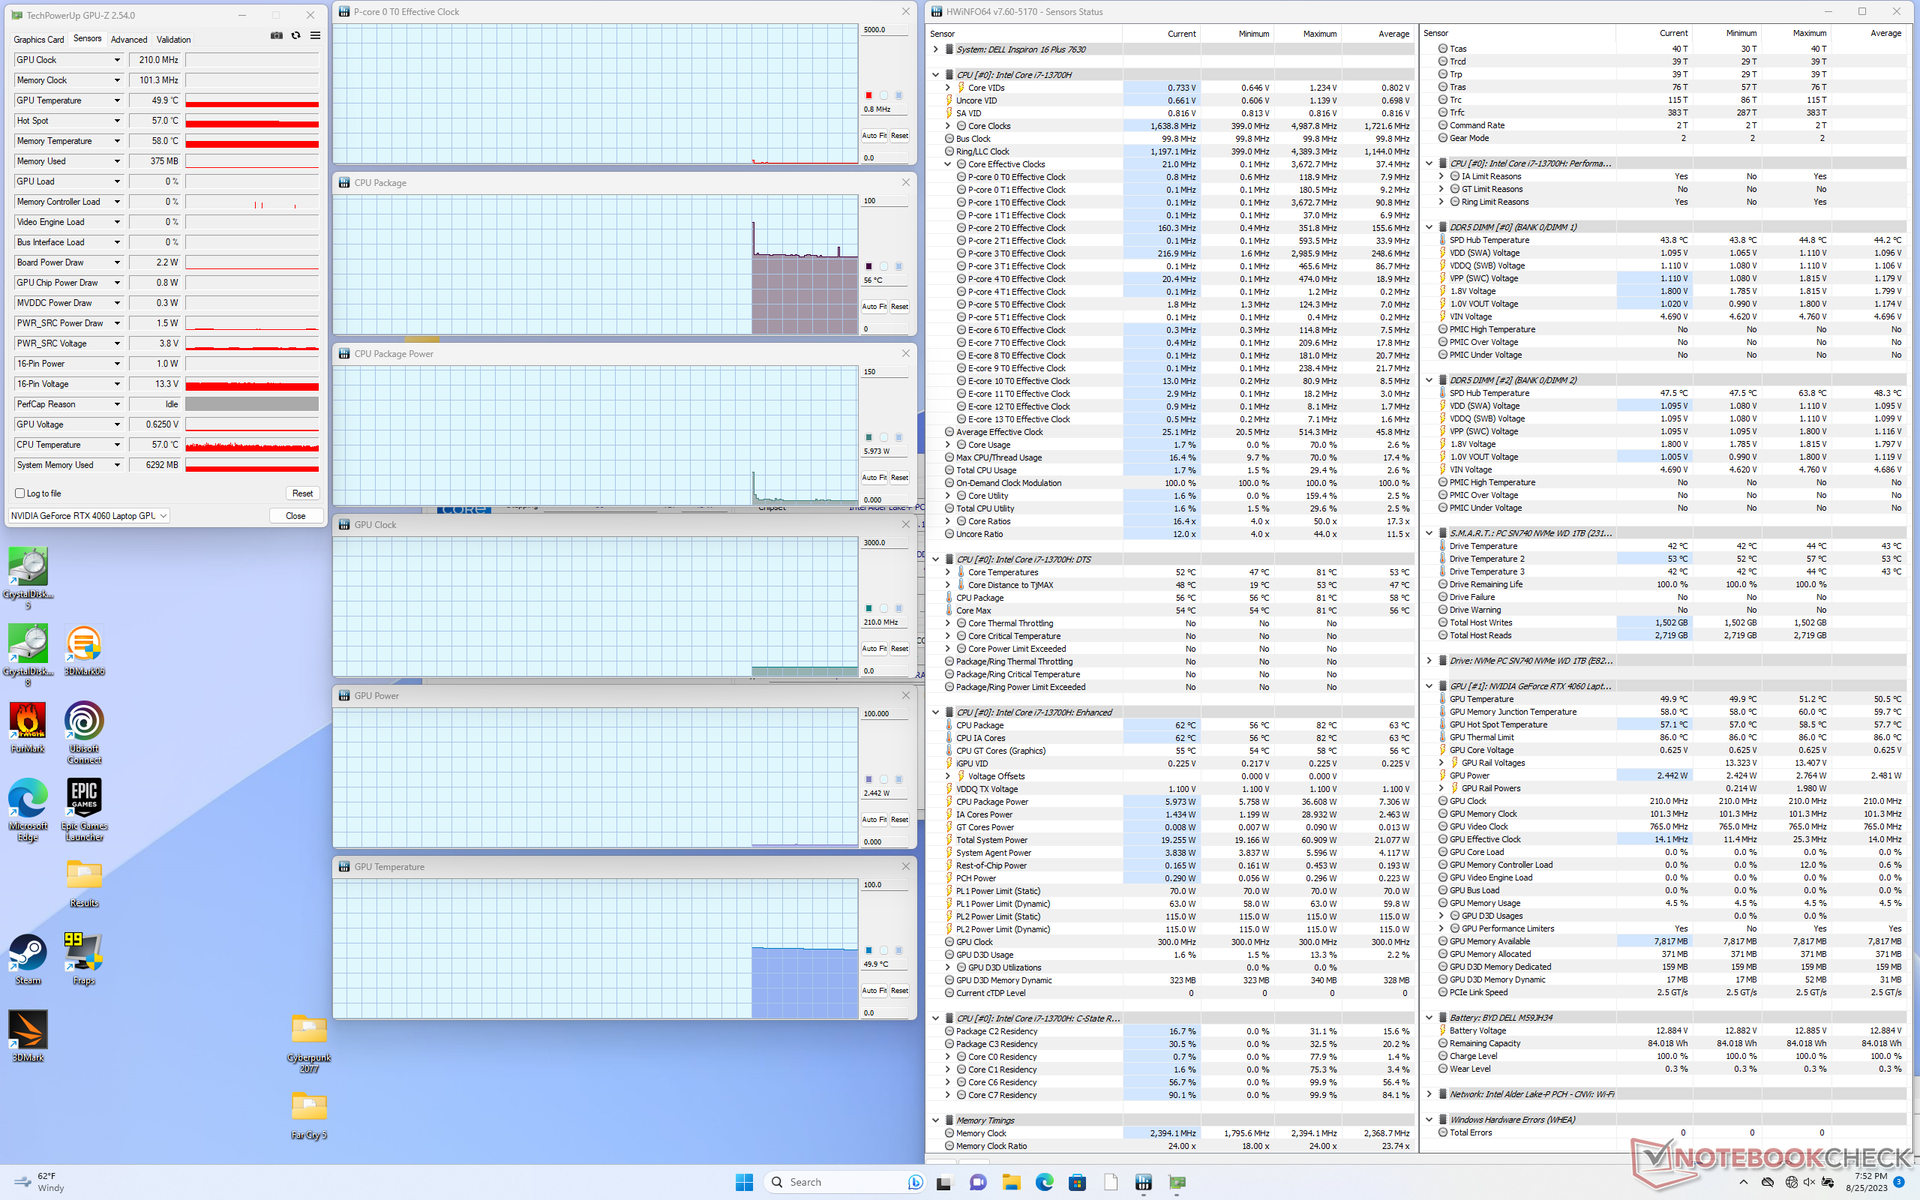
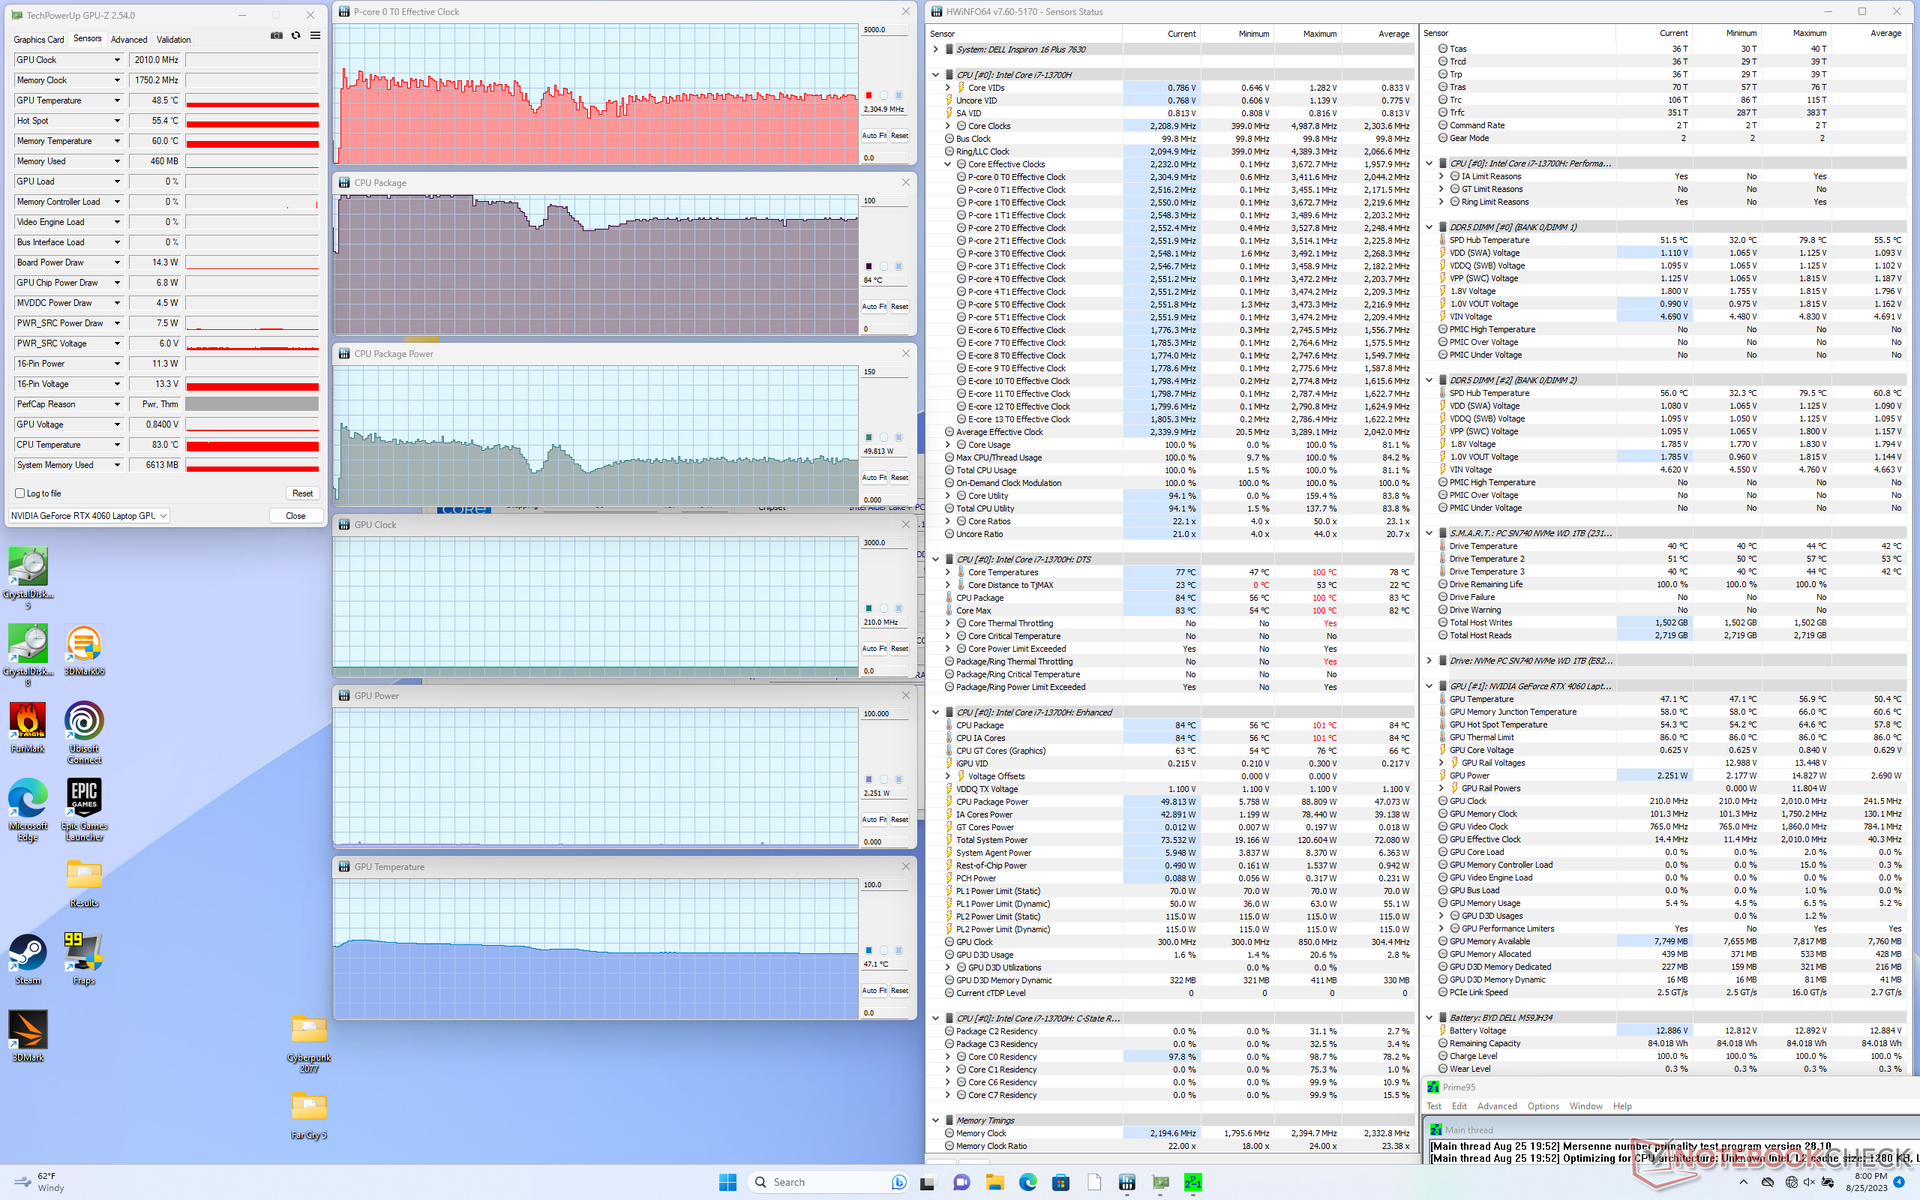
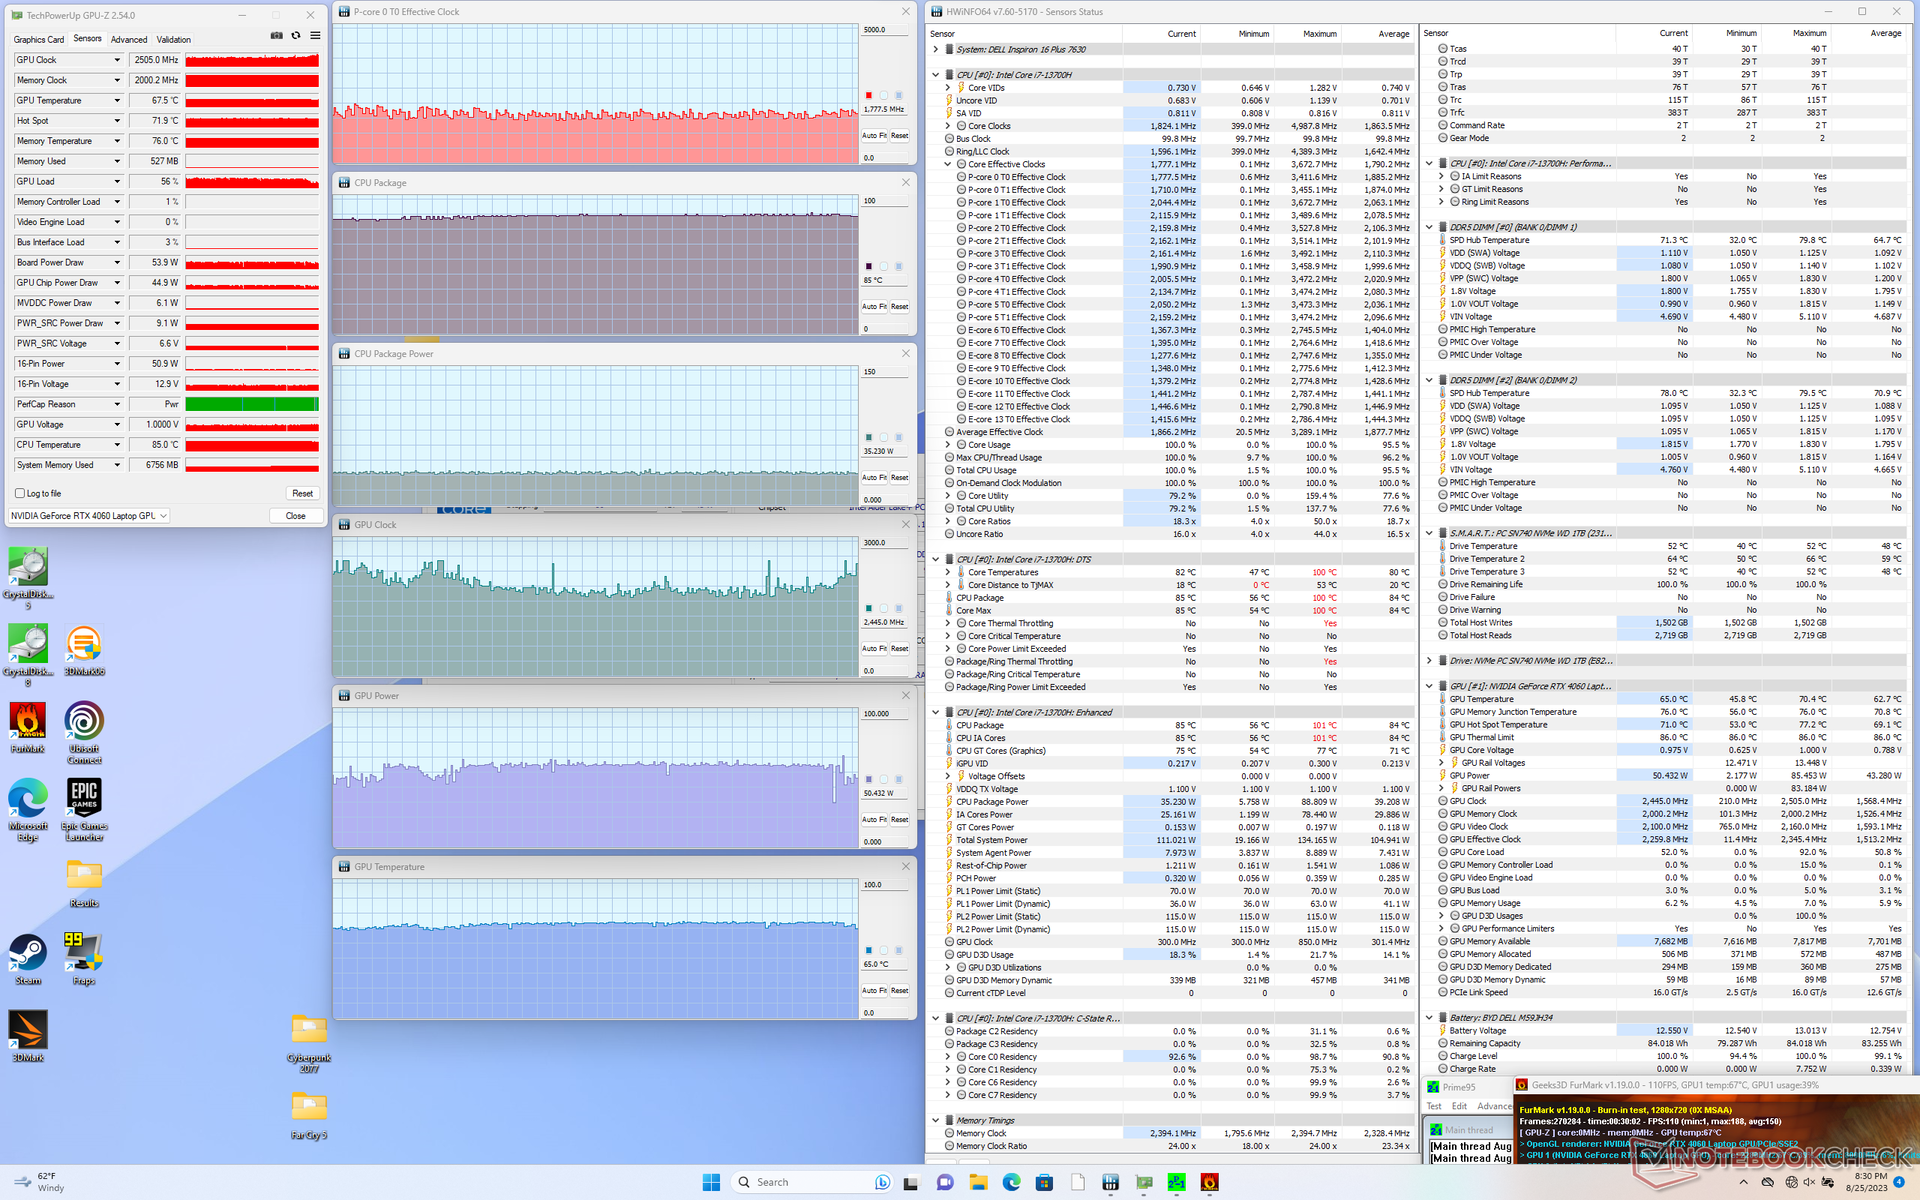
В Prime95 процессор ускоряется до 3.4 ГГц при 89 Вт и разогревается до 100 градусов Цельсия, прежде чем стабилизируется на 2.3 ГГц и 50 Вт ради удержания температуры на уровне 84 градусов. У прошлогодней модели показатели были практически такими же.
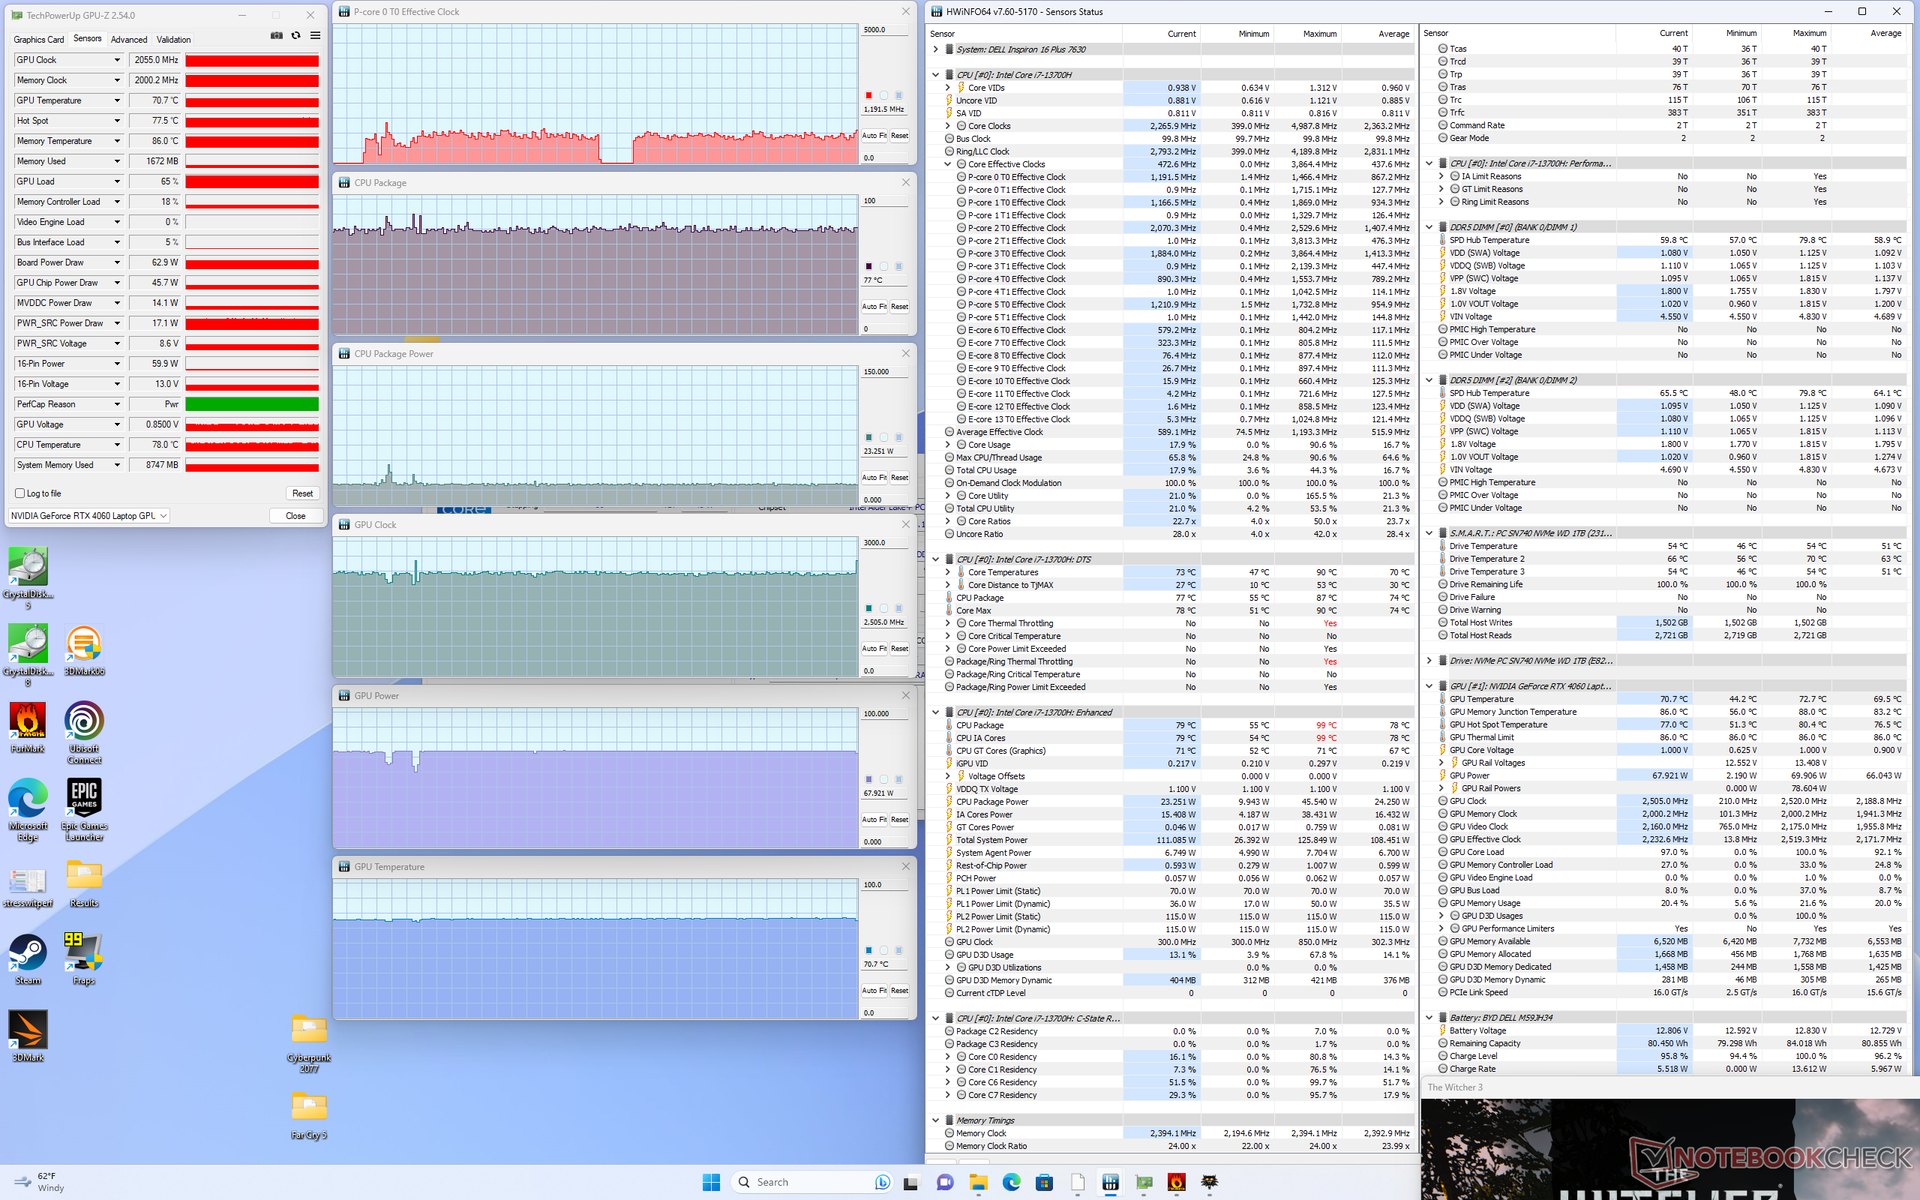
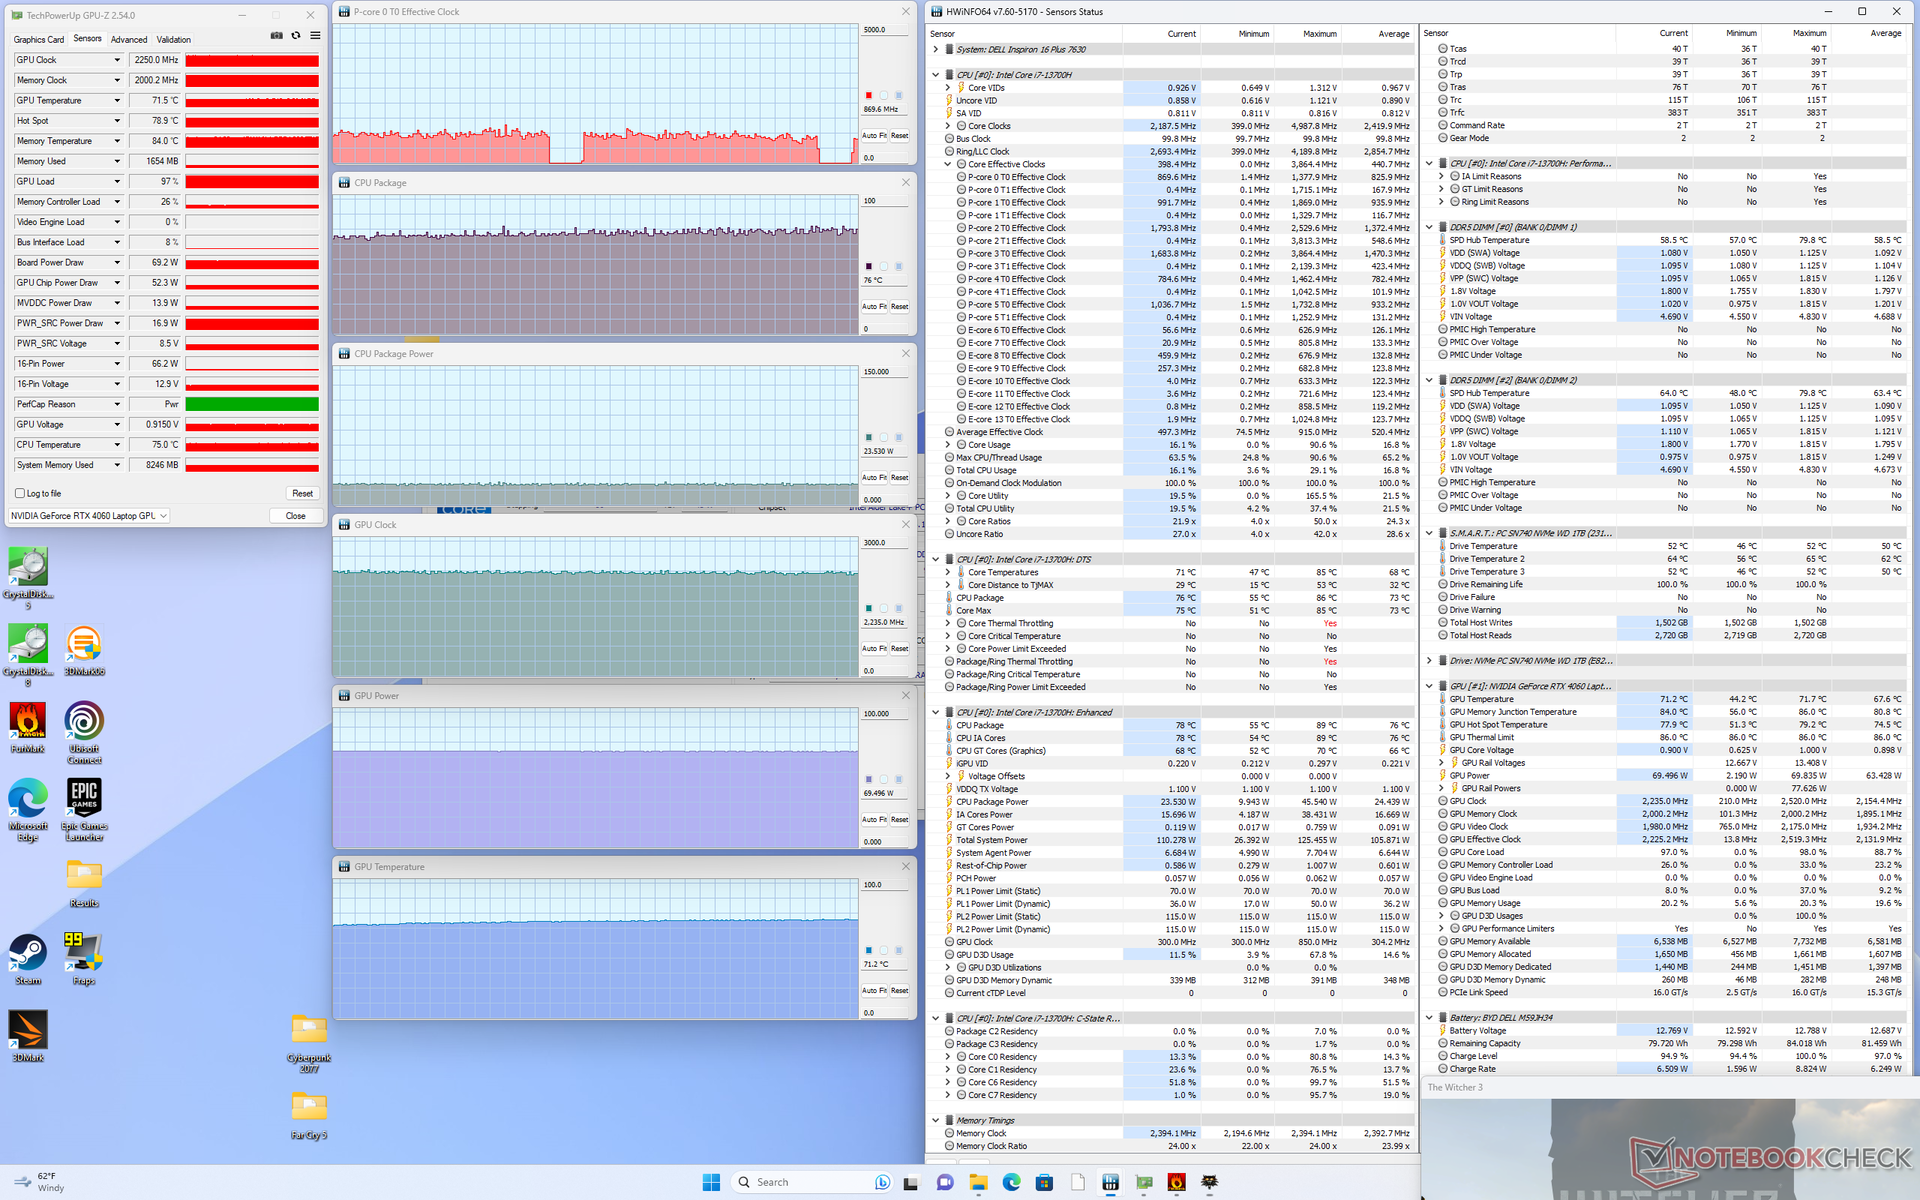
В Witcher 3 с профилем Performance видеокарта Nvidia работает на 2235 МГц при 71 градусе потребляя 69 Вт согласно HWiNFO. Переключение на Balanced практически не влияет на показатели, что и было предсказано Fire Strike. Интересно что нагрев значительно ниже, чем у Inspiron 16 Plus 7620 в аналогичных условиях - вероятно эффективность охлаждения действительно выше.
Заметим, что HWiNFO рапортует TGP 69 Вт в играх, хотя Dell заявляют данный показатель на уровне 60 Вт. Интересно, что в панели управления Nvidia указаны именно 70 Вт, а не 60.
| Частота ЦП (ГГц) | Частота ГП (МГц) | Средняя температура ЦП (°C) | Средняя температура ГП (°C) | |
| Без нагрузки | -- | -- | 56 | 50 |
| Prime95 | 2.3 - 2.4 | -- | 84 | 47 |
| Prime95 + FurMark | ~1.8 | ~2445 | 85 | 65 |
| Witcher 3 (Balanced) | ~1.1 | 2055 | 77 | 71 |
| Witcher 3 (Performance) | ~1.1 | 2250 | 76 | 71 |
Акустическая система
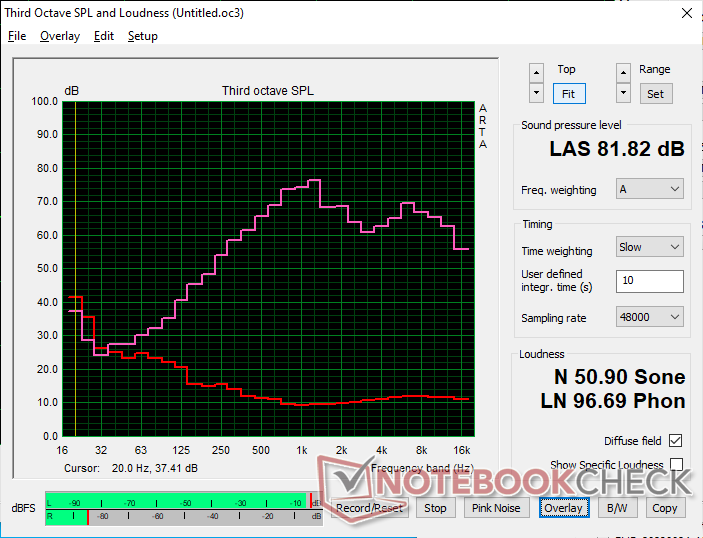
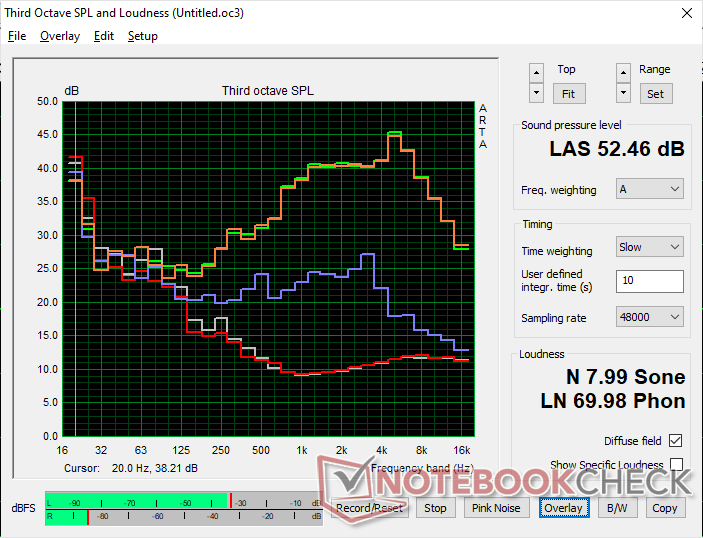
Анализ АЧХ аудиосистемы Dell Inspiron 16 Plus 7630
(±) | неплохой уровень макс. громкости (81.8 дБА)
Низкие частоты (100 Гц - 315 Гц)
(-) | баса почти нет (на 17% меньше медианы)
(±) | он умеренно сбалансирован
Средние частоты (400 Гц - 2000 Гц)
(±) | диапазон воспроизводится громче желаемого (отклонение 6.3% от медианы)
(+) | он ровный, без "горбов" или провалов
Высокие частоты (2 кГц - 16 кГц)
(+) | диапазон отлично сбалансирован (отклонение лишь 2.2% от медианы)
(+) | он ровный, без "горбов" или провалов
Весь диапазон (100 - 16000 Гц)
(±) | звук в целом не очень сбалансирован (15.9% отличия от медианы)
в сравнении с устройствами того же класса
» 40% прямо сравнимых устройств показал(и) себя лучше, 6% примерно так же, 54% значительно хуже
» Δ наилучшего устройства из прямо сравнимых: 5%, средняя Δ: 17%, худший результат: 45%
в сравнении со всеми тестированными устройствами
» 25% известных нам устройств показал(и) себя лучше, 5% примерно так же, 70% значительно хуже
» Δ наилучшего устройства среди известных нам: 4%, средняя Δ: 23%, худший результат: 134%
Анализ АЧХ аудиосистемы Apple MacBook Pro 16 2021 M1 Pro
(+) | отличный уровень макс. громкости (84.7 дБА)
Низкие частоты (100 Гц - 315 Гц)
(+) | бас отлично сбалансирован (отклонение лишь 3.8% от медианы)
(+) | он ровный, без "горбов" или провалов
Средние частоты (400 Гц - 2000 Гц)
(+) | диапазон не провален и не выпячен (отклонение лишь 1.3% от медианы)
(+) | он ровный, без "горбов" или провалов
Высокие частоты (2 кГц - 16 кГц)
(+) | диапазон отлично сбалансирован (отклонение лишь 1.9% от медианы)
(+) | он ровный, без "горбов" или провалов
Весь диапазон (100 - 16000 Гц)
(+) | звук в целом сбалансирован (4.6% отличия от медианы)
в сравнении с устройствами того же класса
» 0% прямо сравнимых устройств показал(и) себя лучше, 0% примерно так же, 100% значительно хуже
» Δ наилучшего устройства из прямо сравнимых: 5%, средняя Δ: 17%, худший результат: 45%
в сравнении со всеми тестированными устройствами
» 0% известных нам устройств показал(и) себя лучше, 0% примерно так же, 100% значительно хуже
» Δ наилучшего устройства среди известных нам: 4%, средняя Δ: 23%, худший результат: 134%
Энергопотребление и автономная работа
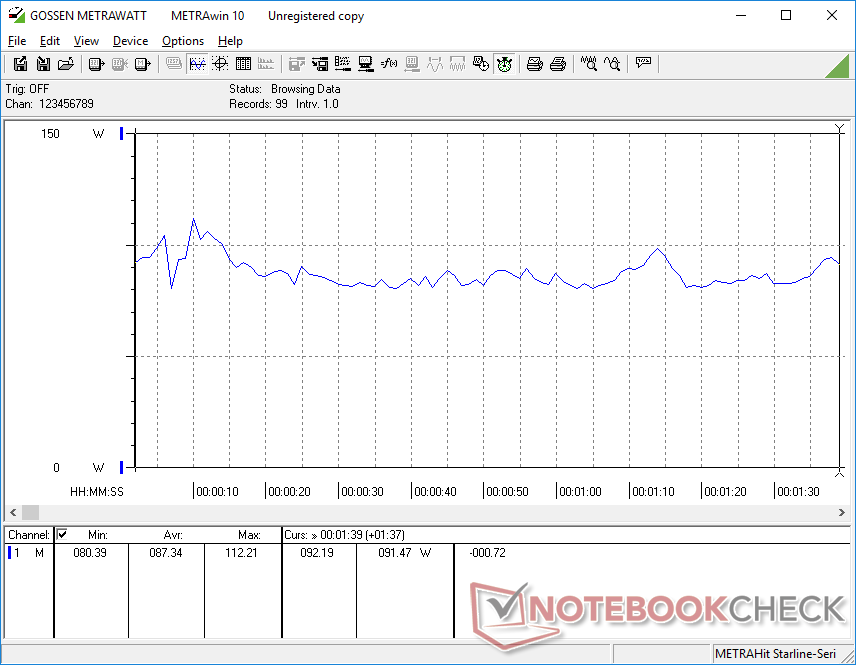
Энергопотребление
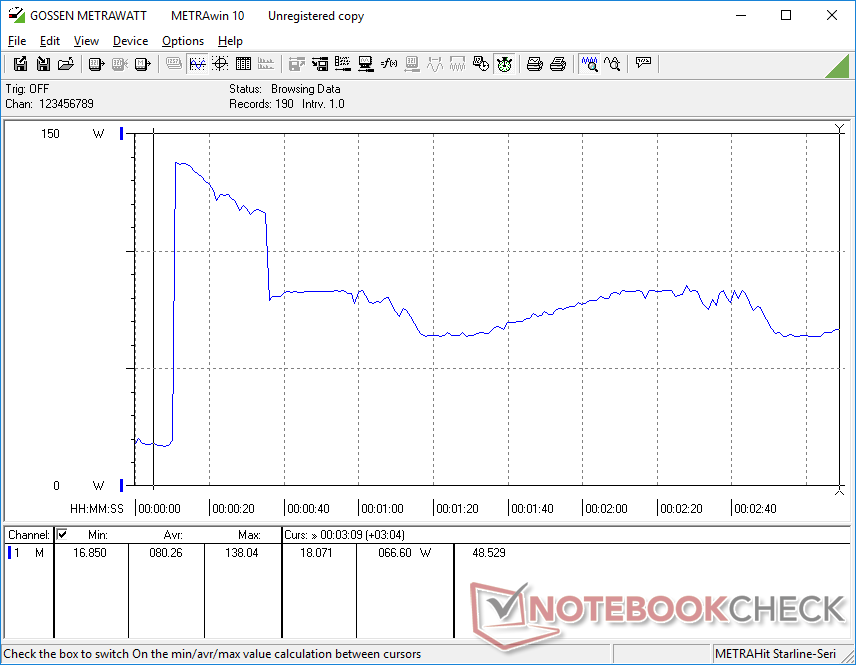
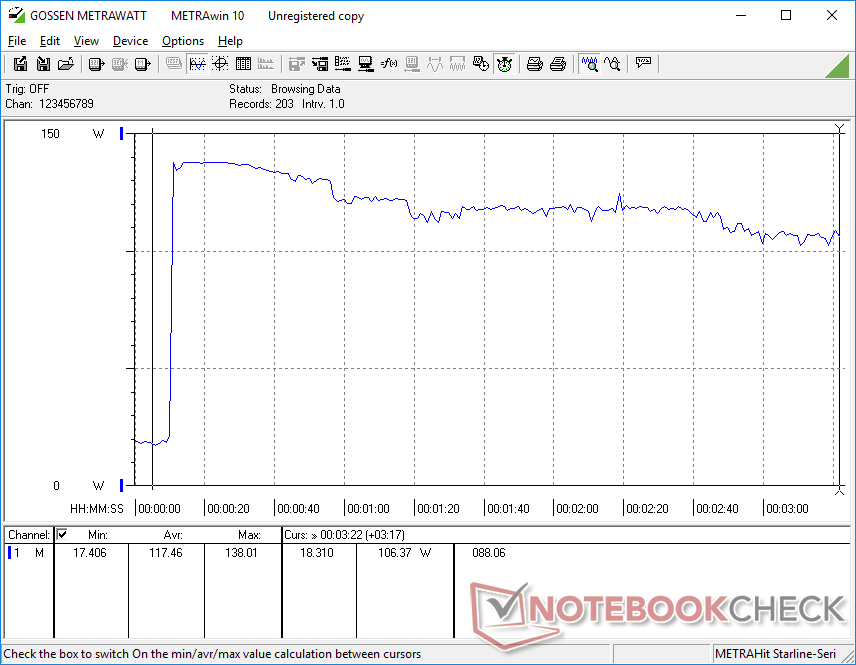
Энергопотребление немного выше, чем у предыдущей модели в простое и в играх. Впрочем, 8% увеличение потребления, которое дает 40-60% прирост производительности видеокарты - отличный результат. Энергоэффективность новой модели значительно лучше.
Игровые ноутбуки на базе RTX 4060 обычно намного более прожорливы. Для сравнения, Acer Nitro 17 потребляет на 30 Вт больше.
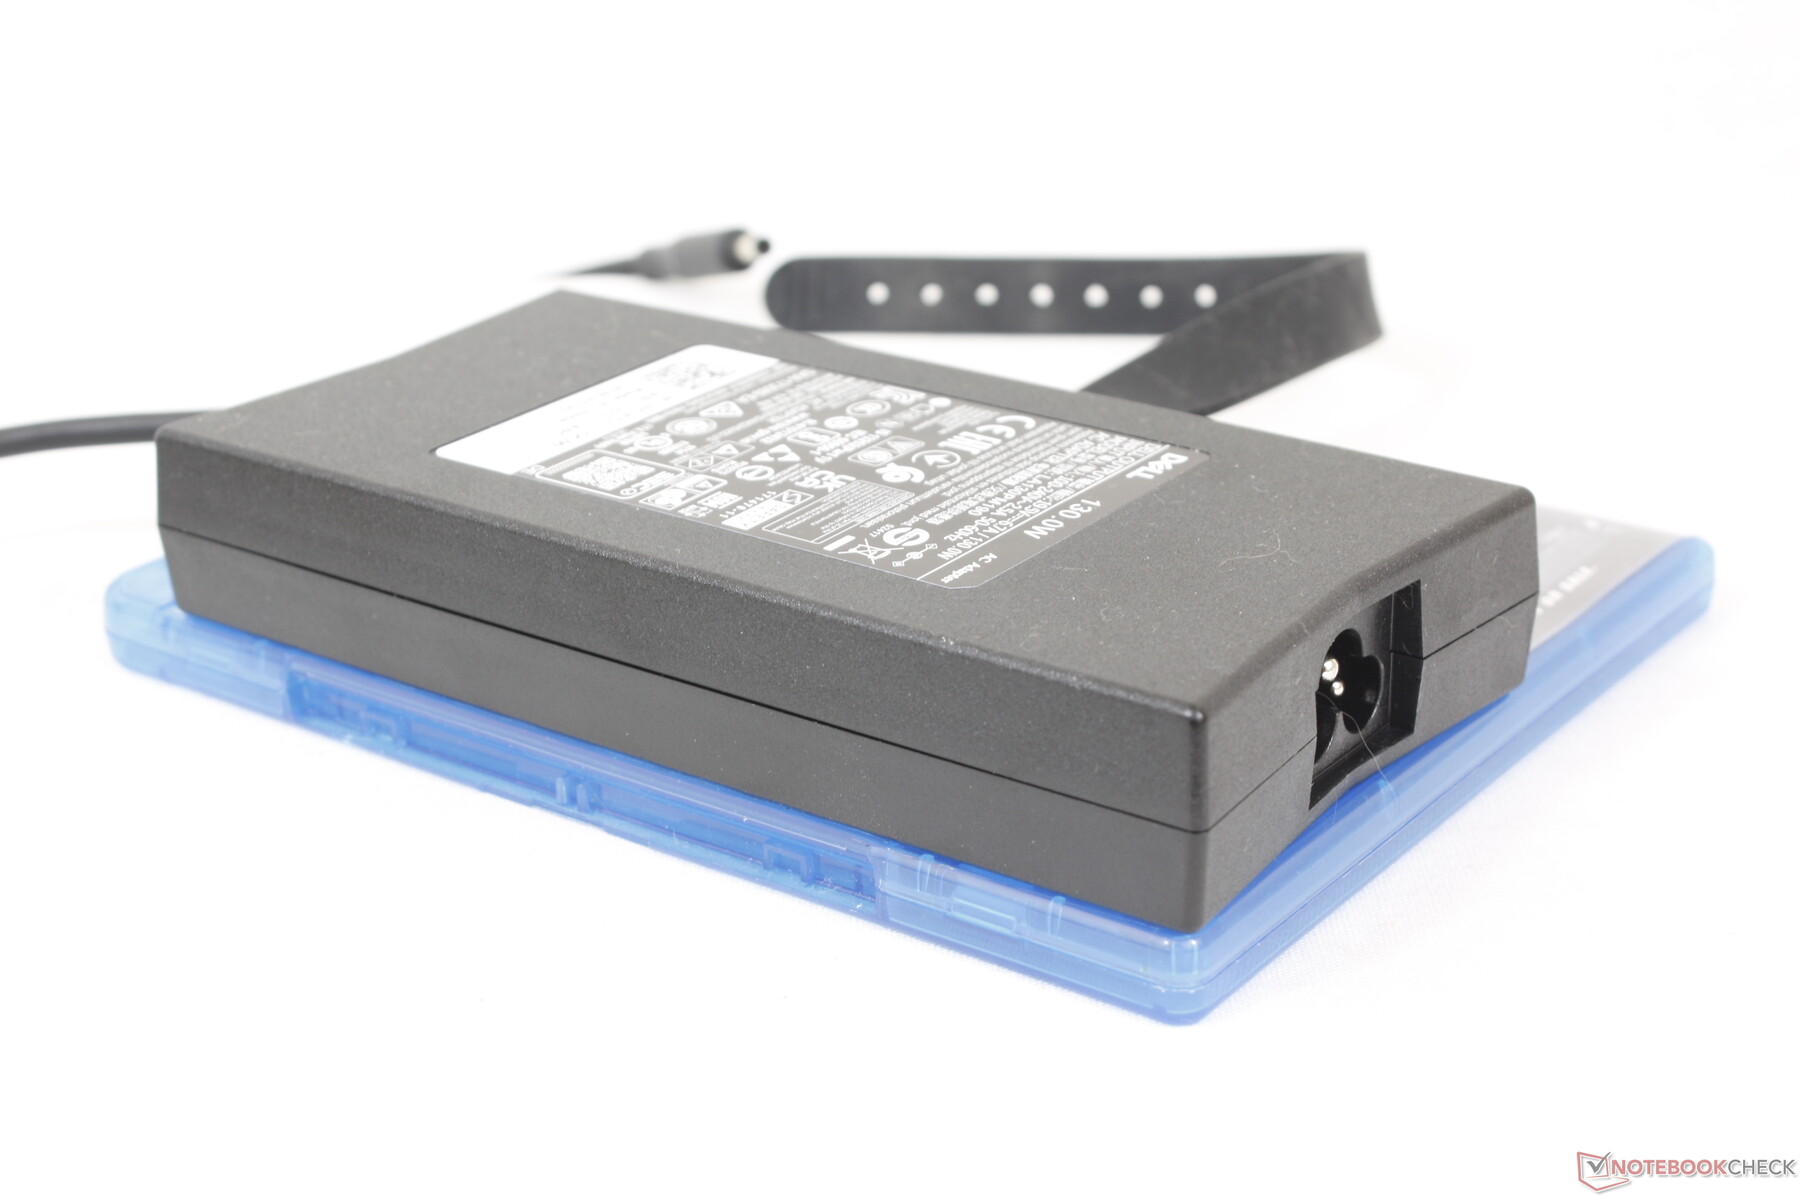
Пиковое потребление системы оставило 138 Вт, мощность комплектного адаптера при этом насчитывает 130 Вт (~15 x 7.4 x 2.5 см). Конфигурация без дискретной видеокарты поставляется с более слабым адаптером на 90 Вт.
| Выкл. | |
| Ожидание | |
| Нагрузка |
|
Легенда:
min: | |
| Dell Inspiron 16 Plus 7630 i7-13700H, GeForce RTX 4060 Laptop GPU, WD PC SN740 SDDPTQD-1T00, IPS, 2560x1600, 16" | Dell Inspiron 16 Plus 7620 i7-12700H, GeForce RTX 3050 Ti Laptop GPU, Kioxia BG5 KBG50ZNS512G, IPS, 3072x1920, 16" | Lenovo Slim Pro 9i 16IRP8 i9-13905H, GeForce RTX 4050 Laptop GPU, Samsung PM9A1 MZVL21T0HCLR, Mini-LED, 3200x2000, 16" | Asus Vivobook Pro 16X K6604JV-MX016W i9-13980HX, GeForce RTX 4060 Laptop GPU, Solidigm P41 Plus SSDPFKNU010TZ, OLED, 3200x2000, 16" | HP Envy 16 h0112nr i7-12700H, GeForce RTX 3060 Laptop GPU, Micron 3400 1TB MTFDKBA1T0TFH, OLED, 3840x2400, 16" | MSI Summit E16 Flip A12UDT-031 i7-1280P, GeForce RTX 3050 Ti Laptop GPU, Samsung PM9A1 MZVL22T0HBLB, IPS, 2560x1600, 16" | |
|---|---|---|---|---|---|---|
| Энергопотребление | 15% | -28% | -23% | -9% | 22% | |
| В простое, мин. * (Watt) | 15.6 | 6.8 56% | 16 -3% | 13.8 12% | 10 36% | 9.8 37% |
| В простое, сред. * (Watt) | 17.7 | 9.6 46% | 30 -69% | 16 10% | 10.9 38% | 15.3 14% |
| В простое, макс. * (Watt) | 20.6 | 17 17% | 30.4 -48% | 19 8% | 27.8 -35% | 16.3 21% |
| Нагрузка, сред. * (Watt) | 87.4 | 117.5 -34% | 78.9 10% | 147 -68% | 116.4 -33% | 87 -0% |
| Witcher 3 ultra * (Watt) | 121.7 | 113.1 7% | 155.3 -28% | 147.8 -21% | 133.7 -10% | 86.1 29% |
| Нагрузка, макс. * (Watt) | 138 | 137.4 -0% | 180.4 -31% | 244 -77% | 209.8 -52% | 100 28% |
* ... меньше = лучше
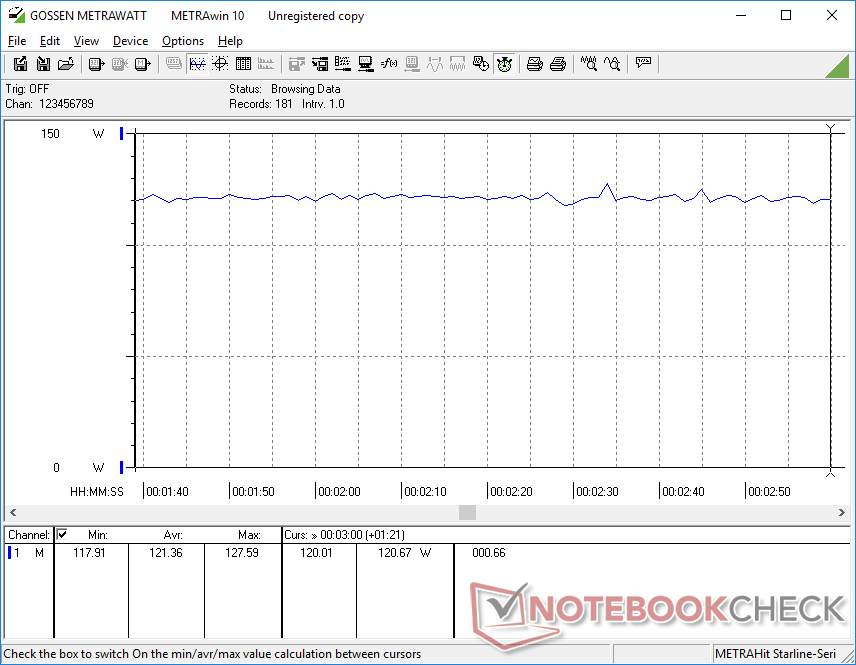
Энергопотребление: Witcher 3, Стресс-тест
Энергопотребление с внешним монитором
Автономность
Емкость батареи не изменилась, как и автономность ноутбука. Модель по-прежнему работает 9.5 часов в нашем Wi-Fi тесте с профилем Balanced.
На полную зарядку уходит около 90 минут с комплектным адаптером. Ноутбук также поддерживает зарядку через USB Type-C.
| Dell Inspiron 16 Plus 7630 i7-13700H, GeForce RTX 4060 Laptop GPU, 86 Вт⋅ч | Dell Inspiron 16 Plus 7620 i7-12700H, GeForce RTX 3050 Ti Laptop GPU, 86 Вт⋅ч | Lenovo Slim Pro 9i 16IRP8 i9-13905H, GeForce RTX 4050 Laptop GPU, 75 Вт⋅ч | Asus Vivobook Pro 16X K6604JV-MX016W i9-13980HX, GeForce RTX 4060 Laptop GPU, 90 Вт⋅ч | HP Envy 16 h0112nr i7-12700H, GeForce RTX 3060 Laptop GPU, 83 Вт⋅ч | MSI Summit E16 Flip A12UDT-031 i7-1280P, GeForce RTX 3050 Ti Laptop GPU, 82 Вт⋅ч | |
|---|---|---|---|---|---|---|
| Время работы | -2% | -30% | -12% | -0% | -24% | |
| В простое (h) | 17.6 | 18.6 6% | 17.8 1% | |||
| Чтение сайтов по Wi-Fi v.2 (h) | 9.4 | 9.6 2% | 6.6 -30% | 6.5 -31% | 7.9 -16% | 7.1 -24% |
| Нагрузка и 100% яркости (h) | 1.4 | 1.2 -14% | 1.5 7% | 1.6 14% | ||
| Воспр. видео H.264 (h) | 5.3 |
За
Против
Вердикт
Изменений относительно прошлогоднего Inspiron 16 Plus 7620 оказалось значительно больше, нежели мы ожидали. Помимо громадного скачка производительности при переходе с RTX 3050 Ti на RTX 4060, в глаза бросаются изменения уровня шумности и снижение нагрева корпуса. Набор доступных дисплеев иной и теперь включает экран с частотой 120 Гц, а на материнской плате теперь установлены два слота SODIMM. Мы также приветствуем появление более надежных увеличенных шарниров. Чисто по пользовательским впечатлениям ноутбук изменился в лучшую сторону, несмотря на то, что производительность процессора осталась прежней, как и клавиатура.
Inspiron 16 Plus 7630 за правильный баланс. Производительность и характеристики как раз на хорошем уровне по меркам мультимедийного класса, а цена вполне адекватная
Как универсальный и сбалансированный мультимедийный ноутбук, Inspiron 16 Plus 7630, впрочем, недосчитывается пары особенностей в своем списке. Так, покупателей может расстроить отсутствие поддержки DCI-P3, экранов с большим разрешением и быстрого картридера. Любителям игр будет грустно из-за отсутствия G-Sync и MUX, а также сниженной производительности RTX 4060. Inspiron 16 Plus 7630 хорошо подходит для работы с контентом и игр, но для более профессионального использования придется смотреть в сторону HP Envy 16 и Asus ZenBook Pro Duo. Если же игры превалируют над работой, стоит рассматривать модели Dell G-серии или Asus ROG.
Dell Inspiron 16 Plus 7630
- 30 August 2023 v7 (old)
Allen Ngo
Декларация о непредвзятости
Отбор устройств для обзора осуществляется нашей редакцией. Тестовый образец был предоставлен автору производителем или продавцом для целей настоящего обзора. Кредитор не имел никакого влияния на этот обзор, и производитель не получил копию этого обзора до публикации. Обязанности публиковать этот обзор не было. Являясь независимой медиа-компанией, Notebookcheck не подчиняется власти производителей, розничных продавцов или издателей.
Вот как проводит тестирование Notebookcheck
Каждый год Notebookcheck независимо проверяет сотни ноутбуков и смартфонов, используя стандартизированные процедуры, чтобы гарантировать сопоставимость всех результатов. В течение примерно 20 лет мы постоянно совершенствовали наши методы испытаний и при этом установили отраслевые стандарты. В наших испытательных лабораториях опытные специалисты и редакторы используют высококачественное измерительное оборудование. Эти тесты включают в себя многоэтапный процесс проверки. Наша сложная рейтинговая система основана на сотнях обоснованных измерений и критериев, что обеспечивает объективность.
Price comparison

