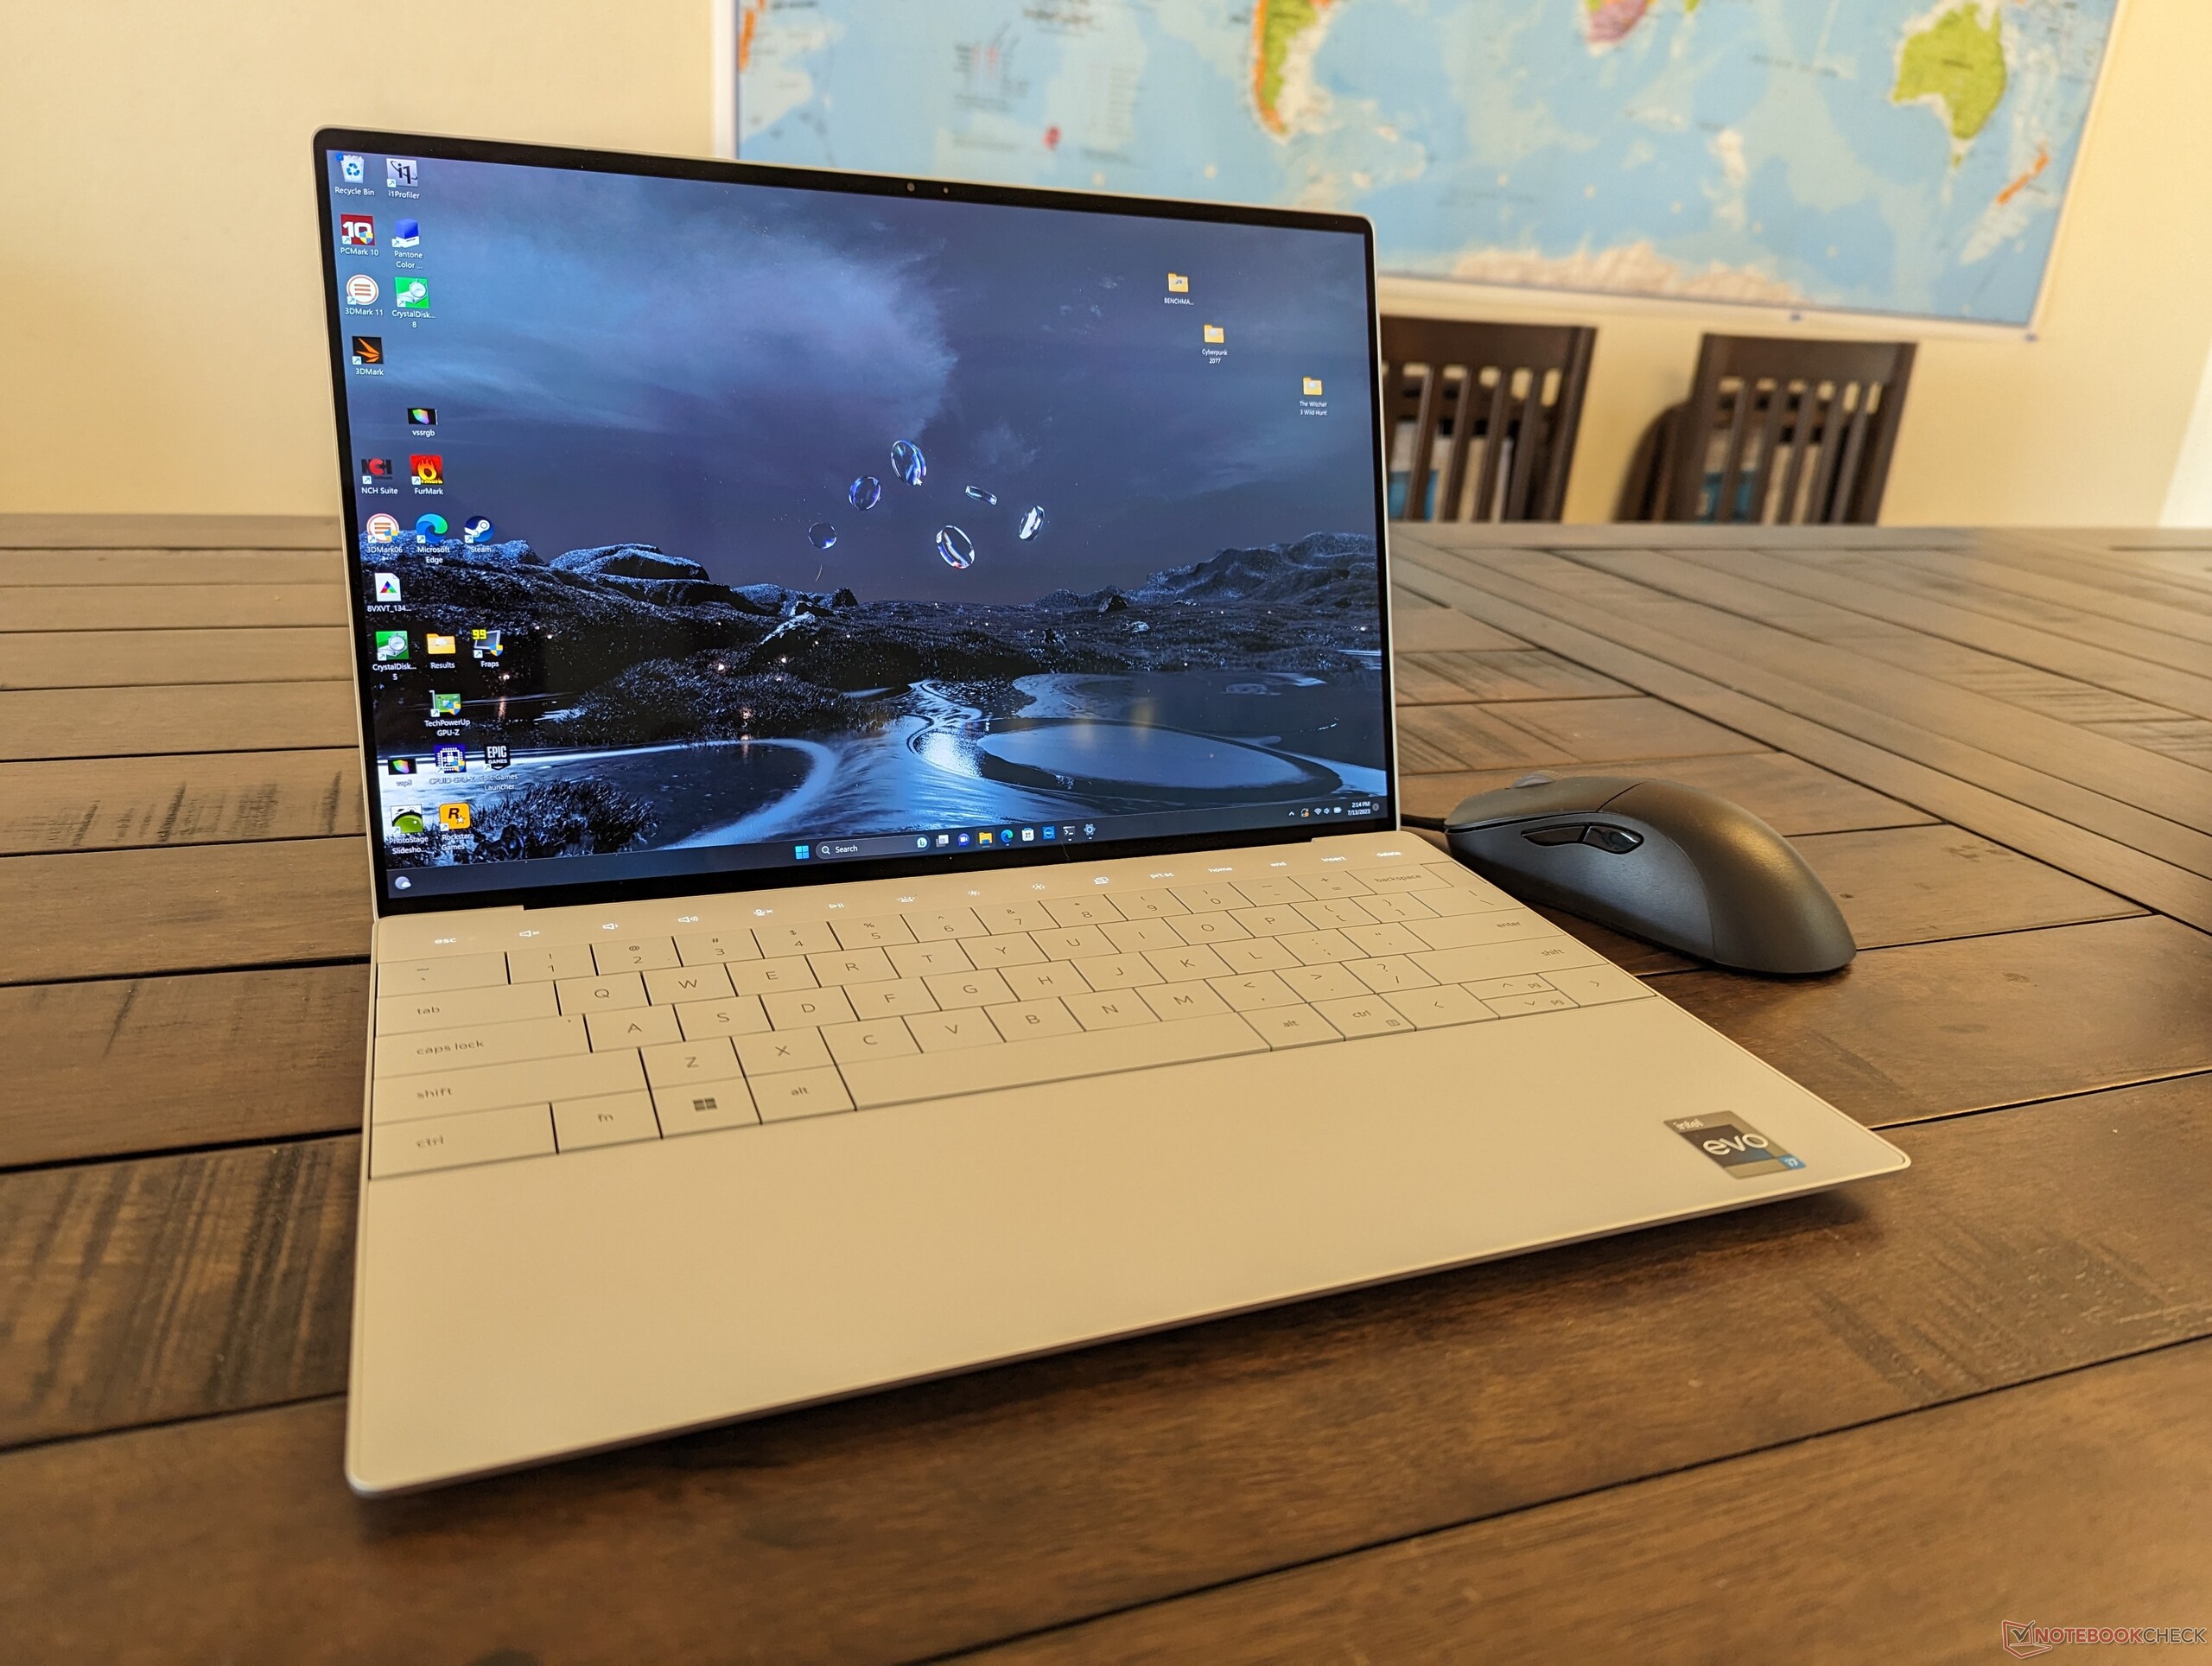
Обзор ноутбука Dell XPS 13 Plus 9320 (2023, Core i7-1360P)

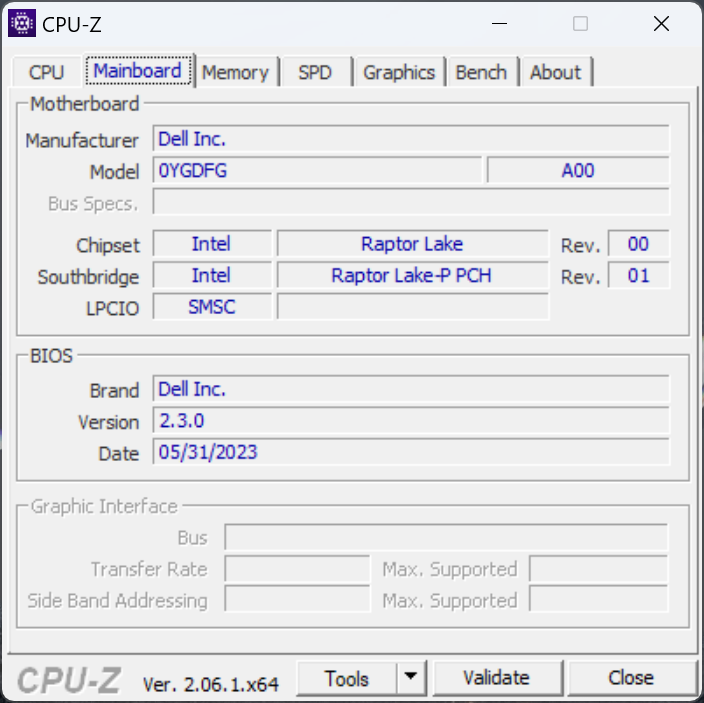
XPS 13 Plus 9320 - обновленная модель, основанная на предшественнике 2022 года. Производитель взял знакомый корпус и установил процессор Raptor Lake вместо предыдущего Alder Lake. По этой причине мы не станем повторять все известные подробности о ноутбуке в этом обзоре - все они доступны в статье о модели 2022 года.
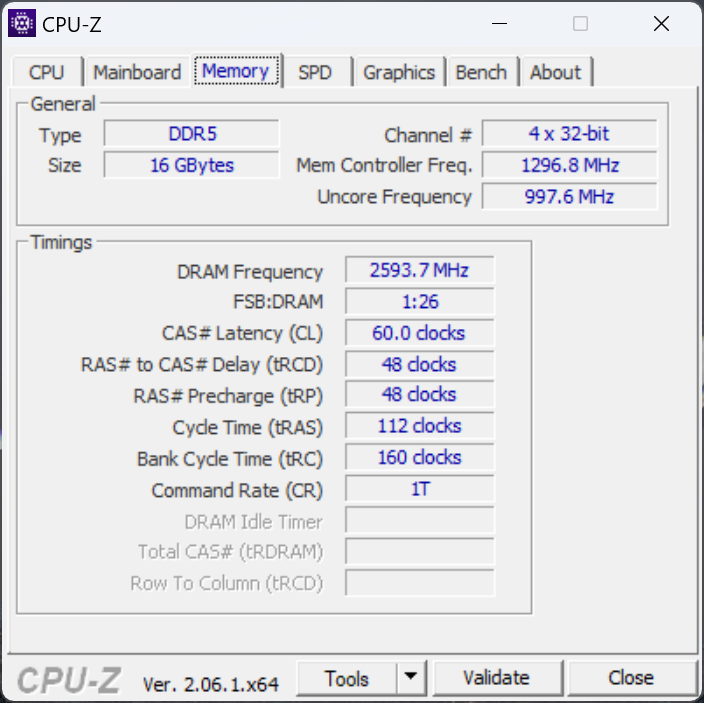
Тестируемая конфигурация несет на борту 13.4-дюймовый сенсорный 3.5K (3456 x 2160) OLED экран и 16 ГБ быстрой оперативной памяти LPDDR5-6000, а также оценивается производителем в $1300. Для ноутбука также доступны 1200p и 2400p дисплеи, но процессор пока-что только один - Core i7-1360P.
Конкуренты XPS 13 Plus - флагманские 13-дюймовые субноутбуки, вроде Framework Laptop 13.5, HP Spectre x360 13.5 и Lenovo ThinkPad X13 G3.
Соперники
Рейтинг | Дата | Модель | Вес | Height | Размер | Разрешение | Цена |
|---|---|---|---|---|---|---|---|
| 87.4 % v7 (old) | August 2023 | Dell XPS 13 Plus 9320 Core i7-1360P i7-1360P, Iris Xe G7 96EUs | 1.3 килог. | 15.3 мм | 13.40" | 3456x2160 | |
| 87.3 % v7 (old) | September 2022 | Dell XPS 13 Plus 9320 i7-1280P OLED i7-1280P, Iris Xe G7 96EUs | 1.3 килог. | 15.28 мм | 13.40" | 3456x2160 | |
| 85.9 % v7 (old) | November 2019 | Dell XPS 13 7390 Core i7-10710U i7-10710U, UHD Graphics 620 | 1.2 килог. | 11.6 мм | 13.30" | 3840x2160 | |
| 86.2 % v7 (old) | May 2023 | Framework Laptop 13.5 13th Gen Intel i7-1370P, Iris Xe G7 96EUs | 1.3 килог. | 15.85 мм | 13.50" | 2256x1504 | |
| 89.1 % v7 (old) | Lenovo ThinkPad X13 Yoga G3 21AW003UGE i7-1265U, Iris Xe G7 96EUs | 1.2 килог. | 15.9 мм | 13.30" | 2560x1600 | ||
| 90.3 % v7 (old) | September 2022 | HP Spectre x360 13.5 14t-ef000 i7-1255U, Iris Xe G7 96EUs | 1.4 килог. | 17 мм | 13.50" | 3000x2000 |
Дизайн и особенности
Оснащение
| Networking | |
| iperf3 transmit AX12 | |
| Dell XPS 13 7390 Core i7-10710U | |
| iperf3 receive AX12 | |
| Dell XPS 13 7390 Core i7-10710U | |
| iperf3 transmit AXE11000 | |
| Dell XPS 13 Plus 9320 Core i7-1360P | |
| Framework Laptop 13.5 13th Gen Intel | |
| Lenovo ThinkPad X13 Yoga G3 21AW003UGE | |
| iperf3 receive AXE11000 | |
| Lenovo ThinkPad X13 Yoga G3 21AW003UGE | |
| Dell XPS 13 Plus 9320 Core i7-1360P | |
| Framework Laptop 13.5 13th Gen Intel | |
| iperf3 transmit AXE11000 6GHz | |
| HP Spectre x360 13.5 14t-ef000 | |
| Framework Laptop 13.5 13th Gen Intel | |
| Dell XPS 13 Plus 9320 Core i7-1360P | |
| iperf3 receive AXE11000 6GHz | |
| Framework Laptop 13.5 13th Gen Intel | |
| Dell XPS 13 Plus 9320 Core i7-1360P | |
| HP Spectre x360 13.5 14t-ef000 | |
Веб-камера
Веб-камера такая же, как у предшественника, что расстраивает, ведь многие соперники уже переходят на 5-МП камеры.


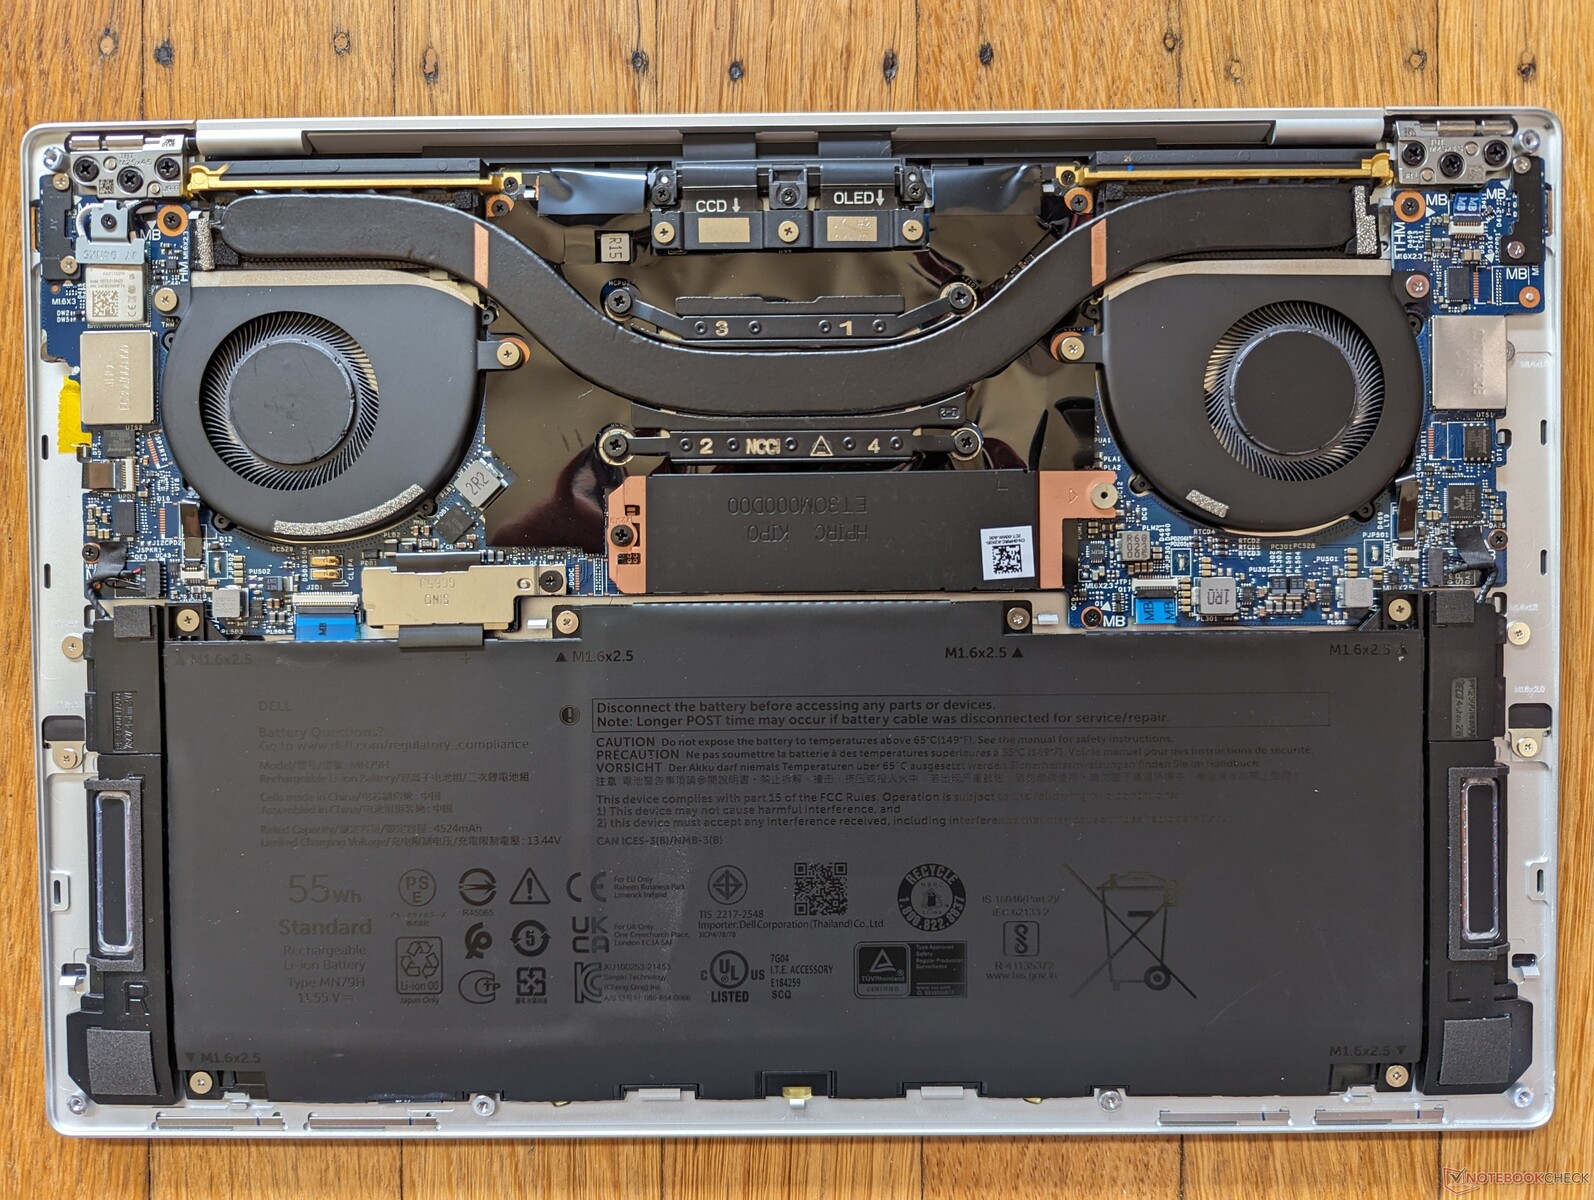
Обслуживание
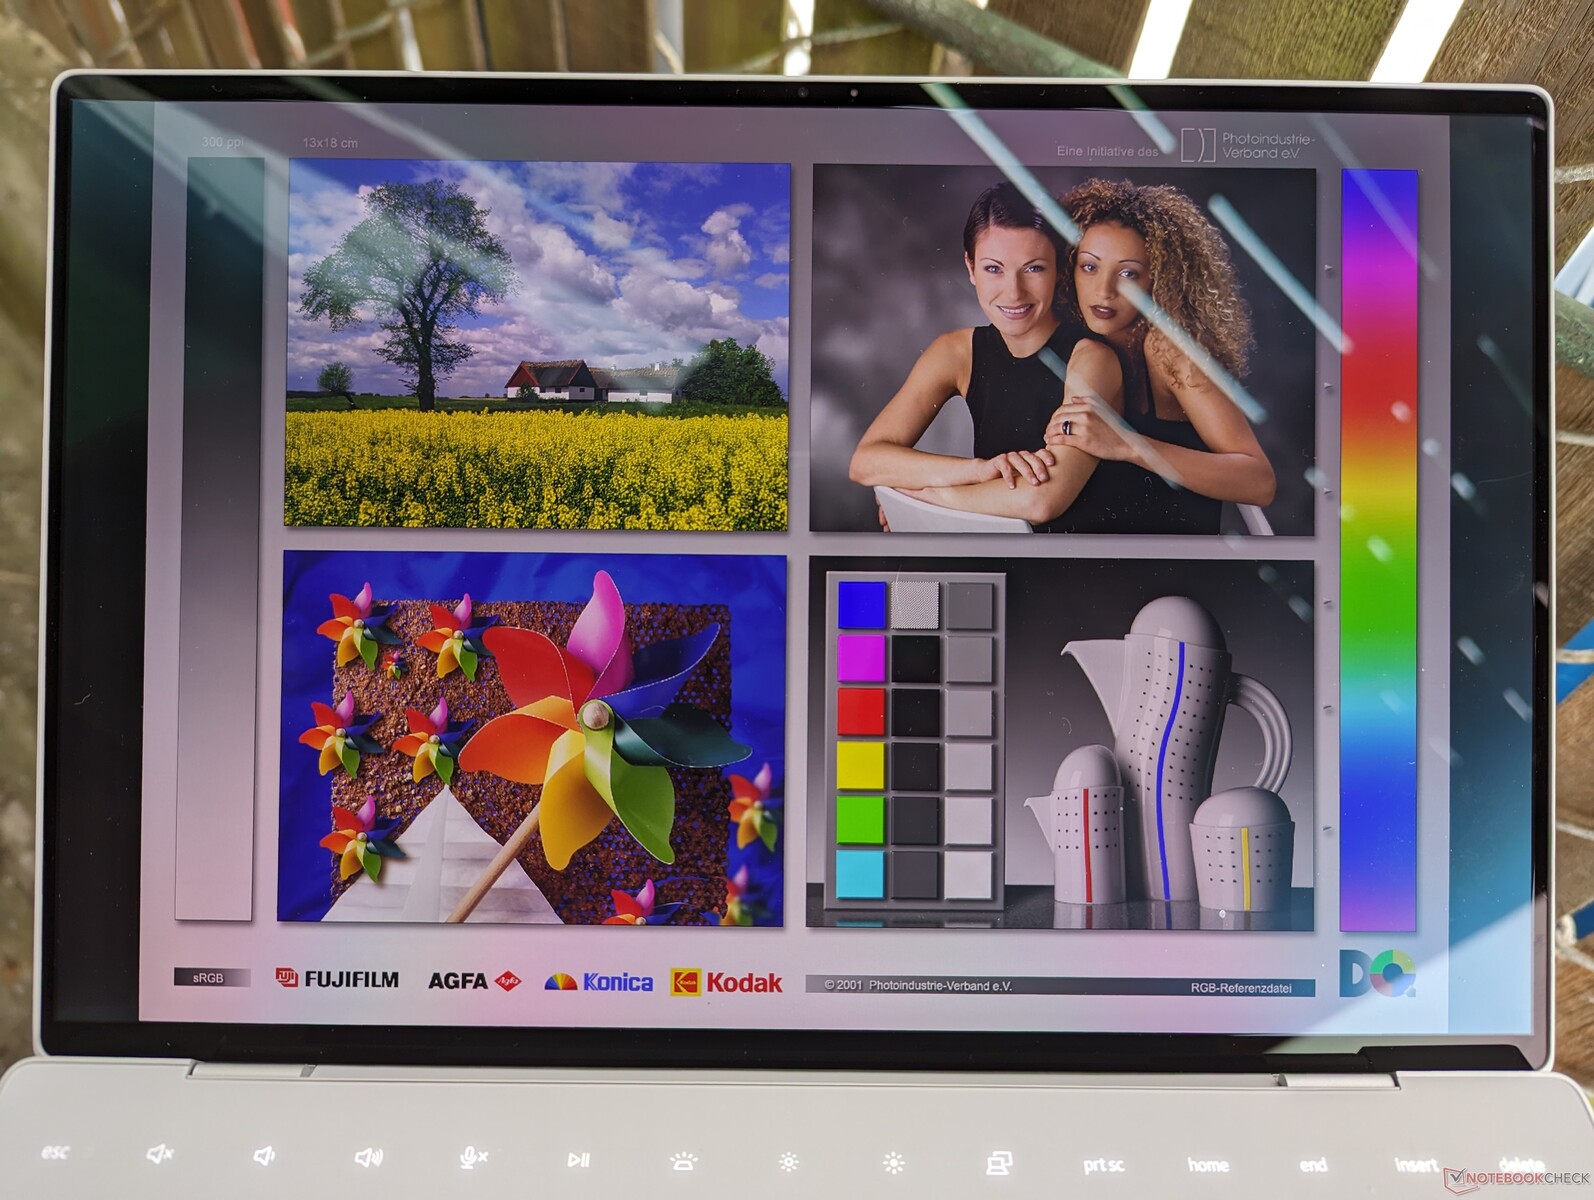
Дисплей
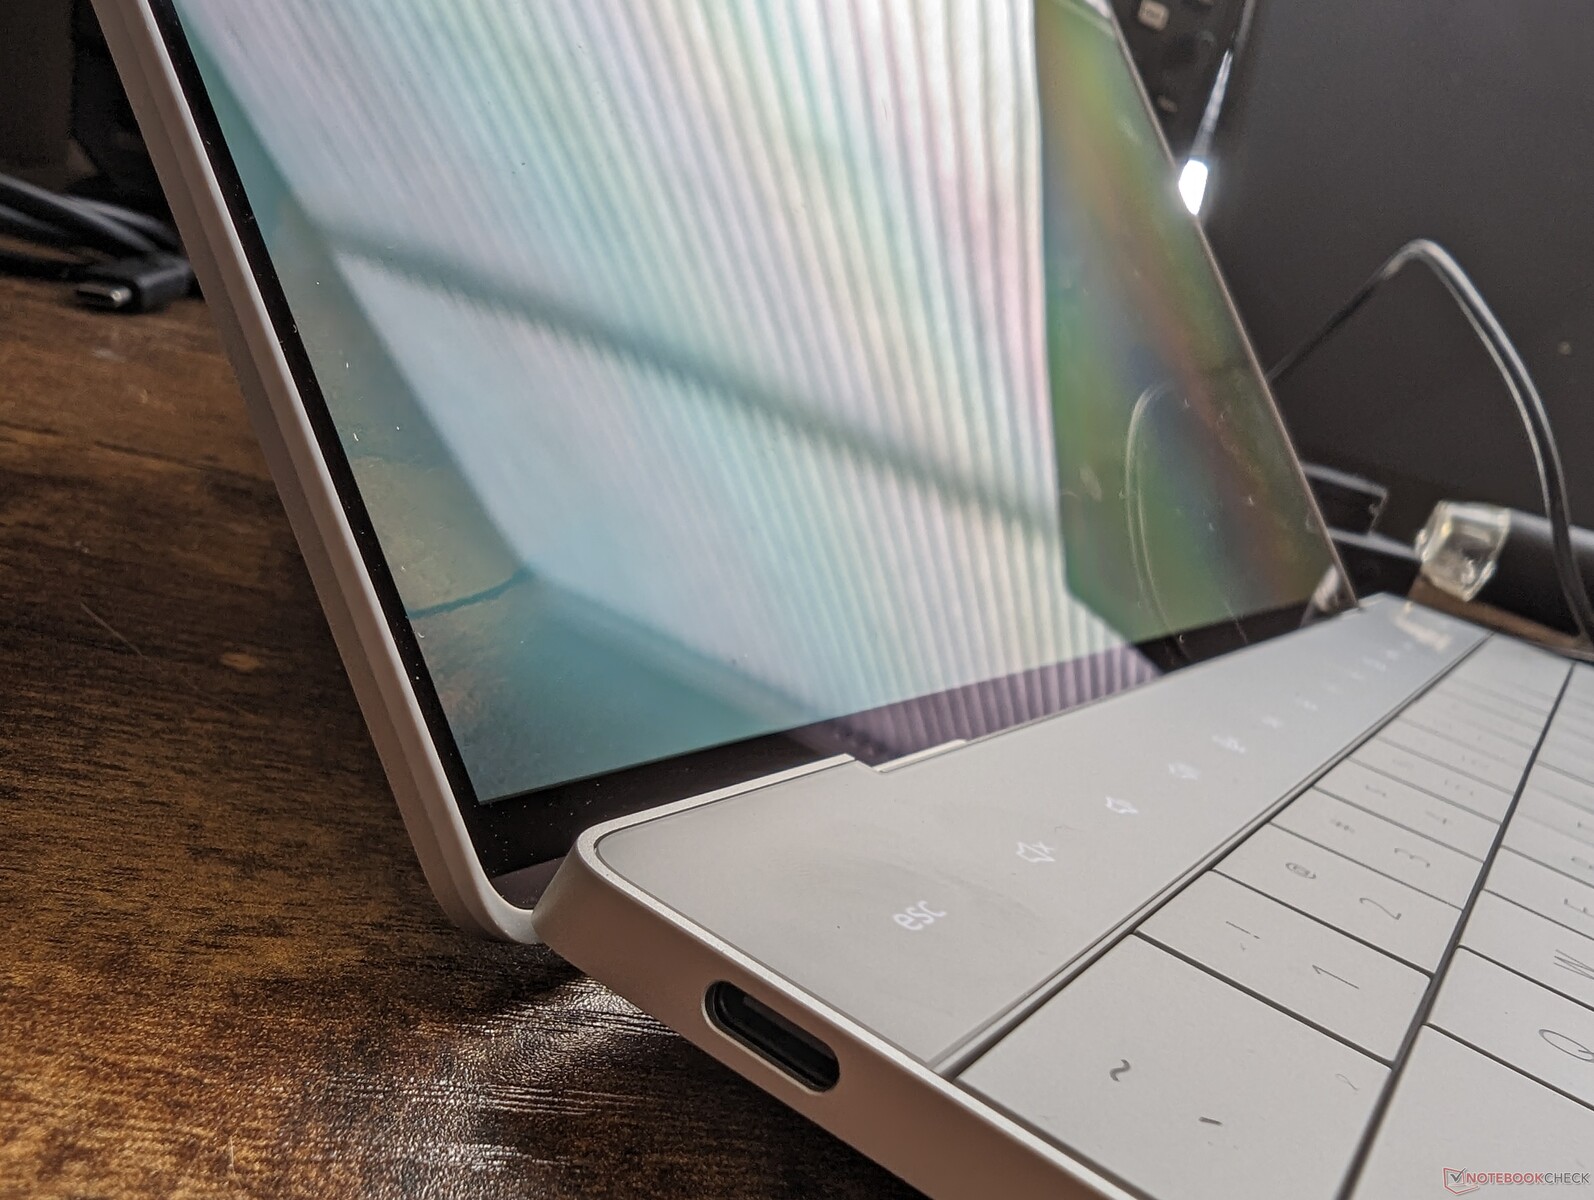
Для ноутбука доступны четыре дисплея:
- 1920 x 1200, 60 Гц, IPS, матовый, 500 нит
- 1920 x 1200, 60 Гц, IPS, сенсорный, матовый, 500 нит
- 3456 x 2160, 60 Гц, OLED, сенсорный, глянцевый, 400 нит
- 3840 x 2400, 60 Гц, IPS, сенсорный, глянцевый, 500 нит
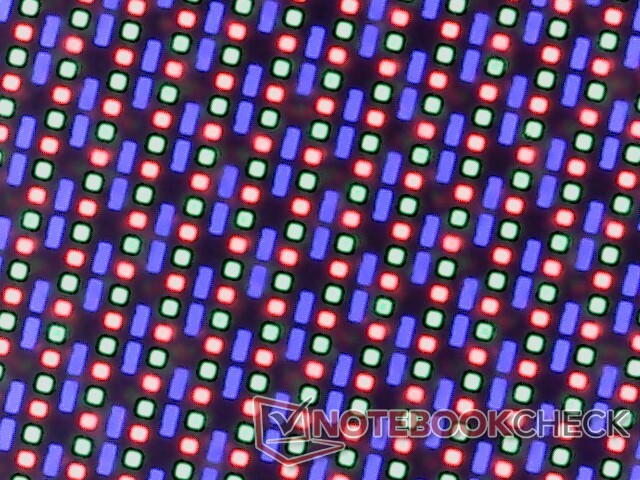
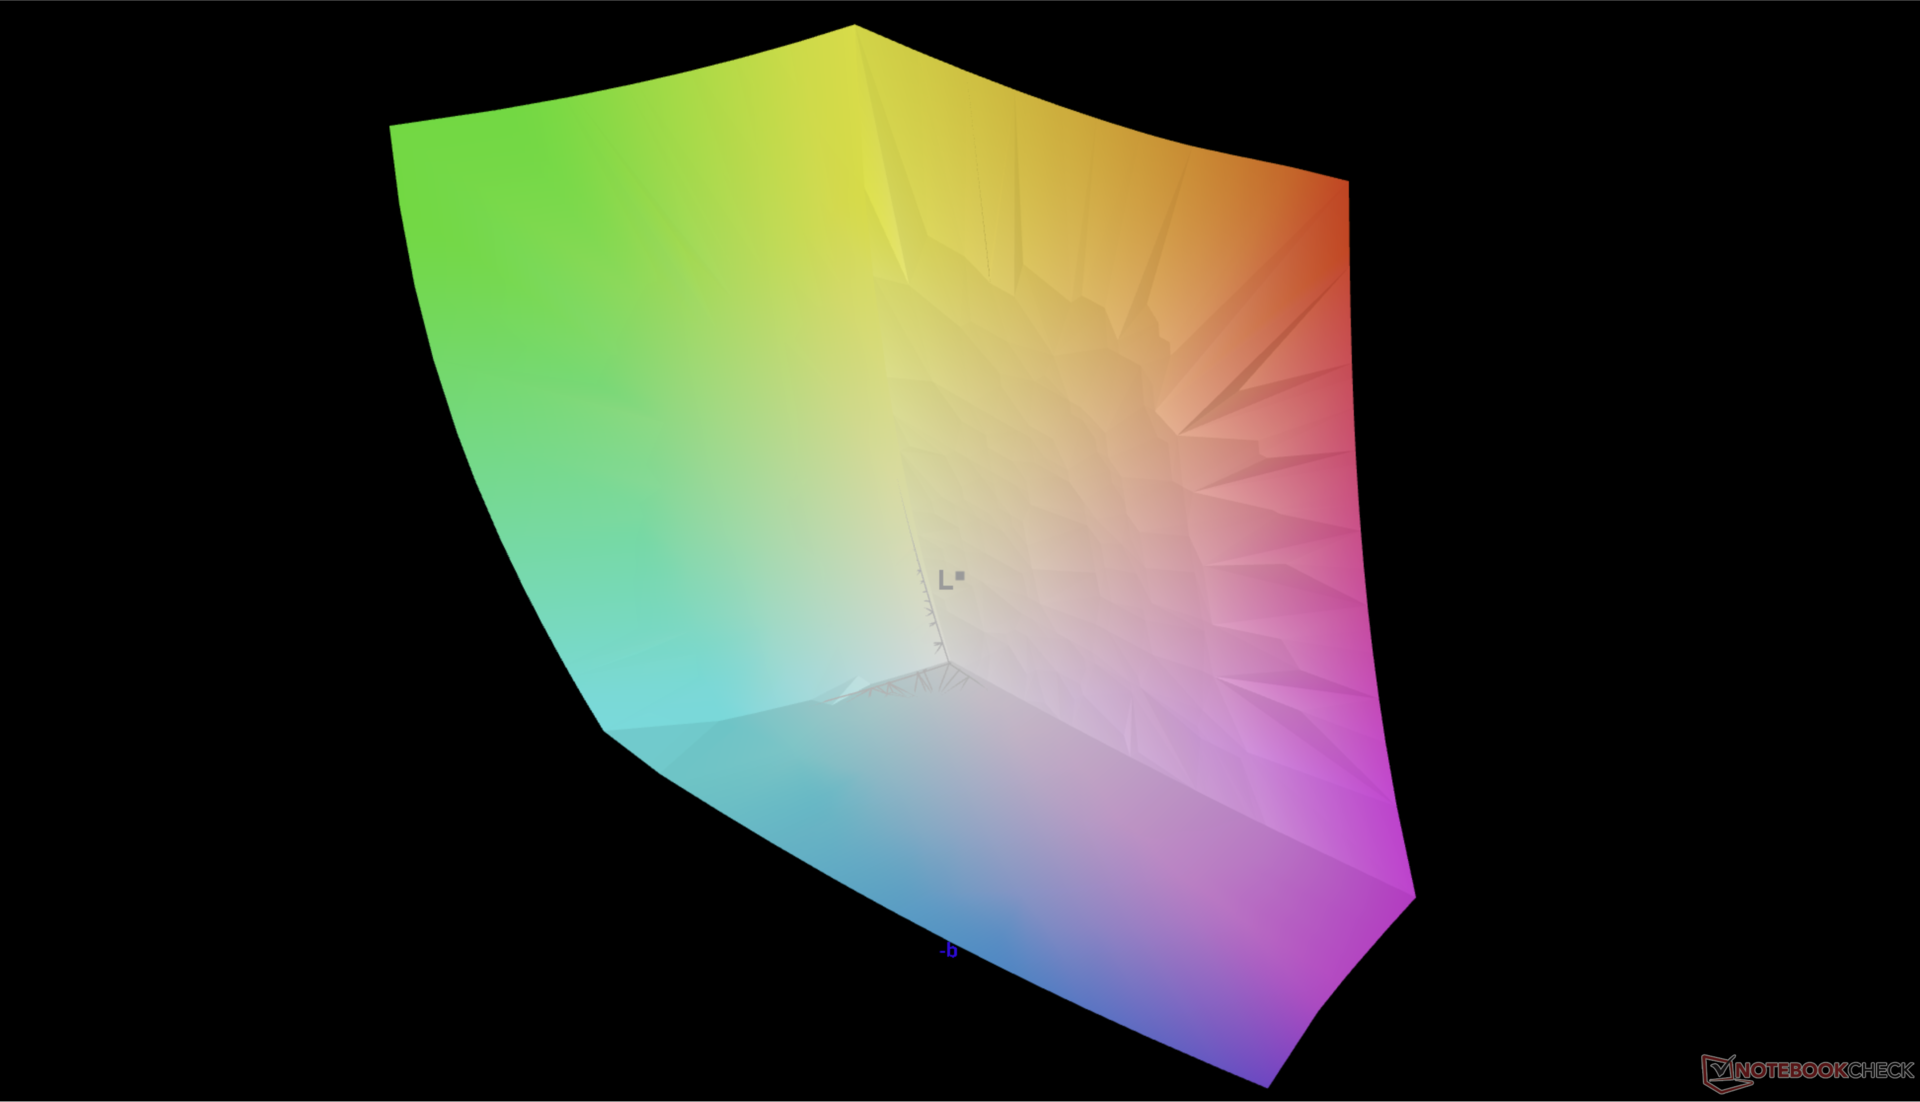
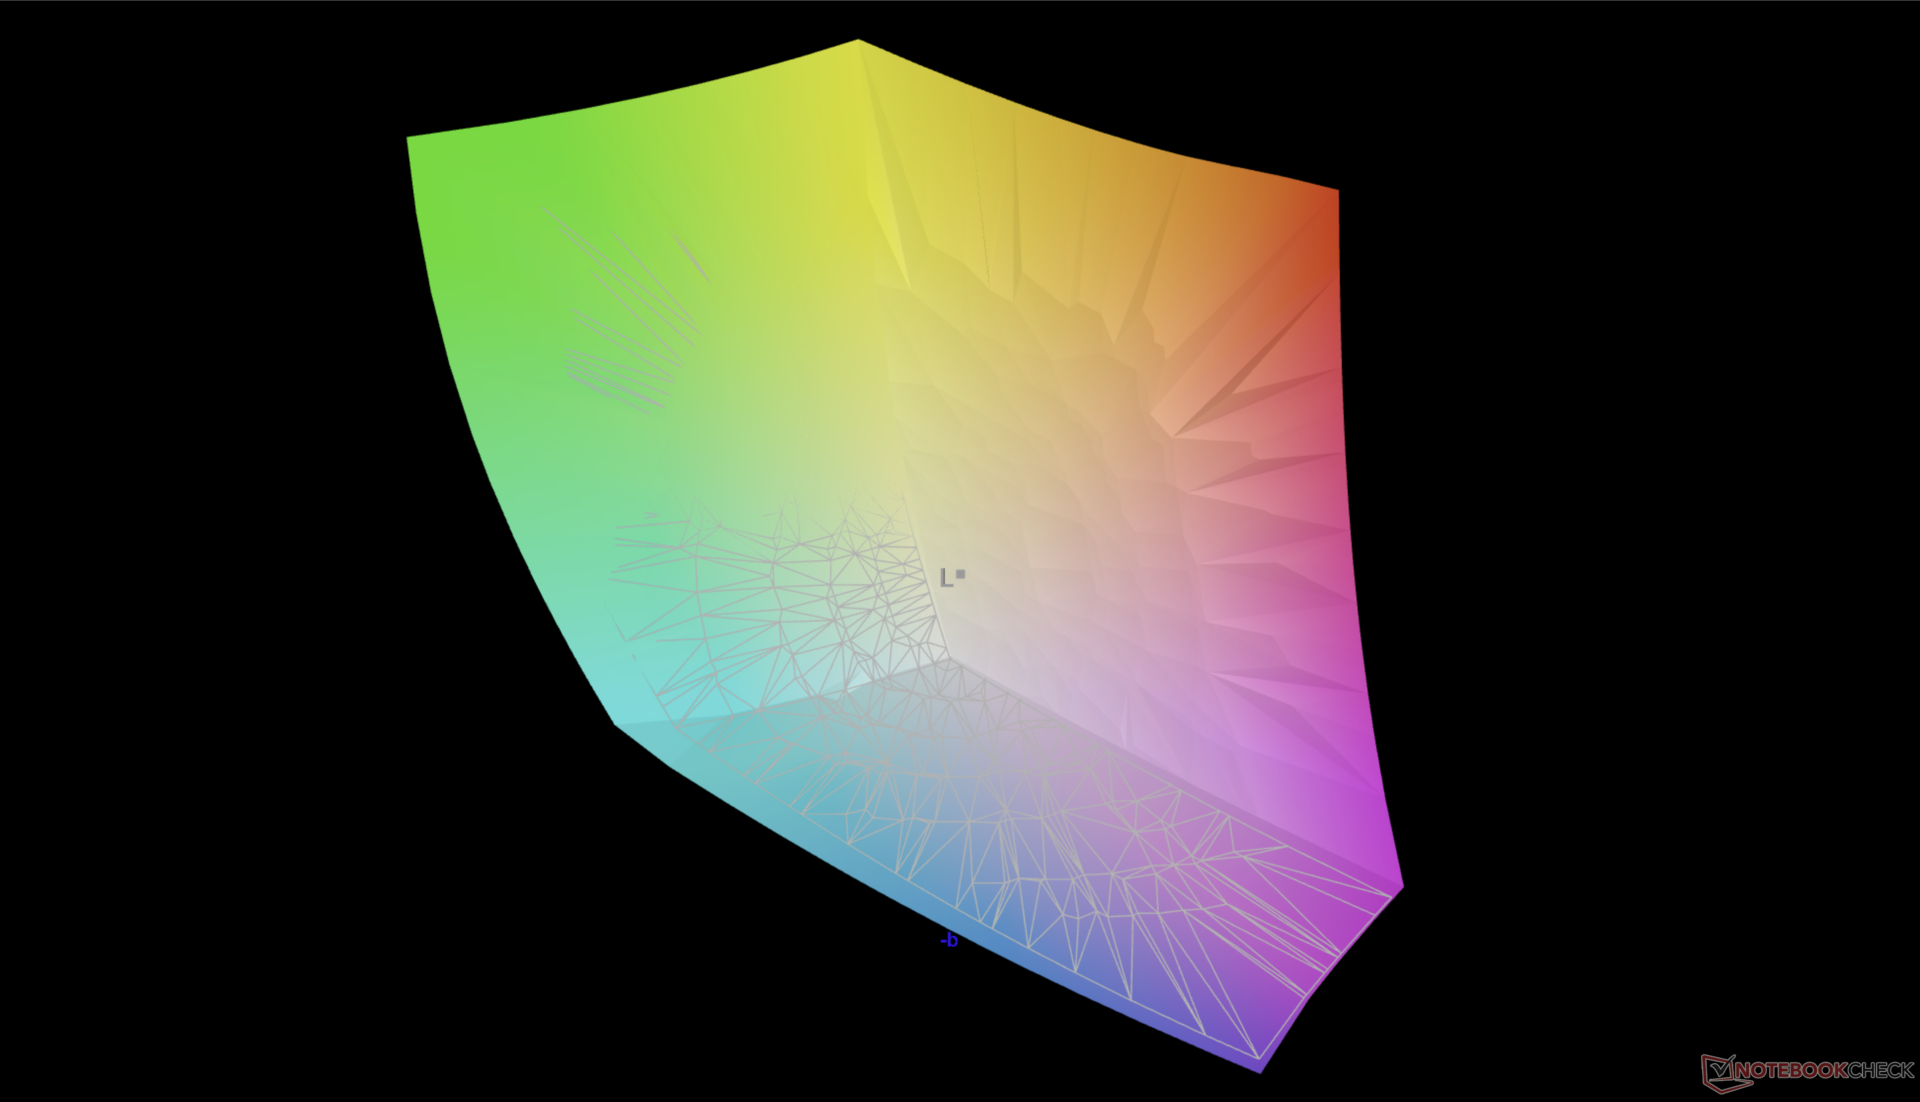
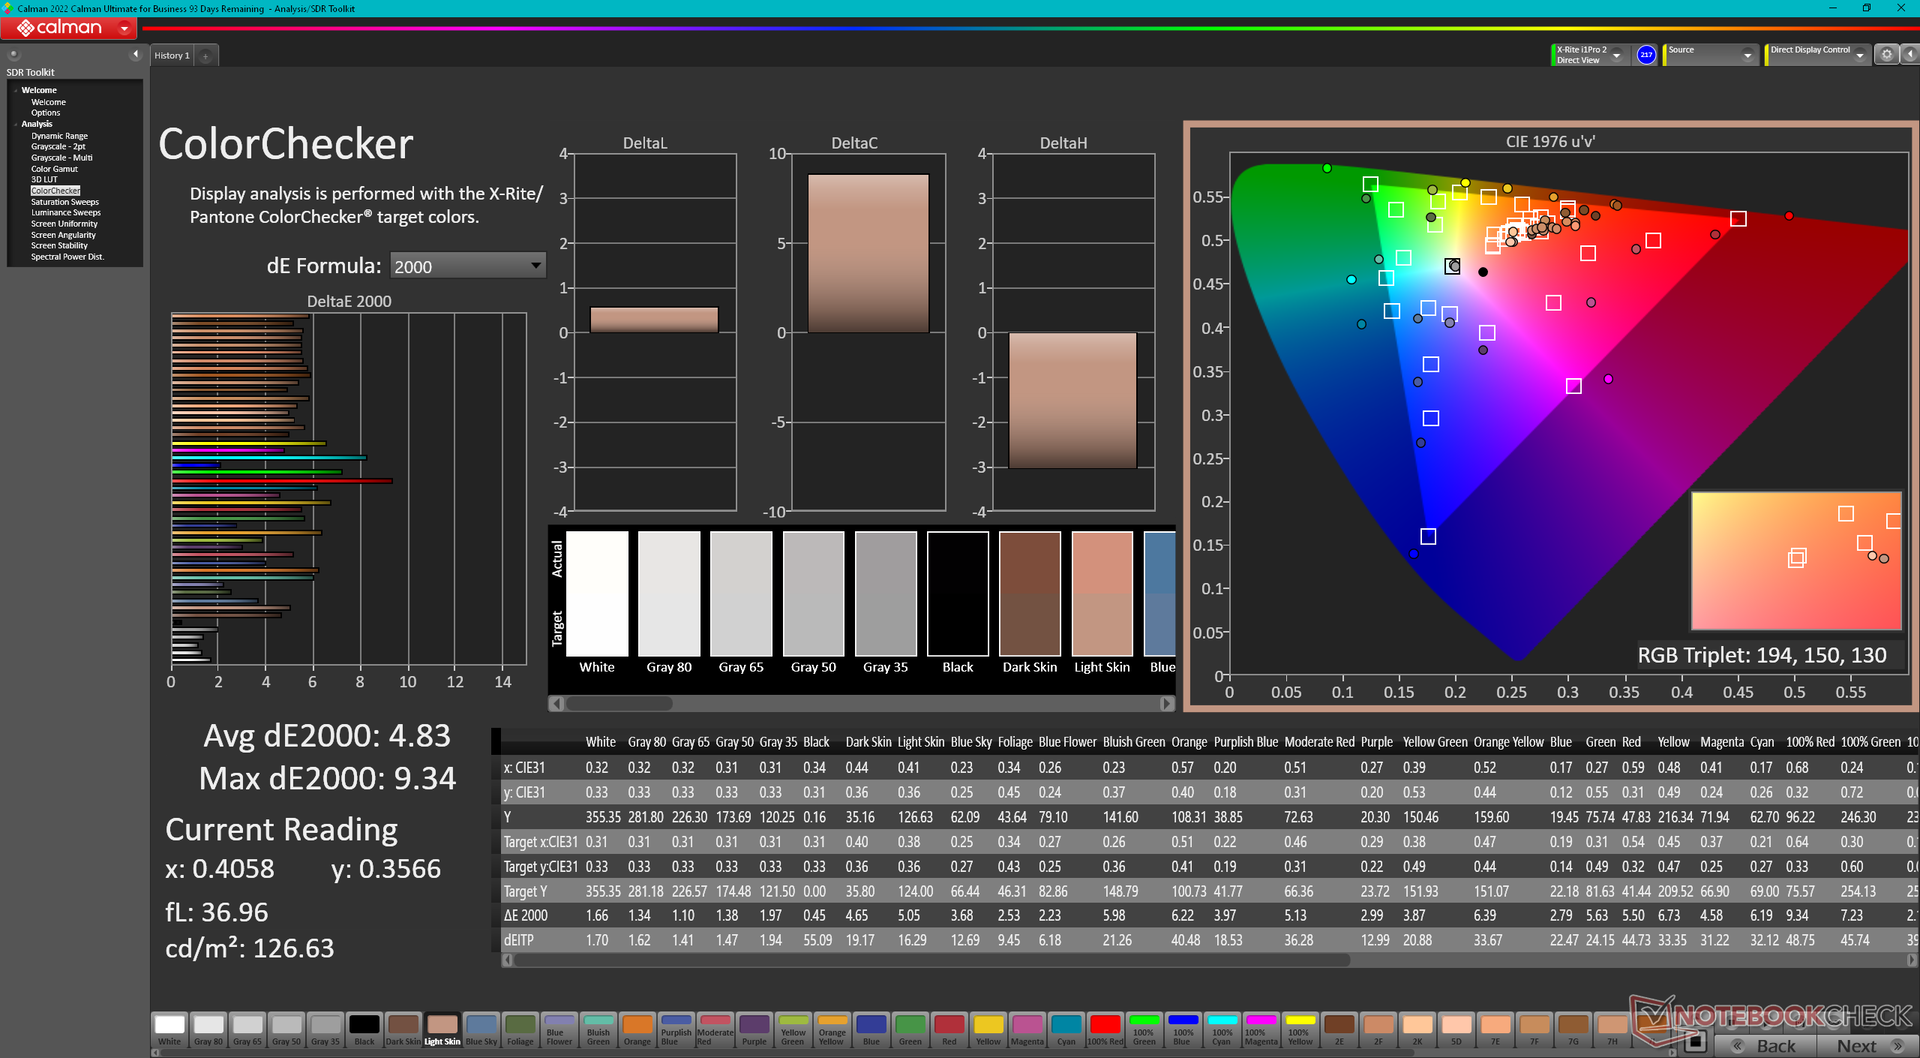
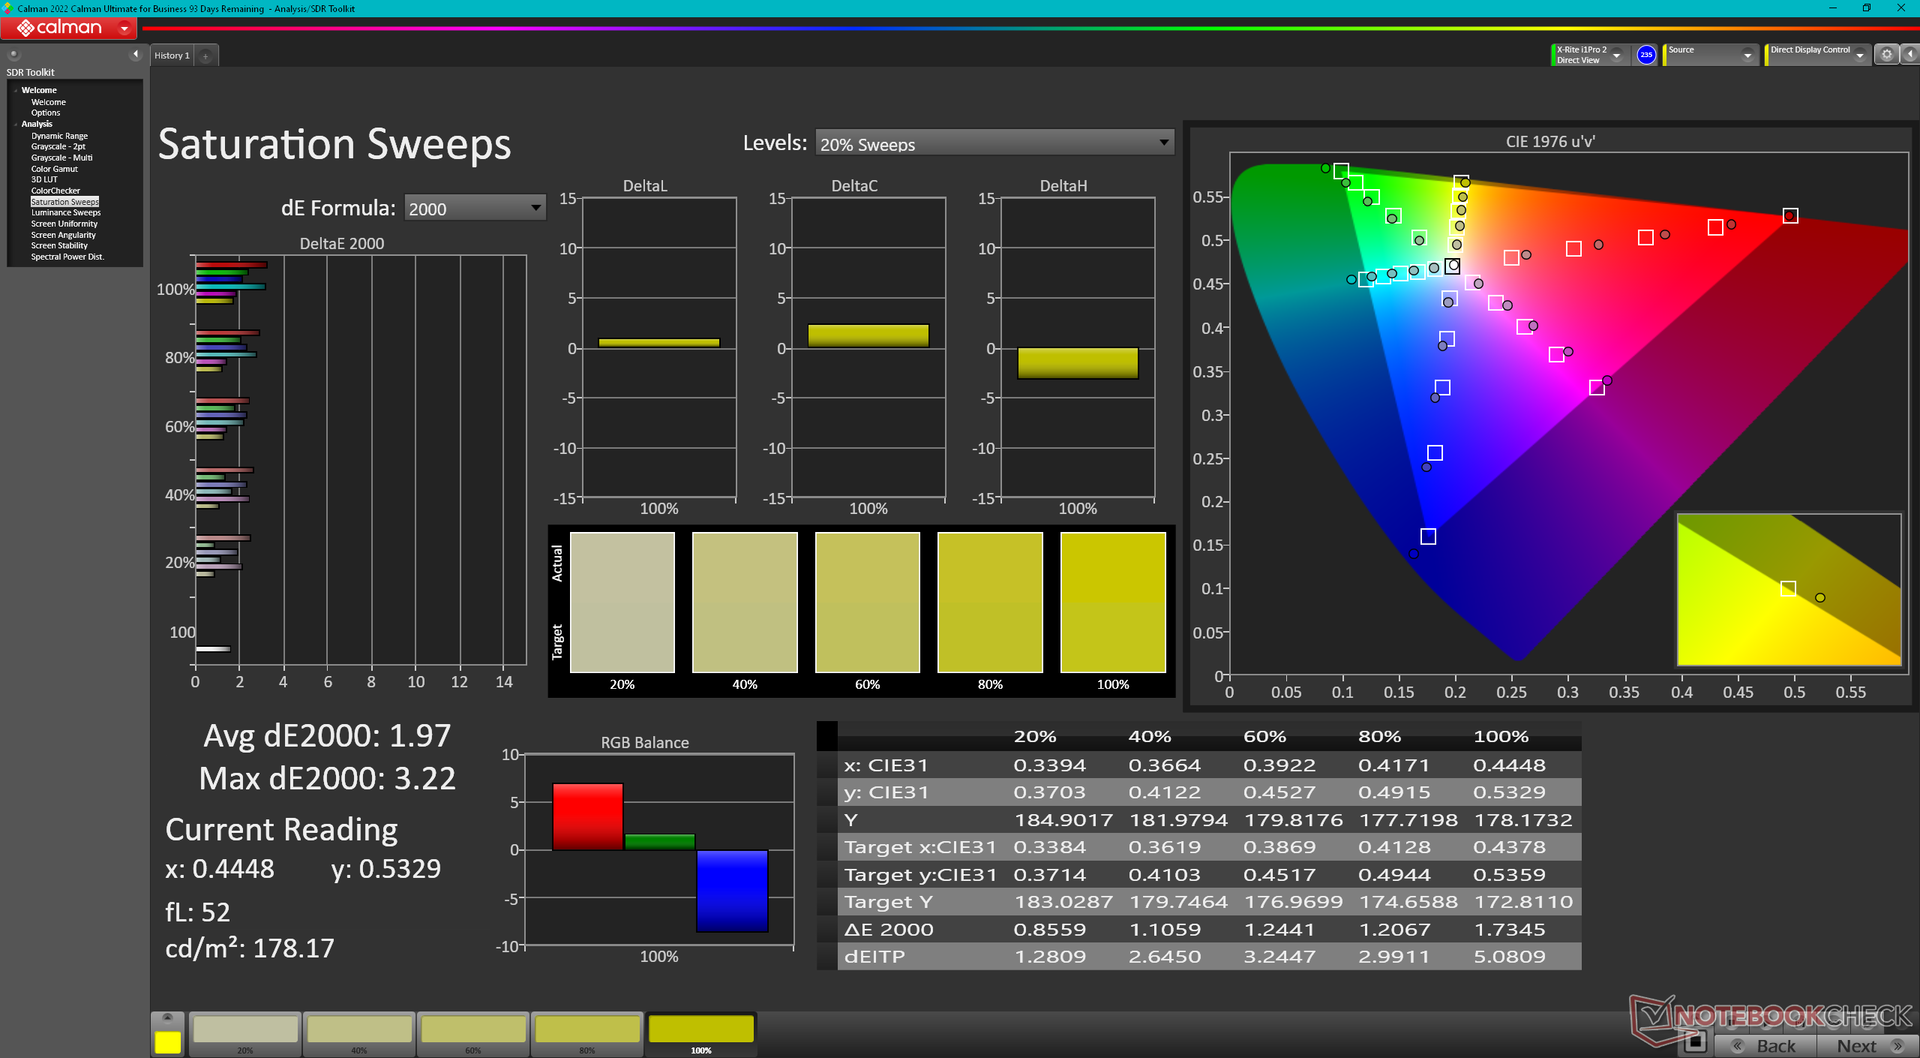
В нашей тестовой конфигурации установлен OLED экран Samsung 134XK04, который мы уже встречали у предшественника, потому и параметры изображения у него такие же. Любой из дисплеев в списке предлагает минимум 99.9% охват цветового пространства sRGB.

| |||||||||||||||||||||||||
Равномерность подсветки: 96 %
От батареи: 361.7 cd/m²
Контрастность: ∞:1 (Уровень чёрного: 0 cd/m²)
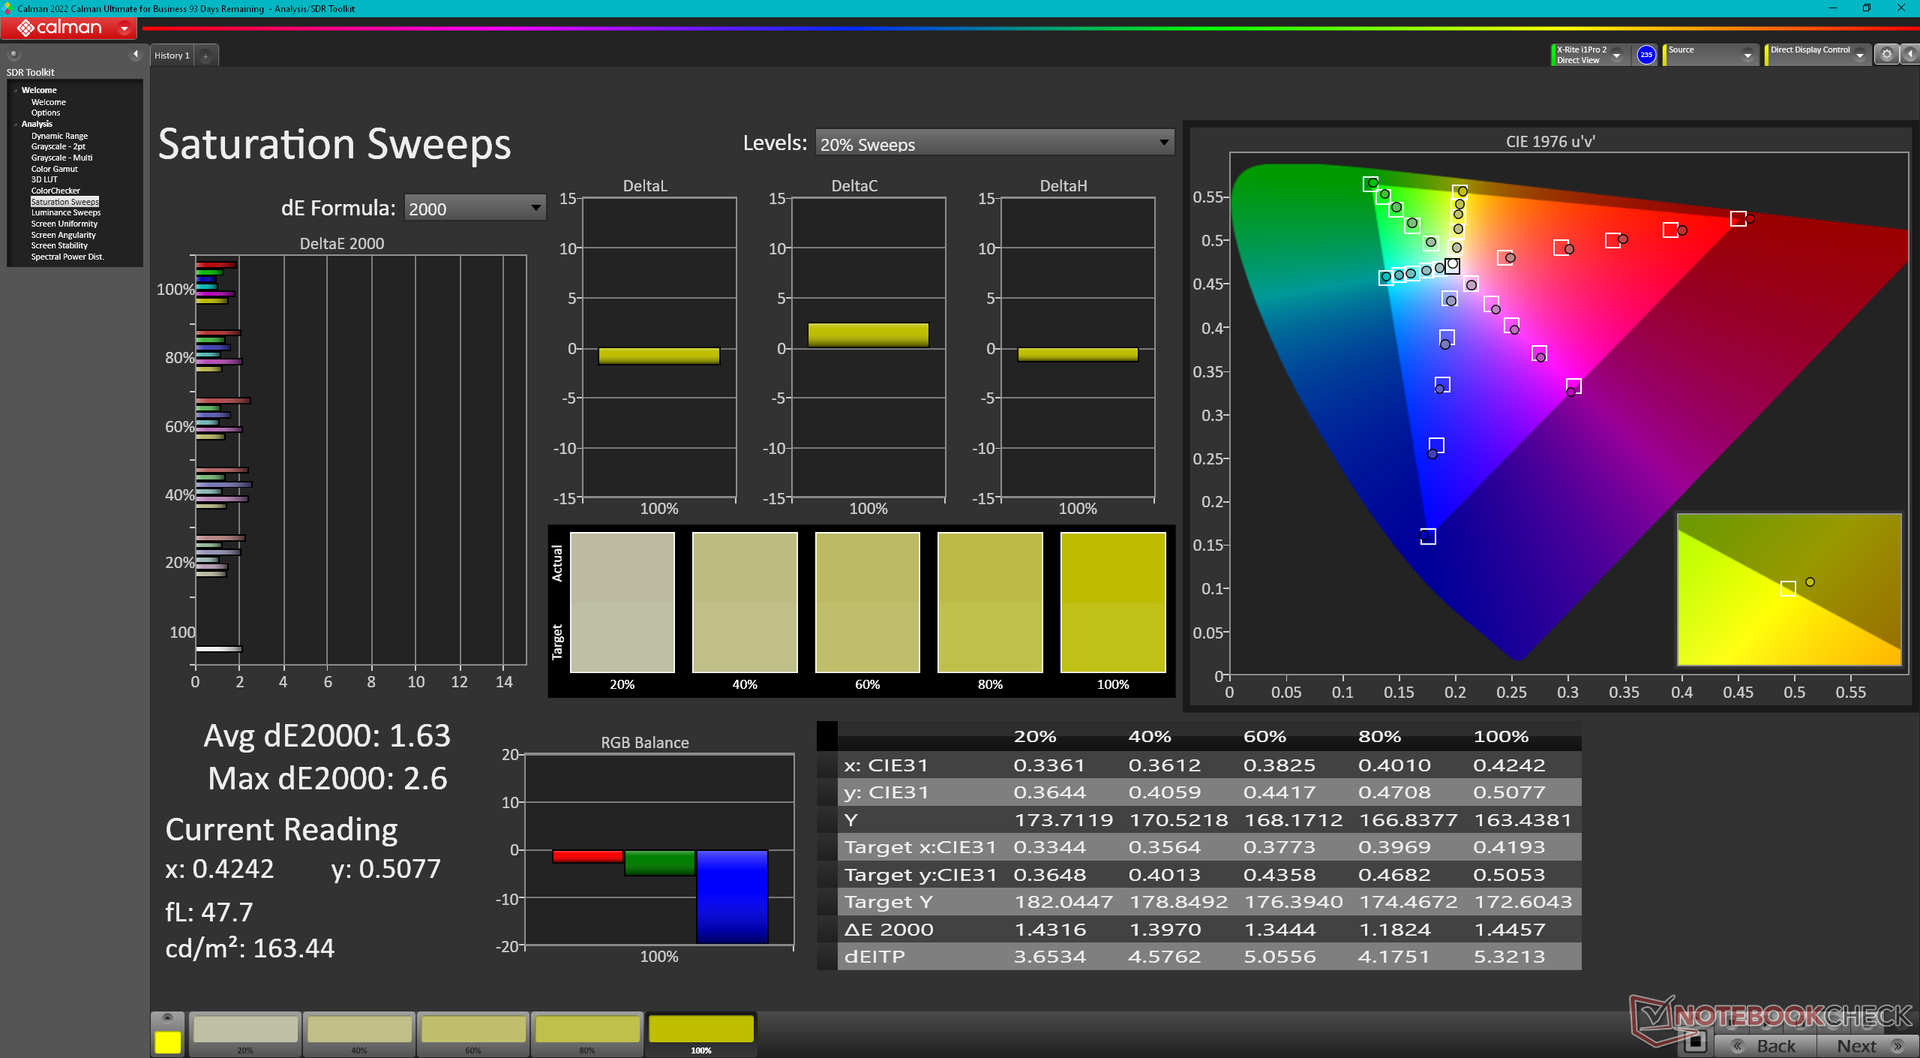
ΔE ColorChecker Calman: 4.83 | ∀{0.5-29.43 Ø4.73}
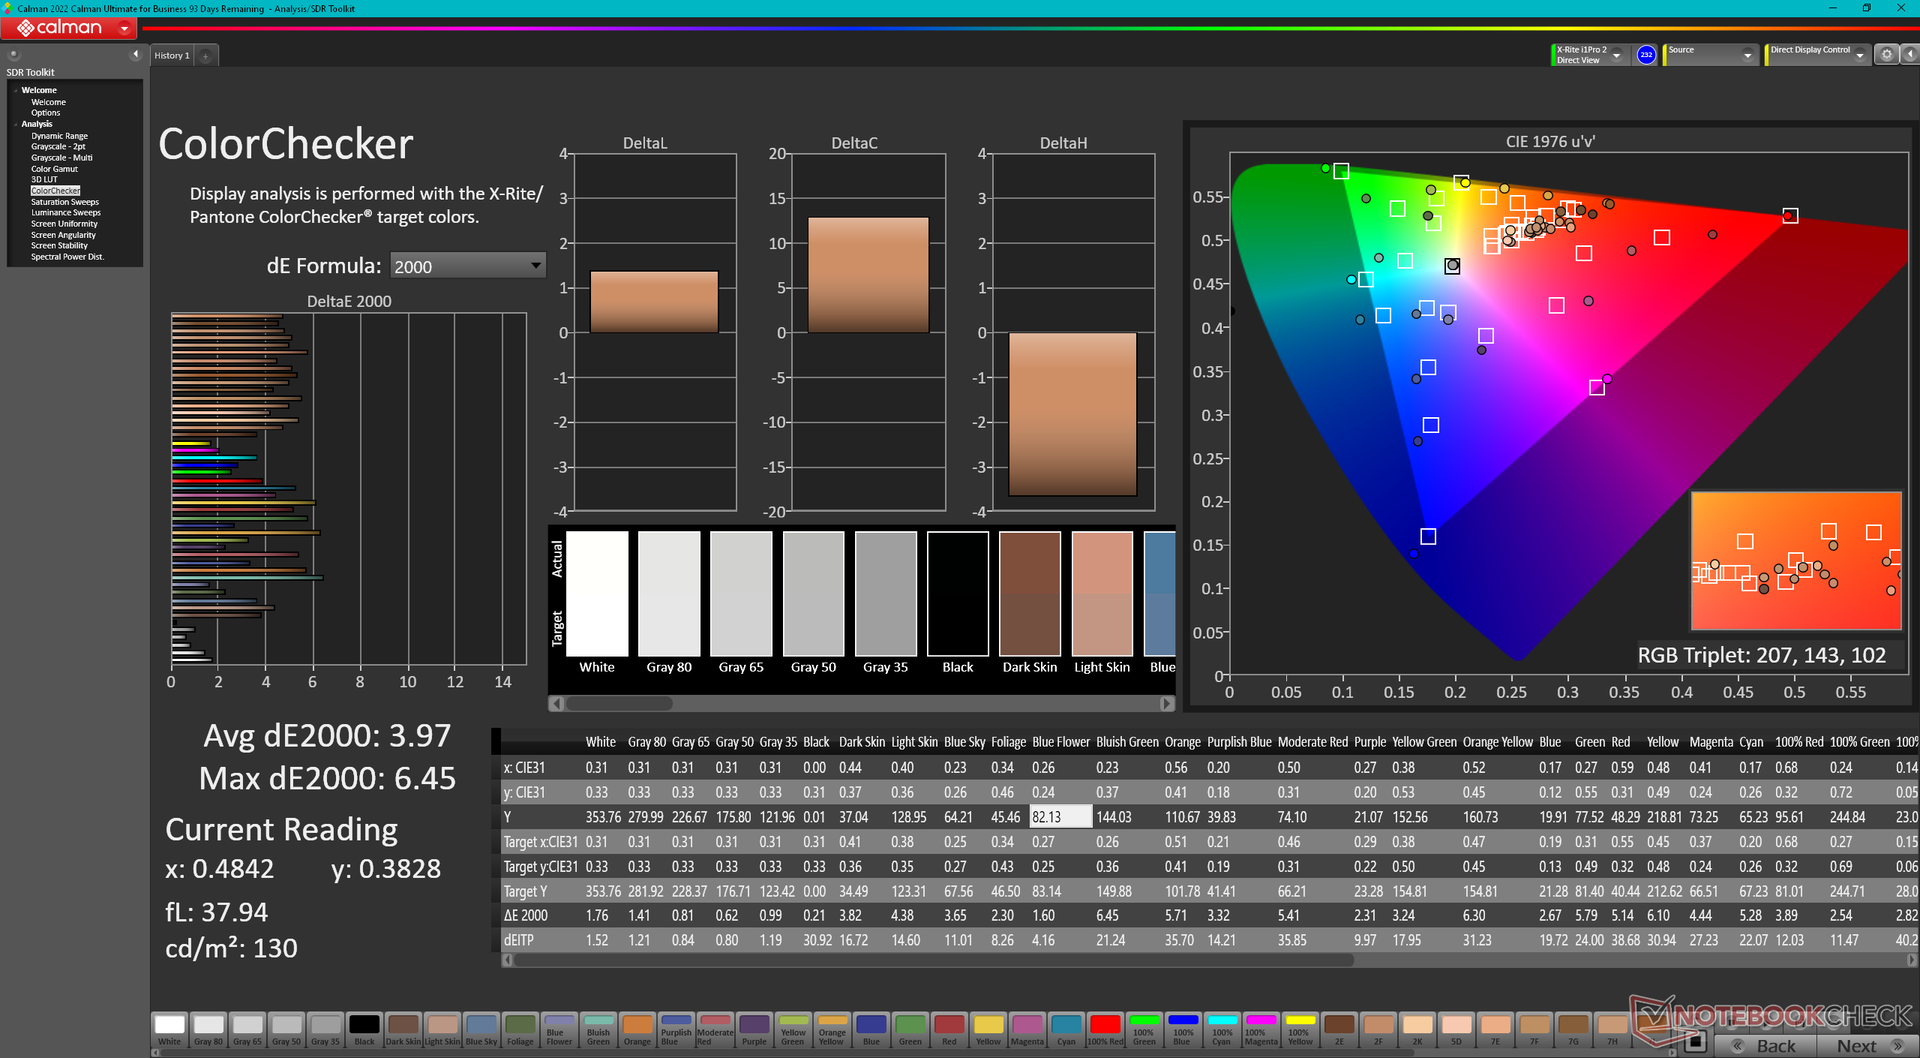
calibrated: 3.97
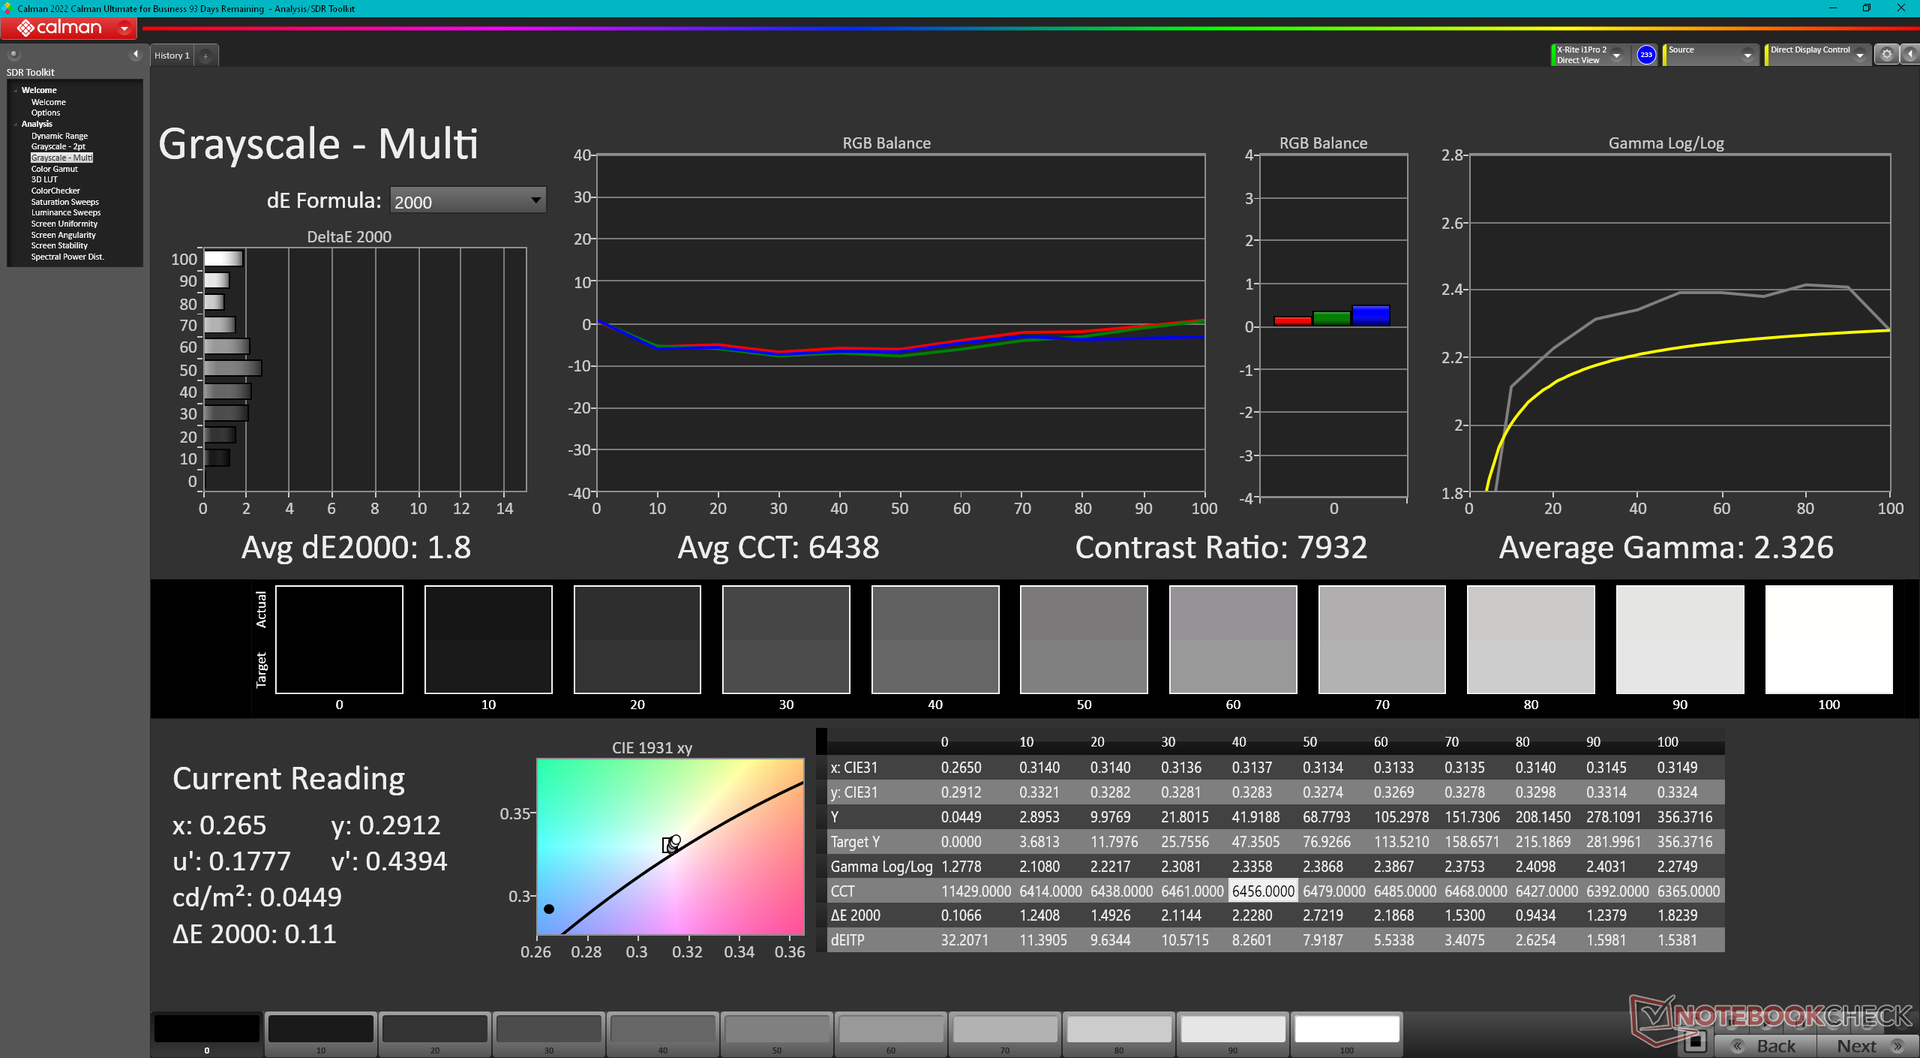
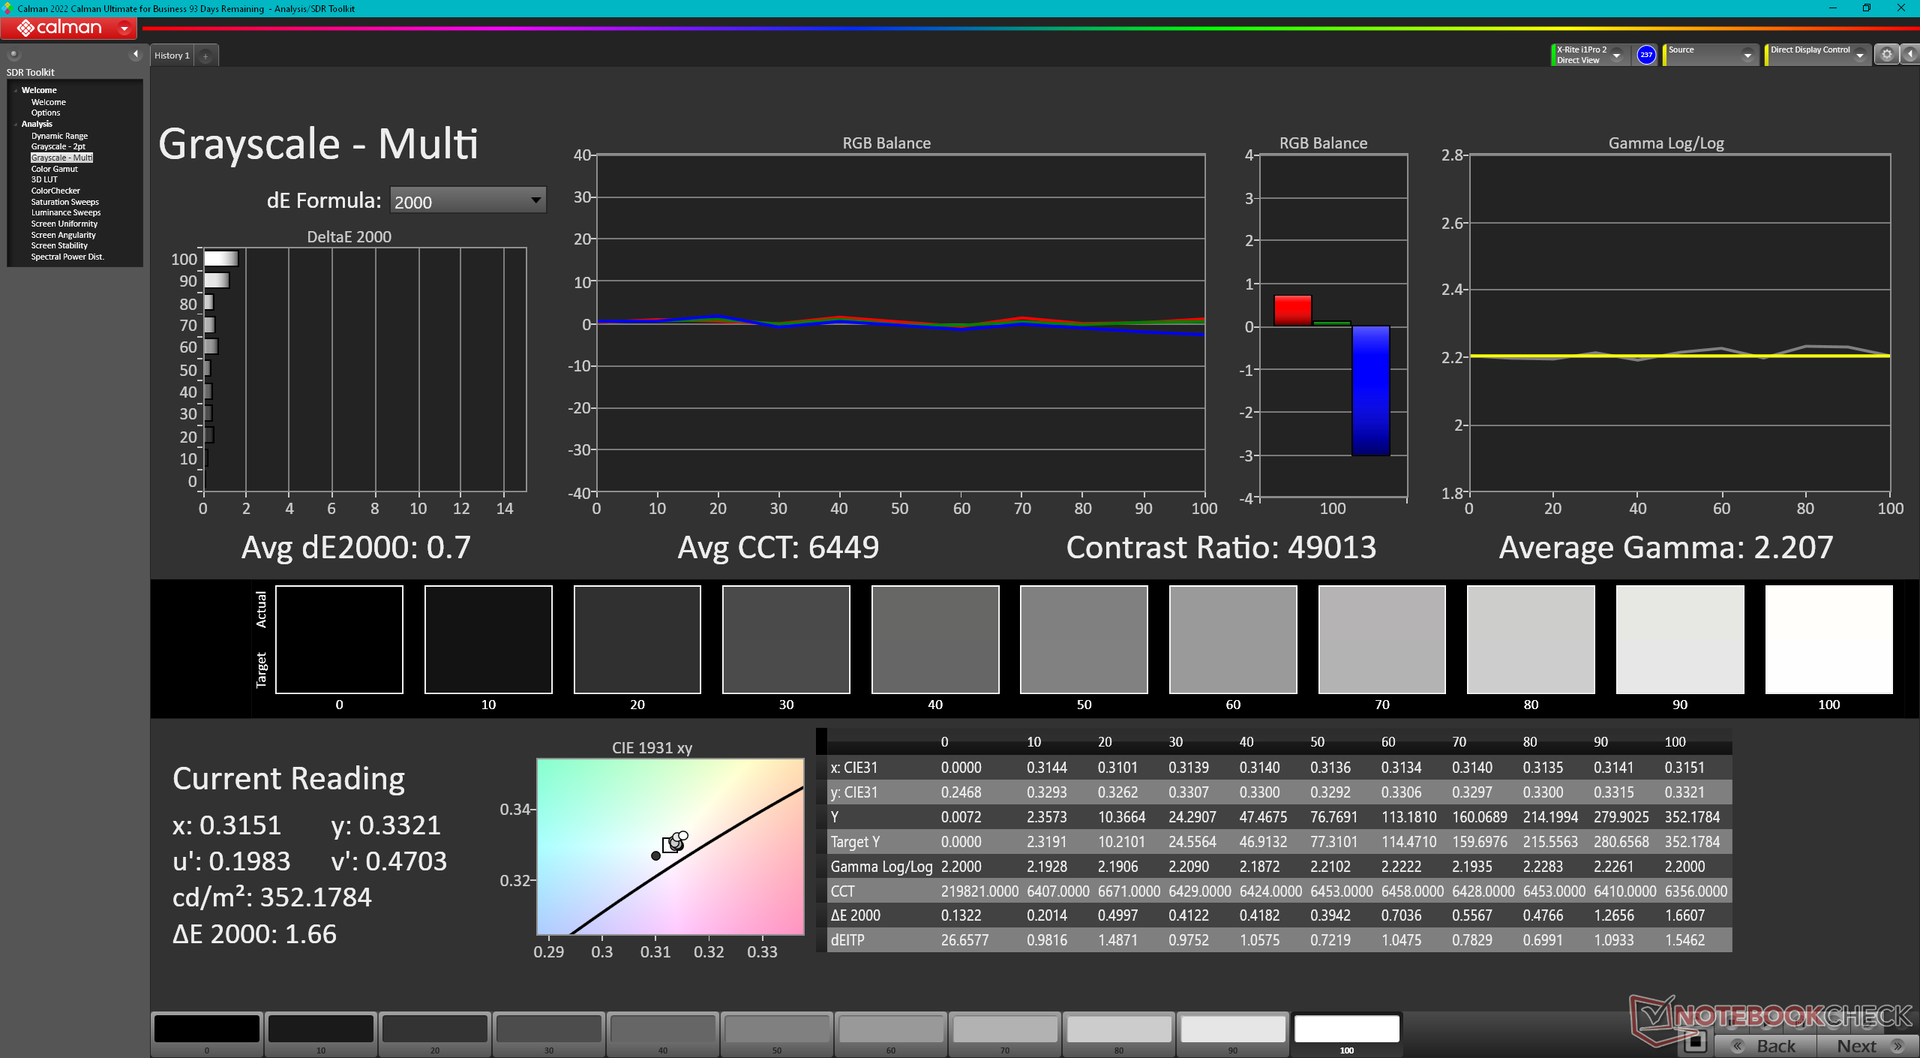
ΔE Greyscale Calman: 1.8 | ∀{0.09-98 Ø4.97}
96.8% AdobeRGB 1998 (Argyll 3D)
100% sRGB (Argyll 3D)
99.7% Display P3 (Argyll 3D)
Gamma: 2.33
CCT: 6438 K
| Dell XPS 13 Plus 9320 Core i7-1360P Samsung 134XK04, OLED, 3456x2160, 13.4" | Dell XPS 13 Plus 9320 i7-1280P OLED Samsung 134XK04, OLED, 3456x2160, 13.4" | Dell XPS 13 7390 Core i7-10710U AU Optronics B133ZAN, Dell P/N: 90NTH, IPS, 3840x2160, 13.3" | Framework Laptop 13.5 13th Gen Intel BOE CQ NE135FBM-N41, IPS, 2256x1504, 13.5" | Lenovo ThinkPad X13 Yoga G3 21AW003UGE LP133WQ1-SPF2, IPS LED, 2560x1600, 13.3" | HP Spectre x360 13.5 14t-ef000 SDC4160, OLED, 3000x2000, 13.5" | |
|---|---|---|---|---|---|---|
| Display | 1% | -25% | -20% | -20% | -2% | |
| Display P3 Coverage (%) | 99.7 | 99.5 0% | 63.4 -36% | 68.9 -31% | 68 -32% | 99.9 0% |
| sRGB Coverage (%) | 100 | 100 0% | 93.7 -6% | 97.5 -2% | 98.6 -1% | 100 0% |
| AdobeRGB 1998 Coverage (%) | 96.8 | 98.4 2% | 64.3 -34% | 71.1 -27% | 69.5 -28% | 90.8 -6% |
| Response Times | -10% | -1891% | -1965% | -1617% | 5% | |
| Response Time Grey 50% / Grey 80% * (ms) | 2.18 ? | 2.6 ? -19% | 51.6 ? -2267% | 54.9 ? -2418% | 45.9 ? -2006% | 1.9 ? 13% |
| Response Time Black / White * (ms) | 2.08 ? | 2.1 ? -1% | 33.6 ? -1515% | 33.5 ? -1511% | 27.6 ? -1227% | 2.16 ? -4% |
| PWM Frequency (Hz) | 238.6 ? | 59.5 | 60.2 ? | |||
| Параметры экрана | 14% | -39% | 2% | 23% | 9% | |
| Яркость в центре (cd/m²) | 361.7 | 371.8 3% | 408.2 13% | 503 39% | 438 21% | 351.7 -3% |
| Brightness (cd/m²) | 367 | 374 2% | 399 9% | 472 29% | 399 9% | 351 -4% |
| Brightness Distribution (%) | 96 | 98 2% | 89 -7% | 87 -9% | 84 -12% | 87 -9% |
| Уровень чёрного * (cd/m²) | 0.39 | 0.36 | 0.29 | |||
| Colorchecker Delta E * | 4.83 | 2.37 51% | 4.6 5% | 3.38 30% | 1.8 63% | 1.78 63% |
| Colorchecker dE 2000 max. * | 9.34 | 6.1 35% | 11.84 -27% | 7.08 24% | 4 57% | 6.14 34% |
| Colorchecker dE 2000 calibrated * | 3.97 | 2.03 49% | 1.21 70% | 0.8 80% | ||
| Delta E для серого * | 1.8 | 2 -11% | 7.5 -317% | 4.8 -167% | 2.8 -56% | 2.3 -28% |
| Гамма | 2.33 94% | 2.29 96% | 2.12 104% | 2.13 103% | 2.24 98% | 2.11 104% |
| CCT | 6438 101% | 6261 104% | 7966 82% | 6235 104% | 6785 96% | 6683 97% |
| Контрастность (:1) | 1047 | 1397 | 1510 | |||
| Покрытие спектра AdobeRGB, % (%) | 59.5 | |||||
| Color Space (Percent of sRGB) (%) | 93.5 | |||||
| Среднее значение | 2% /
6% | -652% /
-344% | -661% /
-331% | -538% /
-261% | 4% /
5% |
* ... меньше = лучше
Дисплей: тест на время отклика
| ↔ Перемена цвета пикселей, чёрный - белый (1) и белый - чёрный (2) | ||
|---|---|---|
| 2.08 ms ... стадия 1 ↗ и стадия 2 ↘ в сумме | ↗ 0.98 ms стадия 1 | 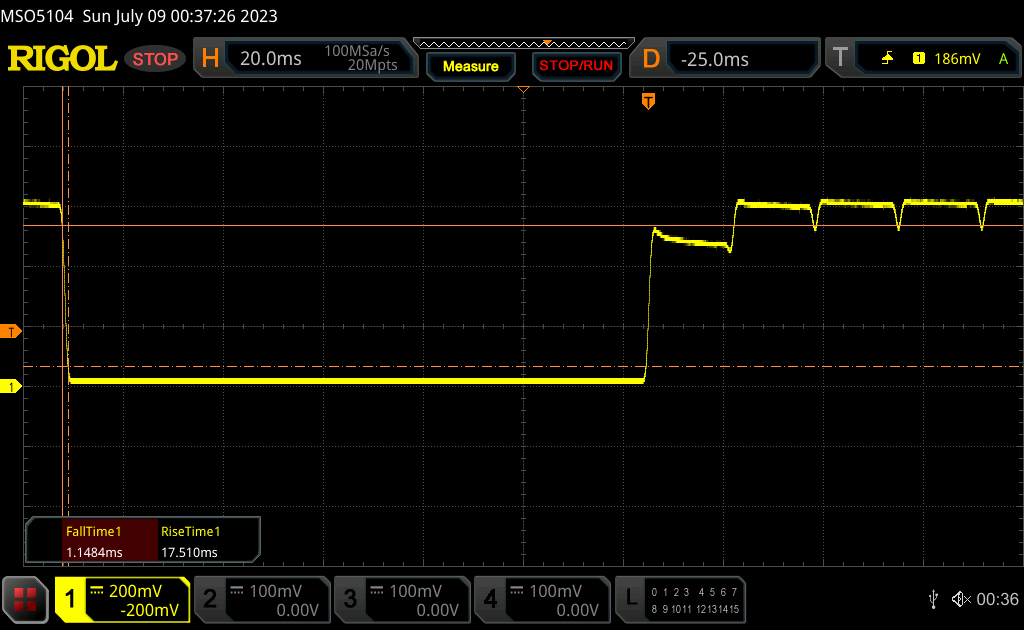 |
| ↘ 1.1 ms стадия 2 | ||
| Это отличное время отклика! Экран идеально подходит для игр и подобных применений. Для сравнения, самый лучший результат среди всех известных нам устройств равен 0.1 миллисек., самый худший - 240 миллисек. » 12% экранов из нашей базы данных показали более хороший результат. Таким образом, тестируемое устройство находится в верхней половине рейтинга (оно опережает средний результат, равный 19.9 миллисек.) | ||
| ↔ Перемена цвета пикселей, серый 50% - серый 80% (1) и серый 80% - серый 50% (2) | ||
| 2.18 ms ... стадия 1 ↗ и стадия 2 ↘ в сумме | ↗ 1.2 ms стадия 1 | 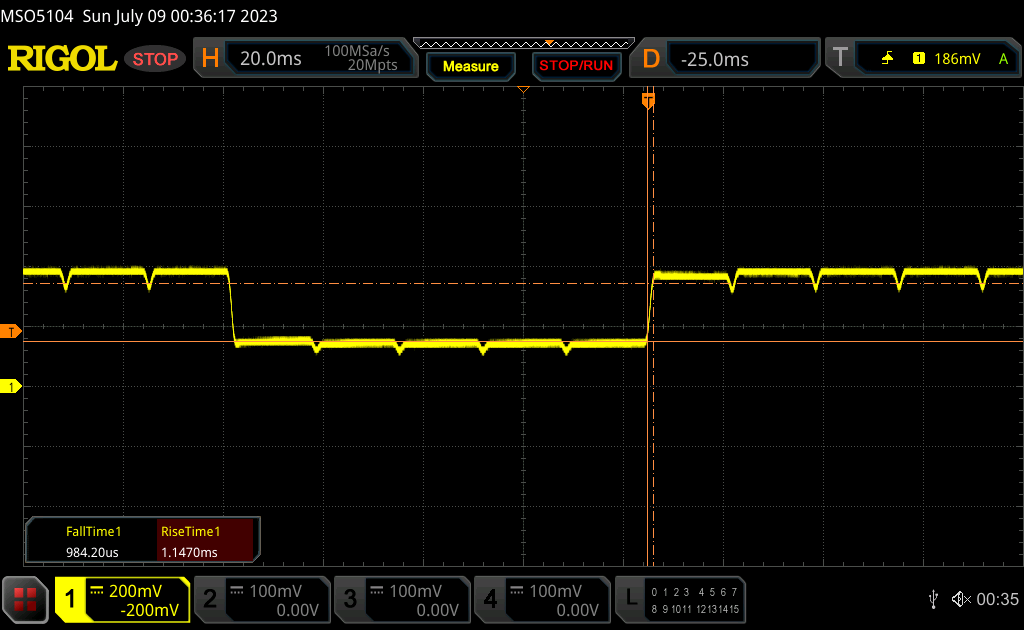 |
| ↘ 0.98 ms стадия 2 | ||
| Это отличное время отклика! Экран идеально подходит для игр и подобных применений. Для сравнения, самый лучший результат среди всех известных нам устройств равен 0.165 миллисек., самый худший - 636 миллисек. » 11% экранов из нашей базы данных показали более хороший результат. Таким образом, тестируемое устройство находится в верхней половине рейтинга (оно опережает средний результат, равный 31.1 миллисек.) | ||
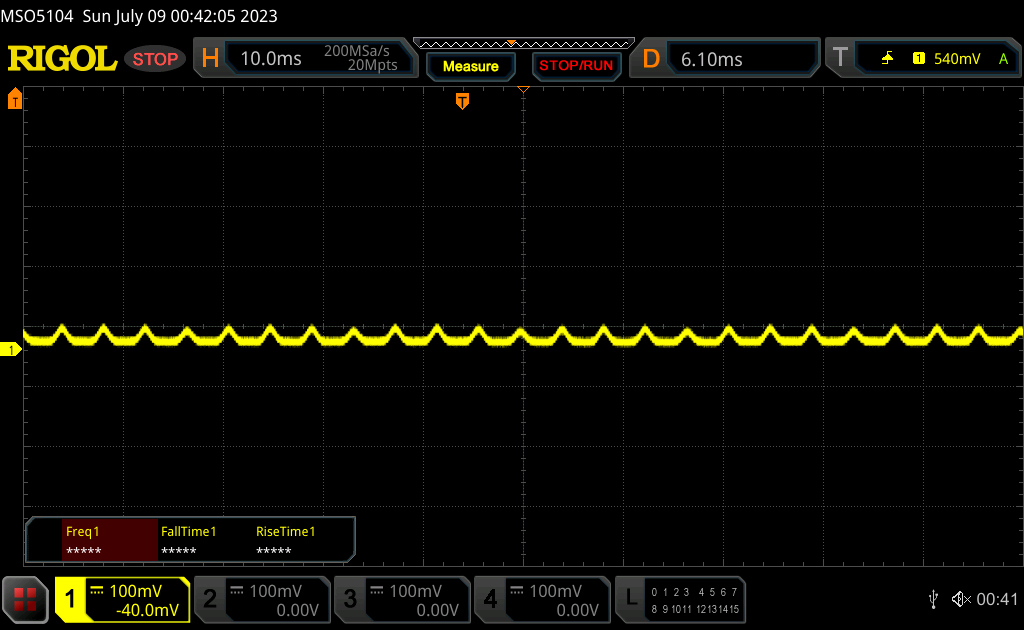
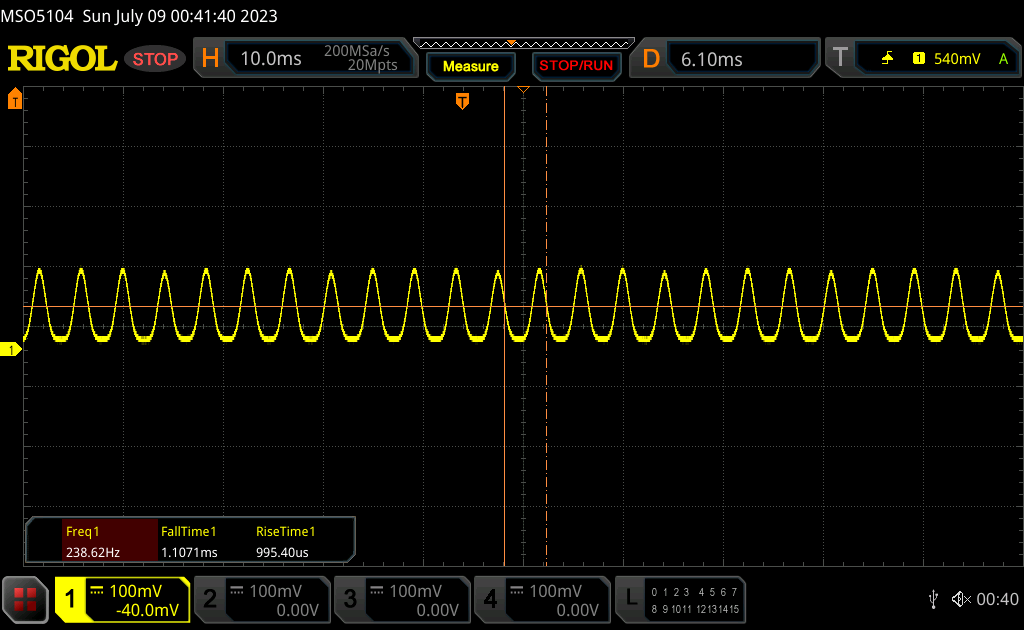
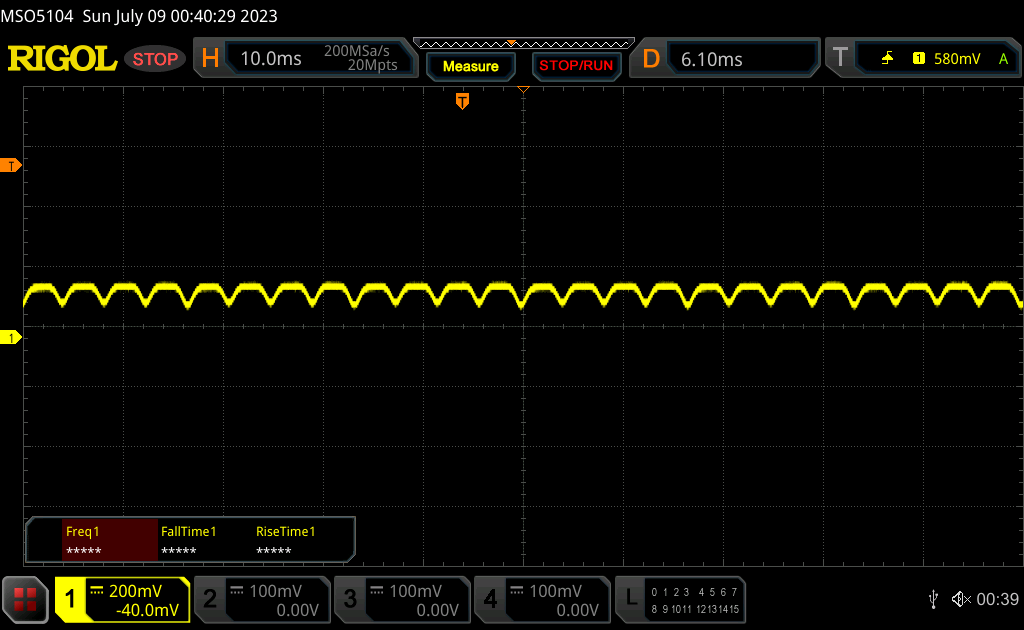
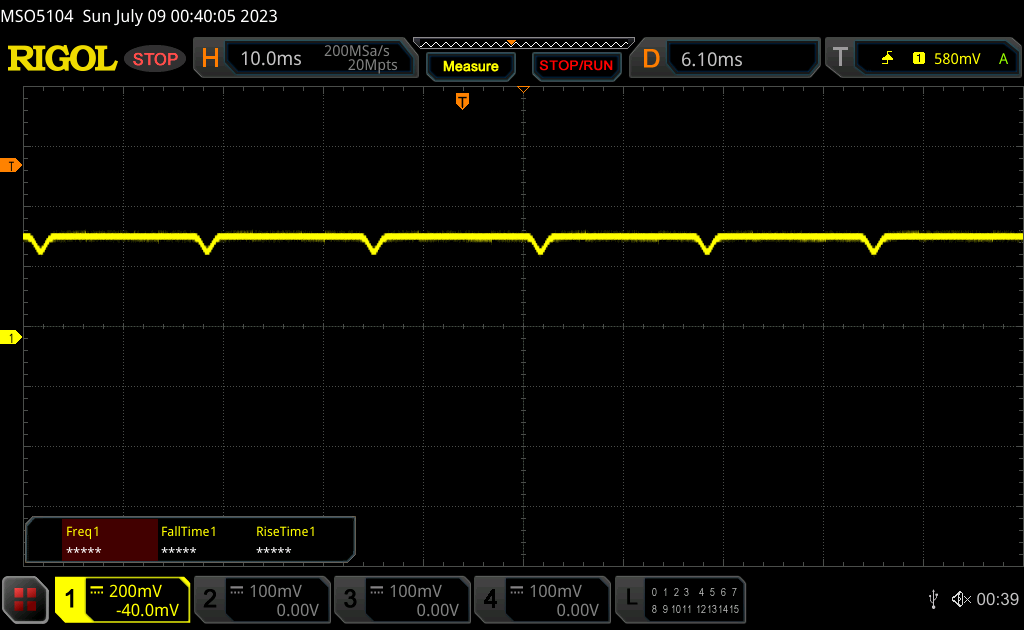
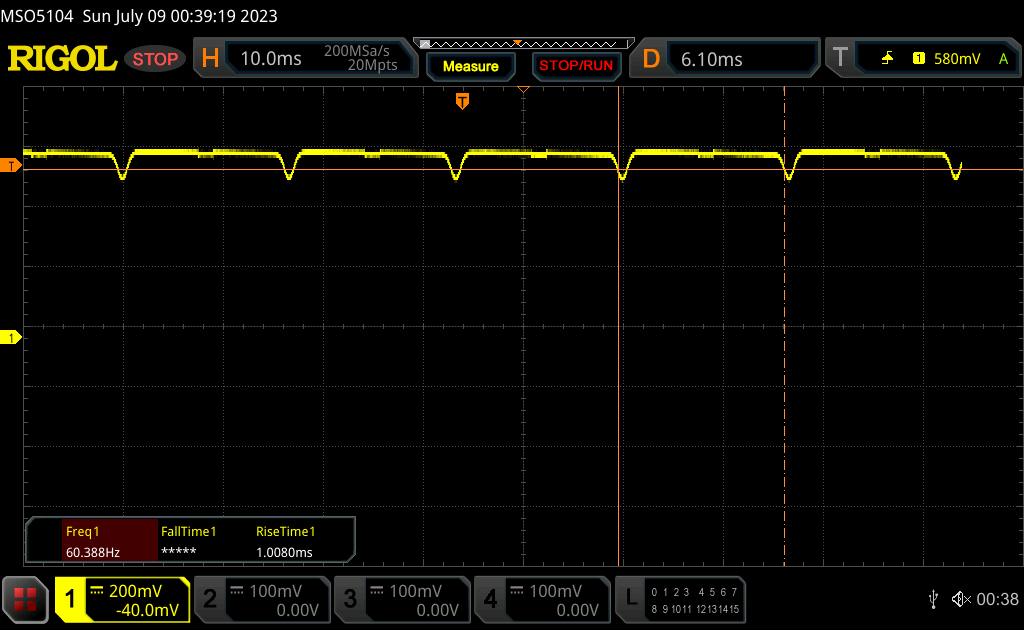
Тест на мерцание
| Модуляция на частоте | 238.6 Hz | ≤ 100 % яркости |  |
Подсветка дисплея мигает с частотой 238.6 Гц (худший случай, например, при использовании ШИМ) Этот эффект присутствует при яркости 100 % и ниже. Стоит заметить, что частота 238.6 Гц относительно мала. Поэтому мерцание экрана может иметь некоторое негативное влияние на самочувствие, особенно при длительном использовании устройства. Для сравнения, 52 % известных нам устройств не применяют PWM для изменения яркости, а среди тех, где PWM используется, типичная частота модуляции составляет 7798 Гц (мин. 5 Гц, макс. 343500 Гц). | |||
Пульсации ШИМ присутствуют почти на всех уровнях яркости экрана. Частота составляет 238.6 Гц на яркости от 0% до 52% и 60 Гц от 53% и выше. У доступных для модели IPS дисплеев ШИМ не используется.
Производительность
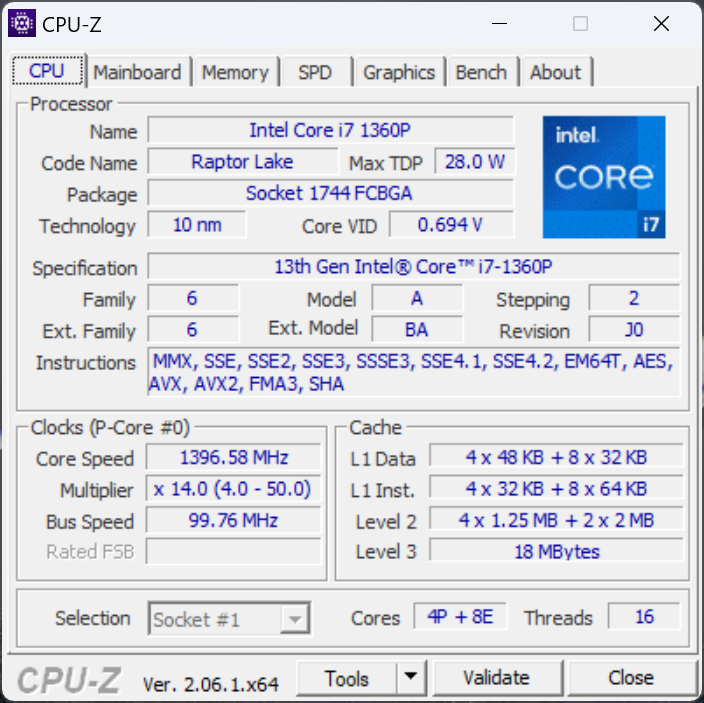
Параметры тестирования
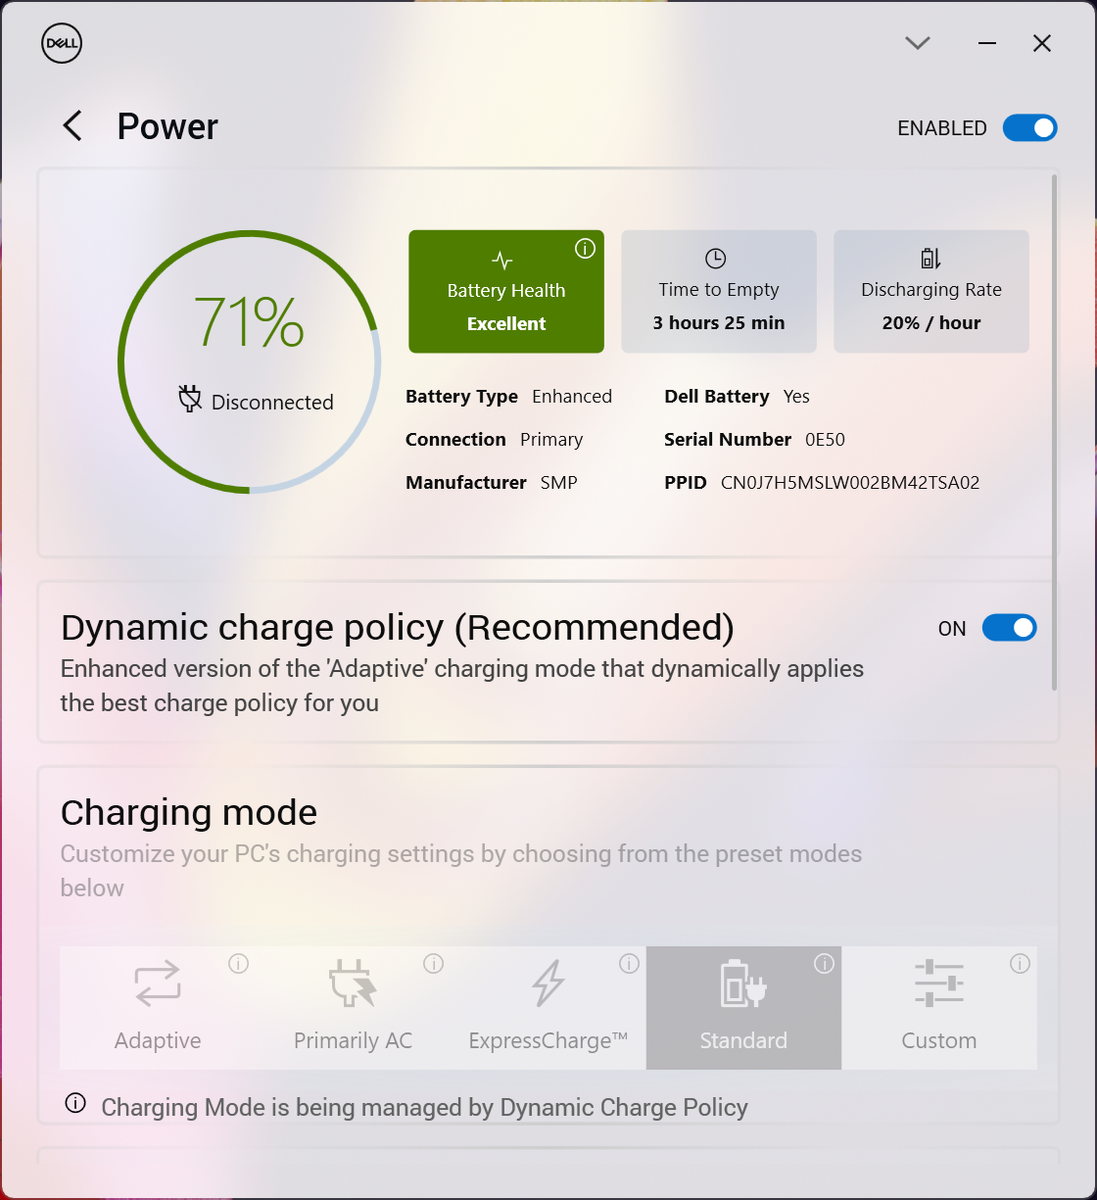
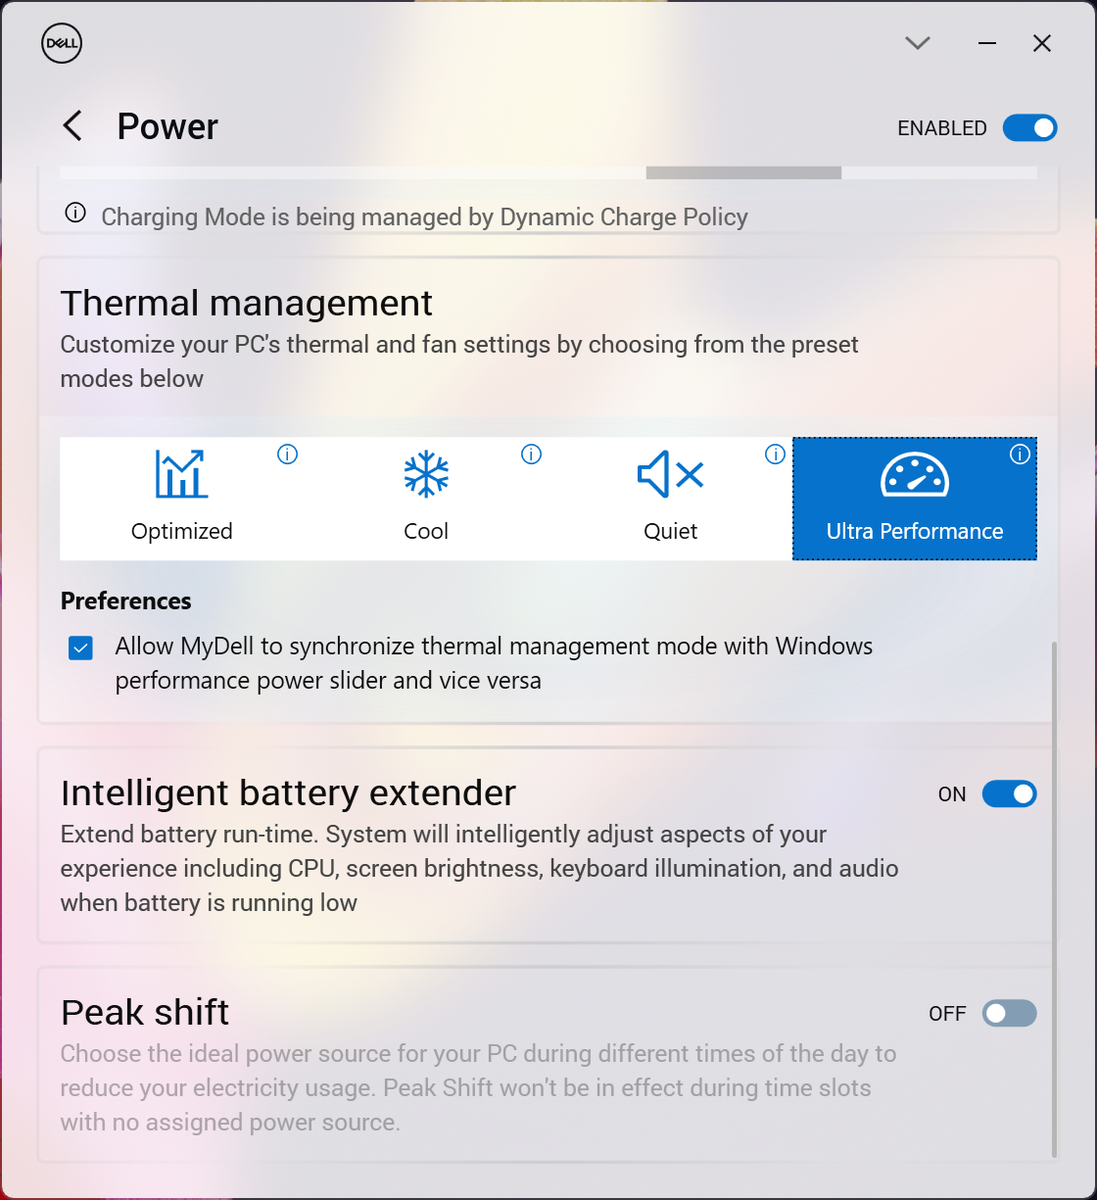
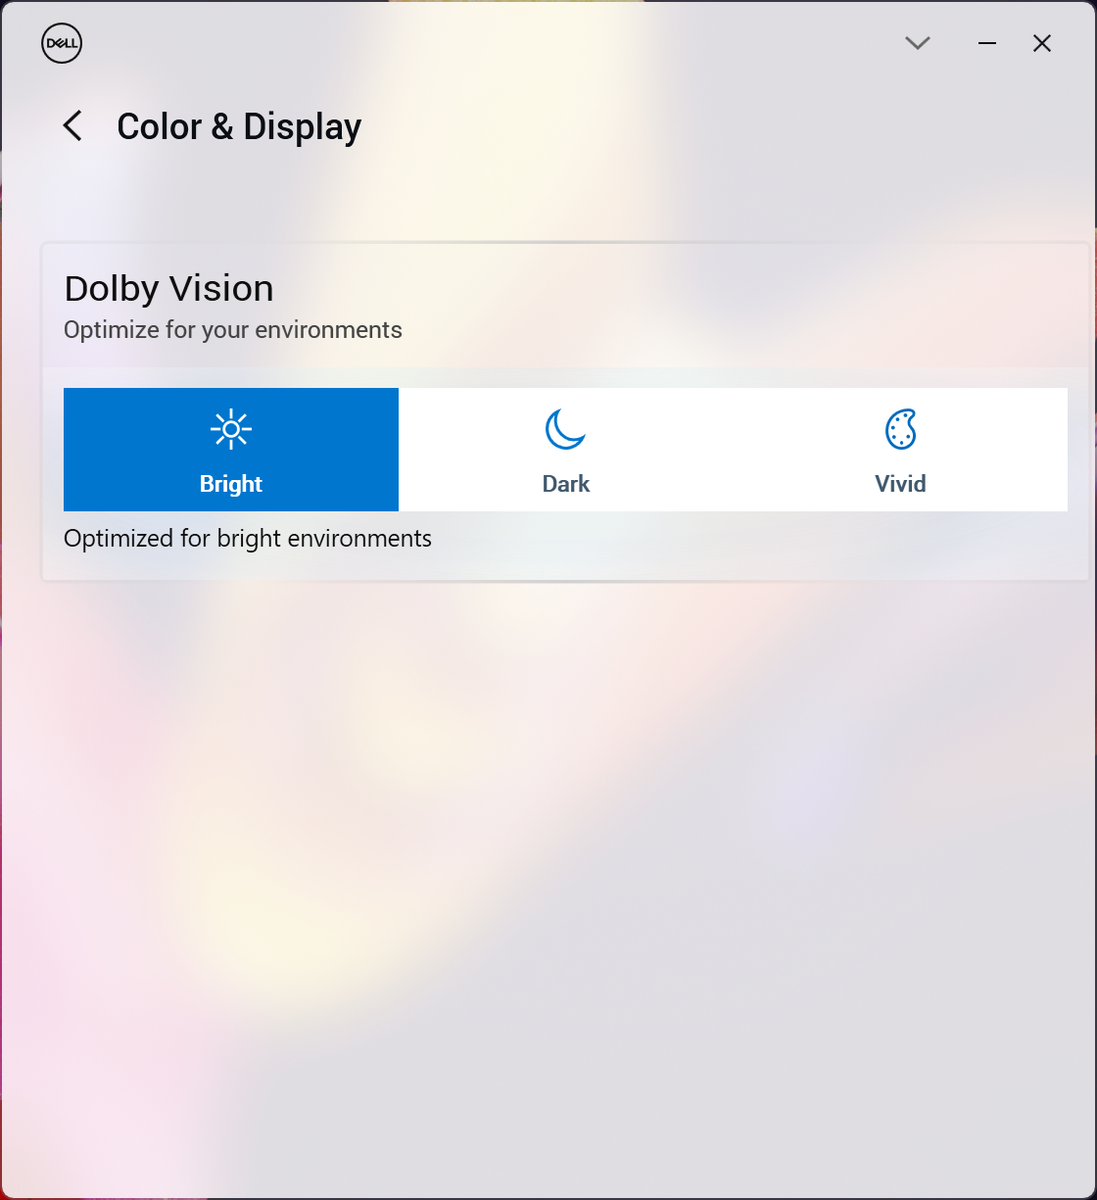
Мы выставили профиль Ultra Performance в приложении MyDell прежде чем запускать какие-либо бенчмарки. MyDell - версия Optimizer для XPS и содержит наиболее важные параметры систем. Профили производительности Dell синхронизированы со схемами электропитания Windows, что ныне, к сожалению, встречается редко.
Процессор
Многопоточная производительность Core i7-1360P практически на том же уровне, что и у Core i7-1280P, что был установлен в прошлогодней версии XPS 13 Plus. Даже поведение в многопоточном тесте CineBench R15, запущенном на длительное время, одинаковое. Lenovo Yoga 9 14IRP G8 с таким же Core i7-1360P способен держать повышенную частоту дольше.
Таким образом, многопоточная производительность не изменилась, в то время как однопоточная возросла на 10-15% по сравнению с Core i7-1280P.
Многопоточный тест CB15
Cinebench R20: CPU (Multi Core) | CPU (Single Core)
Cinebench R23: Multi Core | Single Core
Cinebench R15: CPU Multi 64Bit | CPU Single 64Bit
Blender: v2.79 BMW27 CPU
7-Zip 18.03: 7z b 4 | 7z b 4 -mmt1
Geekbench 5.5: Multi-Core | Single-Core
HWBOT x265 Benchmark v2.2: 4k Preset
LibreOffice : 20 Documents To PDF
R Benchmark 2.5: Overall mean
| CPU Performance rating | |
| Framework Laptop 13.5 13th Gen Intel | |
| Dell XPS 13 Plus 9320 Core i7-1360P | |
| Dell XPS 13 Plus 9320 i7-1280P OLED | |
| Усредн. модель с Intel Core i7-1360P | |
| Asus Zenbook S 13 OLED | |
| Lenovo Yoga Book 9i 2-in-1 Dual Screen | |
| HP Spectre x360 13.5 14t-ef000 | |
| HP Pavilion Aero 13 be0097nr -2! | |
| Lenovo ThinkPad X13 Yoga G3 21AW003UGE | |
| Lenovo Yoga 6 13ALC6 -2! | |
| Dell XPS 13 7390 Core i7-10710U -6! | |
| Microsoft Surface Laptop 4 13 i7 | |
| Dell Inspiron 13 7306-6TYH5 | |
| HP Envy 13-ba0001ng -2! | |
| Cinebench R20 / CPU (Multi Core) | |
| Framework Laptop 13.5 13th Gen Intel | |
| Dell XPS 13 Plus 9320 i7-1280P OLED | |
| Dell XPS 13 Plus 9320 Core i7-1360P | |
| Asus Zenbook S 13 OLED | |
| Усредн. модель с Intel Core i7-1360P (2474 - 4887, n=16) | |
| Lenovo Yoga Book 9i 2-in-1 Dual Screen | |
| Lenovo ThinkPad X13 Yoga G3 21AW003UGE | |
| HP Spectre x360 13.5 14t-ef000 | |
| HP Pavilion Aero 13 be0097nr | |
| Lenovo Yoga 6 13ALC6 | |
| Dell XPS 13 7390 Core i7-10710U | |
| Microsoft Surface Laptop 4 13 i7 | |
| Dell Inspiron 13 7306-6TYH5 | |
| HP Envy 13-ba0001ng | |
| Cinebench R20 / CPU (Single Core) | |
| Framework Laptop 13.5 13th Gen Intel | |
| Dell XPS 13 Plus 9320 Core i7-1360P | |
| Lenovo Yoga Book 9i 2-in-1 Dual Screen | |
| Усредн. модель с Intel Core i7-1360P (611 - 736, n=16) | |
| HP Spectre x360 13.5 14t-ef000 | |
| Dell XPS 13 Plus 9320 i7-1280P OLED | |
| Microsoft Surface Laptop 4 13 i7 | |
| Lenovo ThinkPad X13 Yoga G3 21AW003UGE | |
| Dell Inspiron 13 7306-6TYH5 | |
| Asus Zenbook S 13 OLED | |
| HP Pavilion Aero 13 be0097nr | |
| Lenovo Yoga 6 13ALC6 | |
| Dell XPS 13 7390 Core i7-10710U | |
| HP Envy 13-ba0001ng | |
| Cinebench R23 / Multi Core | |
| Framework Laptop 13.5 13th Gen Intel | |
| Dell XPS 13 Plus 9320 i7-1280P OLED | |
| Dell XPS 13 Plus 9320 Core i7-1360P | |
| Усредн. модель с Intel Core i7-1360P (6390 - 12637, n=16) | |
| Asus Zenbook S 13 OLED | |
| Lenovo Yoga Book 9i 2-in-1 Dual Screen | |
| Lenovo ThinkPad X13 Yoga G3 21AW003UGE | |
| HP Spectre x360 13.5 14t-ef000 | |
| HP Pavilion Aero 13 be0097nr | |
| Lenovo Yoga 6 13ALC6 | |
| Microsoft Surface Laptop 4 13 i7 | |
| Dell Inspiron 13 7306-6TYH5 | |
| Cinebench R23 / Single Core | |
| Framework Laptop 13.5 13th Gen Intel | |
| Dell XPS 13 Plus 9320 Core i7-1360P | |
| Lenovo Yoga Book 9i 2-in-1 Dual Screen | |
| Усредн. модель с Intel Core i7-1360P (1596 - 1909, n=16) | |
| HP Spectre x360 13.5 14t-ef000 | |
| Dell XPS 13 Plus 9320 i7-1280P OLED | |
| Microsoft Surface Laptop 4 13 i7 | |
| Lenovo ThinkPad X13 Yoga G3 21AW003UGE | |
| Asus Zenbook S 13 OLED | |
| Dell Inspiron 13 7306-6TYH5 | |
| HP Pavilion Aero 13 be0097nr | |
| Lenovo Yoga 6 13ALC6 | |
| Cinebench R15 / CPU Multi 64Bit | |
| Framework Laptop 13.5 13th Gen Intel | |
| Dell XPS 13 Plus 9320 Core i7-1360P | |
| Dell XPS 13 Plus 9320 i7-1280P OLED | |
| Усредн. модель с Intel Core i7-1360P (1079 - 2214, n=16) | |
| Asus Zenbook S 13 OLED | |
| HP Spectre x360 13.5 14t-ef000 | |
| HP Pavilion Aero 13 be0097nr | |
| Lenovo Yoga Book 9i 2-in-1 Dual Screen | |
| Lenovo Yoga 6 13ALC6 | |
| Lenovo ThinkPad X13 Yoga G3 21AW003UGE | |
| Dell XPS 13 7390 Core i7-10710U | |
| Microsoft Surface Laptop 4 13 i7 | |
| Dell Inspiron 13 7306-6TYH5 | |
| Dell Inspiron 13 7306-6TYH5 | |
| HP Envy 13-ba0001ng | |
| Cinebench R15 / CPU Single 64Bit | |
| Framework Laptop 13.5 13th Gen Intel | |
| Lenovo Yoga Book 9i 2-in-1 Dual Screen | |
| Dell XPS 13 Plus 9320 Core i7-1360P | |
| HP Spectre x360 13.5 14t-ef000 | |
| Усредн. модель с Intel Core i7-1360P (180 - 271, n=16) | |
| Asus Zenbook S 13 OLED | |
| HP Pavilion Aero 13 be0097nr | |
| Dell XPS 13 Plus 9320 i7-1280P OLED | |
| Microsoft Surface Laptop 4 13 i7 | |
| Dell Inspiron 13 7306-6TYH5 | |
| Dell Inspiron 13 7306-6TYH5 | |
| Lenovo Yoga 6 13ALC6 | |
| Dell XPS 13 7390 Core i7-10710U | |
| HP Envy 13-ba0001ng | |
| Lenovo ThinkPad X13 Yoga G3 21AW003UGE | |
| Blender / v2.79 BMW27 CPU | |
| HP Envy 13-ba0001ng | |
| Dell Inspiron 13 7306-6TYH5 | |
| Microsoft Surface Laptop 4 13 i7 | |
| Dell XPS 13 7390 Core i7-10710U | |
| Lenovo ThinkPad X13 Yoga G3 21AW003UGE | |
| Lenovo ThinkPad X13 Yoga G3 21AW003UGE | |
| HP Spectre x360 13.5 14t-ef000 | |
| Lenovo Yoga Book 9i 2-in-1 Dual Screen | |
| Lenovo Yoga 6 13ALC6 | |
| HP Pavilion Aero 13 be0097nr | |
| Усредн. модель с Intel Core i7-1360P (268 - 496, n=17) | |
| Asus Zenbook S 13 OLED | |
| Dell XPS 13 Plus 9320 Core i7-1360P | |
| Dell XPS 13 Plus 9320 i7-1280P OLED | |
| Framework Laptop 13.5 13th Gen Intel | |
| 7-Zip 18.03 / 7z b 4 | |
| Framework Laptop 13.5 13th Gen Intel | |
| Dell XPS 13 Plus 9320 i7-1280P OLED | |
| Dell XPS 13 Plus 9320 Core i7-1360P | |
| Asus Zenbook S 13 OLED | |
| HP Pavilion Aero 13 be0097nr | |
| Усредн. модель с Intel Core i7-1360P (26534 - 52959, n=16) | |
| Lenovo Yoga 6 13ALC6 | |
| Lenovo ThinkPad X13 Yoga G3 21AW003UGE | |
| Lenovo Yoga Book 9i 2-in-1 Dual Screen | |
| HP Spectre x360 13.5 14t-ef000 | |
| Dell XPS 13 7390 Core i7-10710U | |
| Microsoft Surface Laptop 4 13 i7 | |
| Dell Inspiron 13 7306-6TYH5 | |
| HP Envy 13-ba0001ng | |
| 7-Zip 18.03 / 7z b 4 -mmt1 | |
| Framework Laptop 13.5 13th Gen Intel | |
| Усредн. модель с Intel Core i7-1360P (4647 - 5973, n=16) | |
| Dell XPS 13 Plus 9320 Core i7-1360P | |
| HP Spectre x360 13.5 14t-ef000 | |
| Lenovo Yoga Book 9i 2-in-1 Dual Screen | |
| Asus Zenbook S 13 OLED | |
| HP Pavilion Aero 13 be0097nr | |
| Microsoft Surface Laptop 4 13 i7 | |
| Dell Inspiron 13 7306-6TYH5 | |
| Dell XPS 13 Plus 9320 i7-1280P OLED | |
| HP Envy 13-ba0001ng | |
| Lenovo ThinkPad X13 Yoga G3 21AW003UGE | |
| Lenovo Yoga 6 13ALC6 | |
| Dell XPS 13 7390 Core i7-10710U | |
| Geekbench 5.5 / Multi-Core | |
| Framework Laptop 13.5 13th Gen Intel | |
| Dell XPS 13 Plus 9320 i7-1280P OLED | |
| Dell XPS 13 Plus 9320 Core i7-1360P | |
| Усредн. модель с Intel Core i7-1360P (7549 - 10817, n=17) | |
| HP Spectre x360 13.5 14t-ef000 | |
| Lenovo Yoga Book 9i 2-in-1 Dual Screen | |
| Lenovo ThinkPad X13 Yoga G3 21AW003UGE | |
| Asus Zenbook S 13 OLED | |
| Dell Inspiron 13 7306-6TYH5 | |
| Microsoft Surface Laptop 4 13 i7 | |
| HP Envy 13-ba0001ng | |
| Geekbench 5.5 / Single-Core | |
| Framework Laptop 13.5 13th Gen Intel | |
| Dell XPS 13 Plus 9320 Core i7-1360P | |
| Lenovo Yoga Book 9i 2-in-1 Dual Screen | |
| Dell XPS 13 Plus 9320 i7-1280P OLED | |
| Усредн. модель с Intel Core i7-1360P (1435 - 1871, n=17) | |
| HP Spectre x360 13.5 14t-ef000 | |
| Dell Inspiron 13 7306-6TYH5 | |
| Microsoft Surface Laptop 4 13 i7 | |
| Asus Zenbook S 13 OLED | |
| Lenovo ThinkPad X13 Yoga G3 21AW003UGE | |
| HP Envy 13-ba0001ng | |
| HWBOT x265 Benchmark v2.2 / 4k Preset | |
| Framework Laptop 13.5 13th Gen Intel | |
| Dell XPS 13 Plus 9320 i7-1280P OLED | |
| Dell XPS 13 Plus 9320 Core i7-1360P | |
| Asus Zenbook S 13 OLED | |
| Усредн. модель с Intel Core i7-1360P (6.9 - 14.2, n=16) | |
| HP Pavilion Aero 13 be0097nr | |
| Lenovo Yoga Book 9i 2-in-1 Dual Screen | |
| HP Spectre x360 13.5 14t-ef000 | |
| Lenovo Yoga 6 13ALC6 | |
| Lenovo ThinkPad X13 Yoga G3 21AW003UGE | |
| Dell XPS 13 7390 Core i7-10710U | |
| Microsoft Surface Laptop 4 13 i7 | |
| Dell Inspiron 13 7306-6TYH5 | |
| HP Envy 13-ba0001ng | |
| LibreOffice / 20 Documents To PDF | |
| Lenovo Yoga 6 13ALC6 | |
| HP Envy 13-ba0001ng | |
| Asus Zenbook S 13 OLED | |
| HP Pavilion Aero 13 be0097nr | |
| Lenovo ThinkPad X13 Yoga G3 21AW003UGE | |
| Microsoft Surface Laptop 4 13 i7 | |
| Dell XPS 13 Plus 9320 i7-1280P OLED | |
| Lenovo Yoga Book 9i 2-in-1 Dual Screen | |
| Dell XPS 13 Plus 9320 Core i7-1360P | |
| Dell Inspiron 13 7306-6TYH5 | |
| Усредн. модель с Intel Core i7-1360P (40.3 - 57.2, n=16) | |
| HP Spectre x360 13.5 14t-ef000 | |
| Framework Laptop 13.5 13th Gen Intel | |
| R Benchmark 2.5 / Overall mean | |
| HP Envy 13-ba0001ng | |
| Lenovo Yoga 6 13ALC6 | |
| Microsoft Surface Laptop 4 13 i7 | |
| Lenovo ThinkPad X13 Yoga G3 21AW003UGE | |
| Dell Inspiron 13 7306-6TYH5 | |
| HP Pavilion Aero 13 be0097nr | |
| Asus Zenbook S 13 OLED | |
| Dell XPS 13 Plus 9320 i7-1280P OLED | |
| HP Spectre x360 13.5 14t-ef000 | |
| Усредн. модель с Intel Core i7-1360P (0.445 - 0.583, n=16) | |
| Lenovo Yoga Book 9i 2-in-1 Dual Screen | |
| Dell XPS 13 Plus 9320 Core i7-1360P | |
| Framework Laptop 13.5 13th Gen Intel | |
Cinebench R20: CPU (Multi Core) | CPU (Single Core)
Cinebench R23: Multi Core | Single Core
Cinebench R15: CPU Multi 64Bit | CPU Single 64Bit
Blender: v2.79 BMW27 CPU
7-Zip 18.03: 7z b 4 | 7z b 4 -mmt1
Geekbench 5.5: Multi-Core | Single-Core
HWBOT x265 Benchmark v2.2: 4k Preset
LibreOffice : 20 Documents To PDF
R Benchmark 2.5: Overall mean
* ... меньше = лучше
AIDA64: FP32 Ray-Trace | FPU Julia | CPU SHA3 | CPU Queen | FPU SinJulia | FPU Mandel | CPU AES | CPU ZLib | FP64 Ray-Trace | CPU PhotoWorxx
| Performance rating | |
| Framework Laptop 13.5 13th Gen Intel | |
| Dell XPS 13 Plus 9320 i7-1280P OLED | |
| Dell XPS 13 Plus 9320 Core i7-1360P | |
| HP Spectre x360 13.5 14t-ef000 | |
| Lenovo ThinkPad X13 Yoga G3 21AW003UGE | |
| AIDA64 / FP32 Ray-Trace | |
| Framework Laptop 13.5 13th Gen Intel | |
| Dell XPS 13 Plus 9320 i7-1280P OLED | |
| Dell XPS 13 Plus 9320 Core i7-1360P | |
| Lenovo ThinkPad X13 Yoga G3 21AW003UGE | |
| HP Spectre x360 13.5 14t-ef000 | |
| AIDA64 / FPU Julia | |
| Framework Laptop 13.5 13th Gen Intel | |
| Dell XPS 13 Plus 9320 i7-1280P OLED | |
| Dell XPS 13 Plus 9320 Core i7-1360P | |
| Lenovo ThinkPad X13 Yoga G3 21AW003UGE | |
| HP Spectre x360 13.5 14t-ef000 | |
| AIDA64 / CPU SHA3 | |
| Framework Laptop 13.5 13th Gen Intel | |
| Dell XPS 13 Plus 9320 i7-1280P OLED | |
| Dell XPS 13 Plus 9320 Core i7-1360P | |
| Lenovo ThinkPad X13 Yoga G3 21AW003UGE | |
| HP Spectre x360 13.5 14t-ef000 | |
| AIDA64 / CPU Queen | |
| Framework Laptop 13.5 13th Gen Intel | |
| Dell XPS 13 Plus 9320 i7-1280P OLED | |
| Dell XPS 13 Plus 9320 Core i7-1360P | |
| Lenovo ThinkPad X13 Yoga G3 21AW003UGE | |
| HP Spectre x360 13.5 14t-ef000 | |
| AIDA64 / FPU SinJulia | |
| Framework Laptop 13.5 13th Gen Intel | |
| Dell XPS 13 Plus 9320 i7-1280P OLED | |
| Dell XPS 13 Plus 9320 Core i7-1360P | |
| Lenovo ThinkPad X13 Yoga G3 21AW003UGE | |
| HP Spectre x360 13.5 14t-ef000 | |
| AIDA64 / FPU Mandel | |
| Framework Laptop 13.5 13th Gen Intel | |
| Dell XPS 13 Plus 9320 i7-1280P OLED | |
| Dell XPS 13 Plus 9320 Core i7-1360P | |
| Lenovo ThinkPad X13 Yoga G3 21AW003UGE | |
| HP Spectre x360 13.5 14t-ef000 | |
| AIDA64 / CPU AES | |
| Framework Laptop 13.5 13th Gen Intel | |
| HP Spectre x360 13.5 14t-ef000 | |
| Dell XPS 13 Plus 9320 i7-1280P OLED | |
| Dell XPS 13 Plus 9320 Core i7-1360P | |
| Lenovo ThinkPad X13 Yoga G3 21AW003UGE | |
| AIDA64 / CPU ZLib | |
| Framework Laptop 13.5 13th Gen Intel | |
| Dell XPS 13 Plus 9320 Core i7-1360P | |
| Dell XPS 13 Plus 9320 i7-1280P OLED | |
| Lenovo ThinkPad X13 Yoga G3 21AW003UGE | |
| HP Spectre x360 13.5 14t-ef000 | |
| AIDA64 / FP64 Ray-Trace | |
| Framework Laptop 13.5 13th Gen Intel | |
| Dell XPS 13 Plus 9320 i7-1280P OLED | |
| Dell XPS 13 Plus 9320 Core i7-1360P | |
| HP Spectre x360 13.5 14t-ef000 | |
| Lenovo ThinkPad X13 Yoga G3 21AW003UGE | |
| AIDA64 / CPU PhotoWorxx | |
| Dell XPS 13 Plus 9320 Core i7-1360P | |
| Dell XPS 13 Plus 9320 i7-1280P OLED | |
| HP Spectre x360 13.5 14t-ef000 | |
| Lenovo ThinkPad X13 Yoga G3 21AW003UGE | |
| Framework Laptop 13.5 13th Gen Intel | |
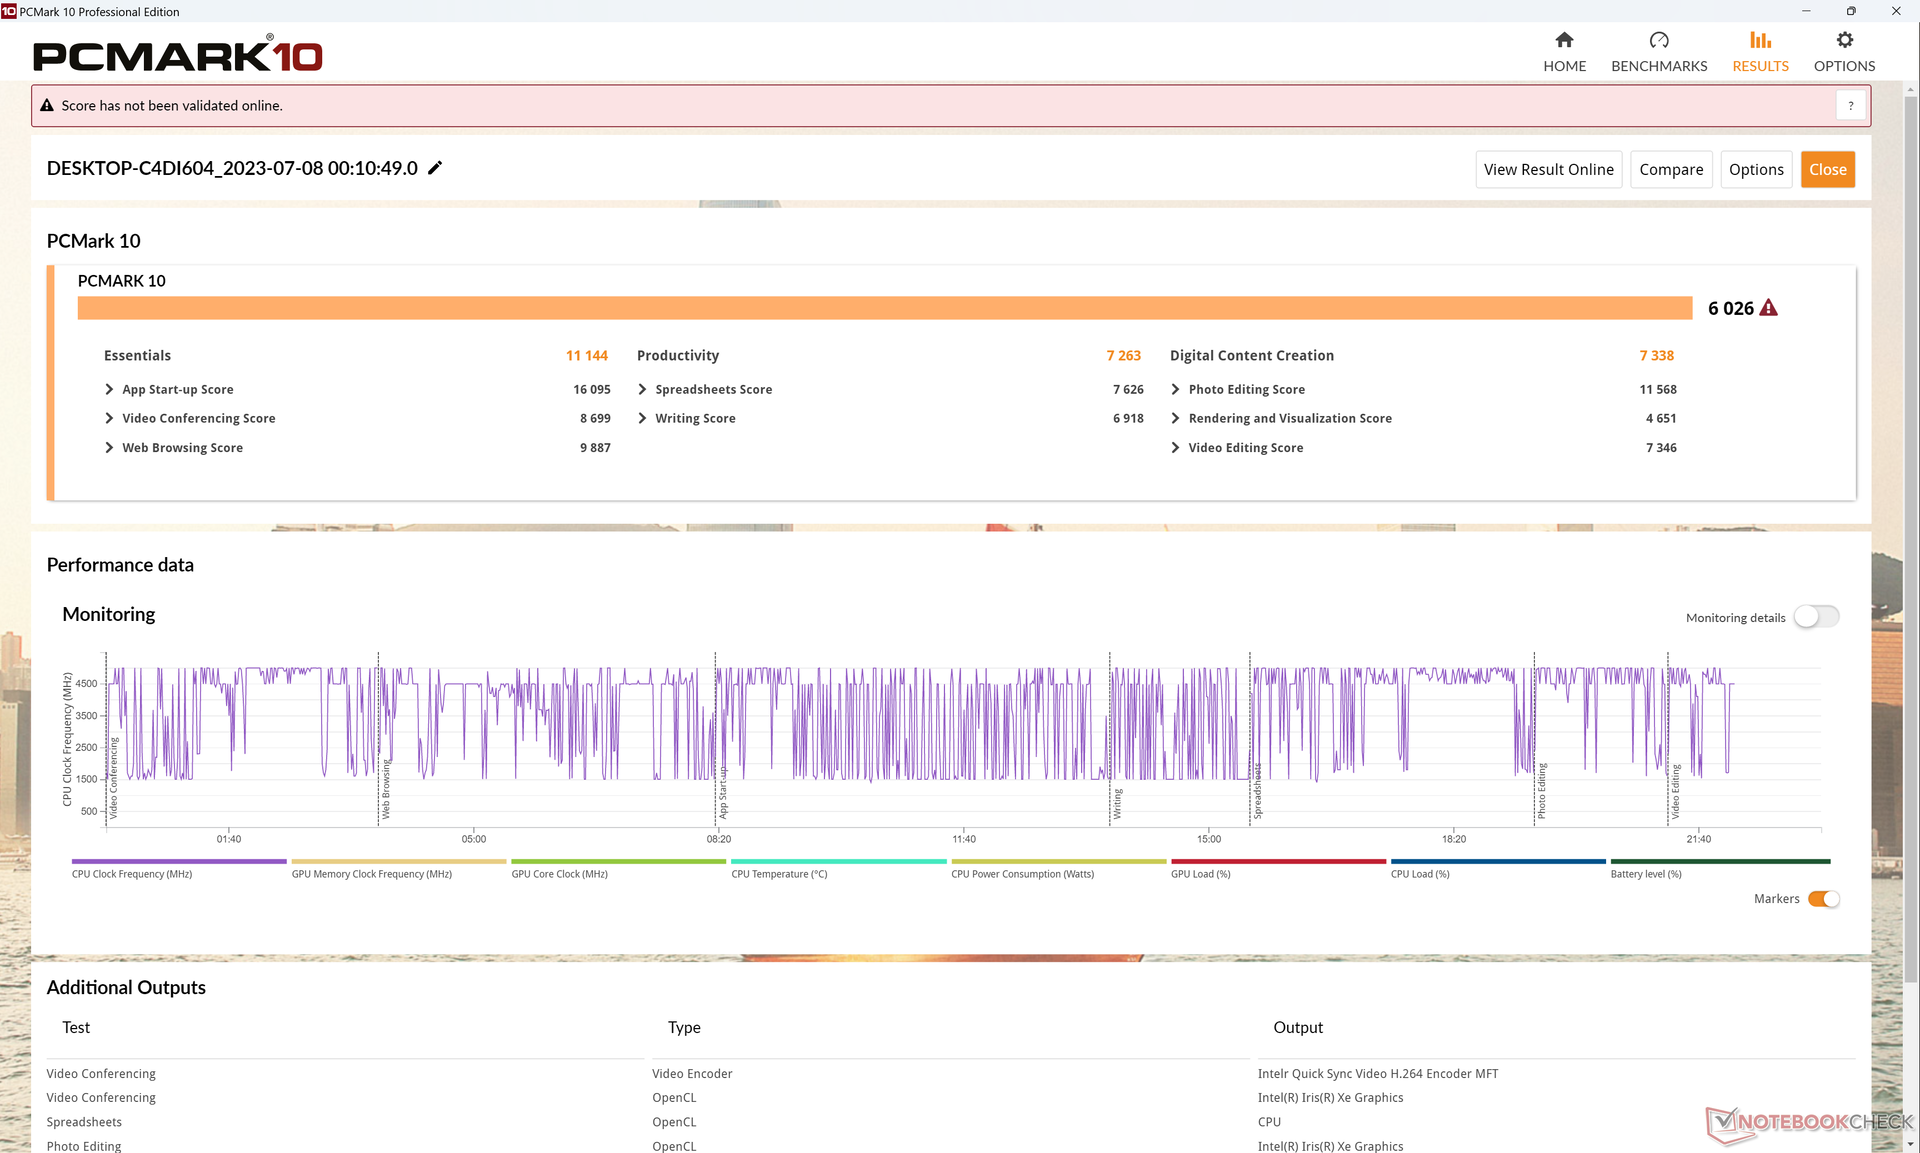
Общая производительность
Оценки в PCMark минимально выше, чем у предыдущего XPS 13 Plus за счет более быстрой памяти и несколько более высокой однопоточной производительности.
CrossMark: Overall | Productivity | Creativity | Responsiveness
| PCMark 10 / Score | |
| Framework Laptop 13.5 13th Gen Intel | |
| Dell XPS 13 Plus 9320 Core i7-1360P | |
| Усредн. модель с Intel Core i7-1360P (5360 - 6998, n=16) | |
| Dell XPS 13 Plus 9320 i7-1280P OLED | |
| HP Spectre x360 13.5 14t-ef000 | |
| Lenovo ThinkPad X13 Yoga G3 21AW003UGE | |
| Dell XPS 13 7390 Core i7-10710U | |
| PCMark 10 / Essentials | |
| Framework Laptop 13.5 13th Gen Intel | |
| HP Spectre x360 13.5 14t-ef000 | |
| Dell XPS 13 Plus 9320 Core i7-1360P | |
| Усредн. модель с Intel Core i7-1360P (9883 - 12059, n=16) | |
| Lenovo ThinkPad X13 Yoga G3 21AW003UGE | |
| Dell XPS 13 Plus 9320 i7-1280P OLED | |
| Dell XPS 13 7390 Core i7-10710U | |
| PCMark 10 / Productivity | |
| Framework Laptop 13.5 13th Gen Intel | |
| Усредн. модель с Intel Core i7-1360P (6572 - 9371, n=16) | |
| HP Spectre x360 13.5 14t-ef000 | |
| Dell XPS 13 Plus 9320 Core i7-1360P | |
| Dell XPS 13 Plus 9320 i7-1280P OLED | |
| Lenovo ThinkPad X13 Yoga G3 21AW003UGE | |
| Dell XPS 13 7390 Core i7-10710U | |
| PCMark 10 / Digital Content Creation | |
| Framework Laptop 13.5 13th Gen Intel | |
| Dell XPS 13 Plus 9320 Core i7-1360P | |
| Усредн. модель с Intel Core i7-1360P (5723 - 9597, n=16) | |
| Dell XPS 13 Plus 9320 i7-1280P OLED | |
| HP Spectre x360 13.5 14t-ef000 | |
| Lenovo ThinkPad X13 Yoga G3 21AW003UGE | |
| Dell XPS 13 7390 Core i7-10710U | |
| CrossMark / Overall | |
| Dell XPS 13 Plus 9320 Core i7-1360P | |
| Dell XPS 13 Plus 9320 i7-1280P OLED | |
| Framework Laptop 13.5 13th Gen Intel | |
| Усредн. модель с Intel Core i7-1360P (1527 - 1891, n=15) | |
| HP Spectre x360 13.5 14t-ef000 | |
| Lenovo ThinkPad X13 Yoga G3 21AW003UGE | |
| CrossMark / Productivity | |
| Framework Laptop 13.5 13th Gen Intel | |
| Dell XPS 13 Plus 9320 Core i7-1360P | |
| Dell XPS 13 Plus 9320 i7-1280P OLED | |
| Усредн. модель с Intel Core i7-1360P (1503 - 1842, n=15) | |
| HP Spectre x360 13.5 14t-ef000 | |
| Lenovo ThinkPad X13 Yoga G3 21AW003UGE | |
| CrossMark / Creativity | |
| Dell XPS 13 Plus 9320 Core i7-1360P | |
| Dell XPS 13 Plus 9320 i7-1280P OLED | |
| Framework Laptop 13.5 13th Gen Intel | |
| Усредн. модель с Intel Core i7-1360P (1558 - 2003, n=15) | |
| HP Spectre x360 13.5 14t-ef000 | |
| Lenovo ThinkPad X13 Yoga G3 21AW003UGE | |
| CrossMark / Responsiveness | |
| Усредн. модель с Intel Core i7-1360P (1311 - 1899, n=15) | |
| Dell XPS 13 Plus 9320 i7-1280P OLED | |
| Dell XPS 13 Plus 9320 Core i7-1360P | |
| Framework Laptop 13.5 13th Gen Intel | |
| HP Spectre x360 13.5 14t-ef000 | |
| Lenovo ThinkPad X13 Yoga G3 21AW003UGE | |
| PCMark 10 Score | 6026 баллов | |
? | ||
| AIDA64 / Memory Copy | |
| Dell XPS 13 Plus 9320 Core i7-1360P | |
| Dell XPS 13 Plus 9320 i7-1280P OLED | |
| Усредн. модель с Intel Core i7-1360P (44299 - 72748, n=16) | |
| HP Spectre x360 13.5 14t-ef000 | |
| Lenovo ThinkPad X13 Yoga G3 21AW003UGE | |
| Framework Laptop 13.5 13th Gen Intel | |
| AIDA64 / Memory Read | |
| Dell XPS 13 Plus 9320 i7-1280P OLED | |
| Dell XPS 13 Plus 9320 Core i7-1360P | |
| HP Spectre x360 13.5 14t-ef000 | |
| Усредн. модель с Intel Core i7-1360P (44751 - 68945, n=16) | |
| Lenovo ThinkPad X13 Yoga G3 21AW003UGE | |
| Framework Laptop 13.5 13th Gen Intel | |
| AIDA64 / Memory Write | |
| Dell XPS 13 Plus 9320 Core i7-1360P | |
| Усредн. модель с Intel Core i7-1360P (45887 - 93331, n=16) | |
| HP Spectre x360 13.5 14t-ef000 | |
| Dell XPS 13 Plus 9320 i7-1280P OLED | |
| Framework Laptop 13.5 13th Gen Intel | |
| Lenovo ThinkPad X13 Yoga G3 21AW003UGE | |
| AIDA64 / Memory Latency | |
| Dell XPS 13 Plus 9320 i7-1280P OLED | |
| Lenovo ThinkPad X13 Yoga G3 21AW003UGE | |
| Dell XPS 13 Plus 9320 Core i7-1360P | |
| Усредн. модель с Intel Core i7-1360P (85 - 110.5, n=16) | |
| HP Spectre x360 13.5 14t-ef000 | |
| Framework Laptop 13.5 13th Gen Intel | |
* ... меньше = лучше
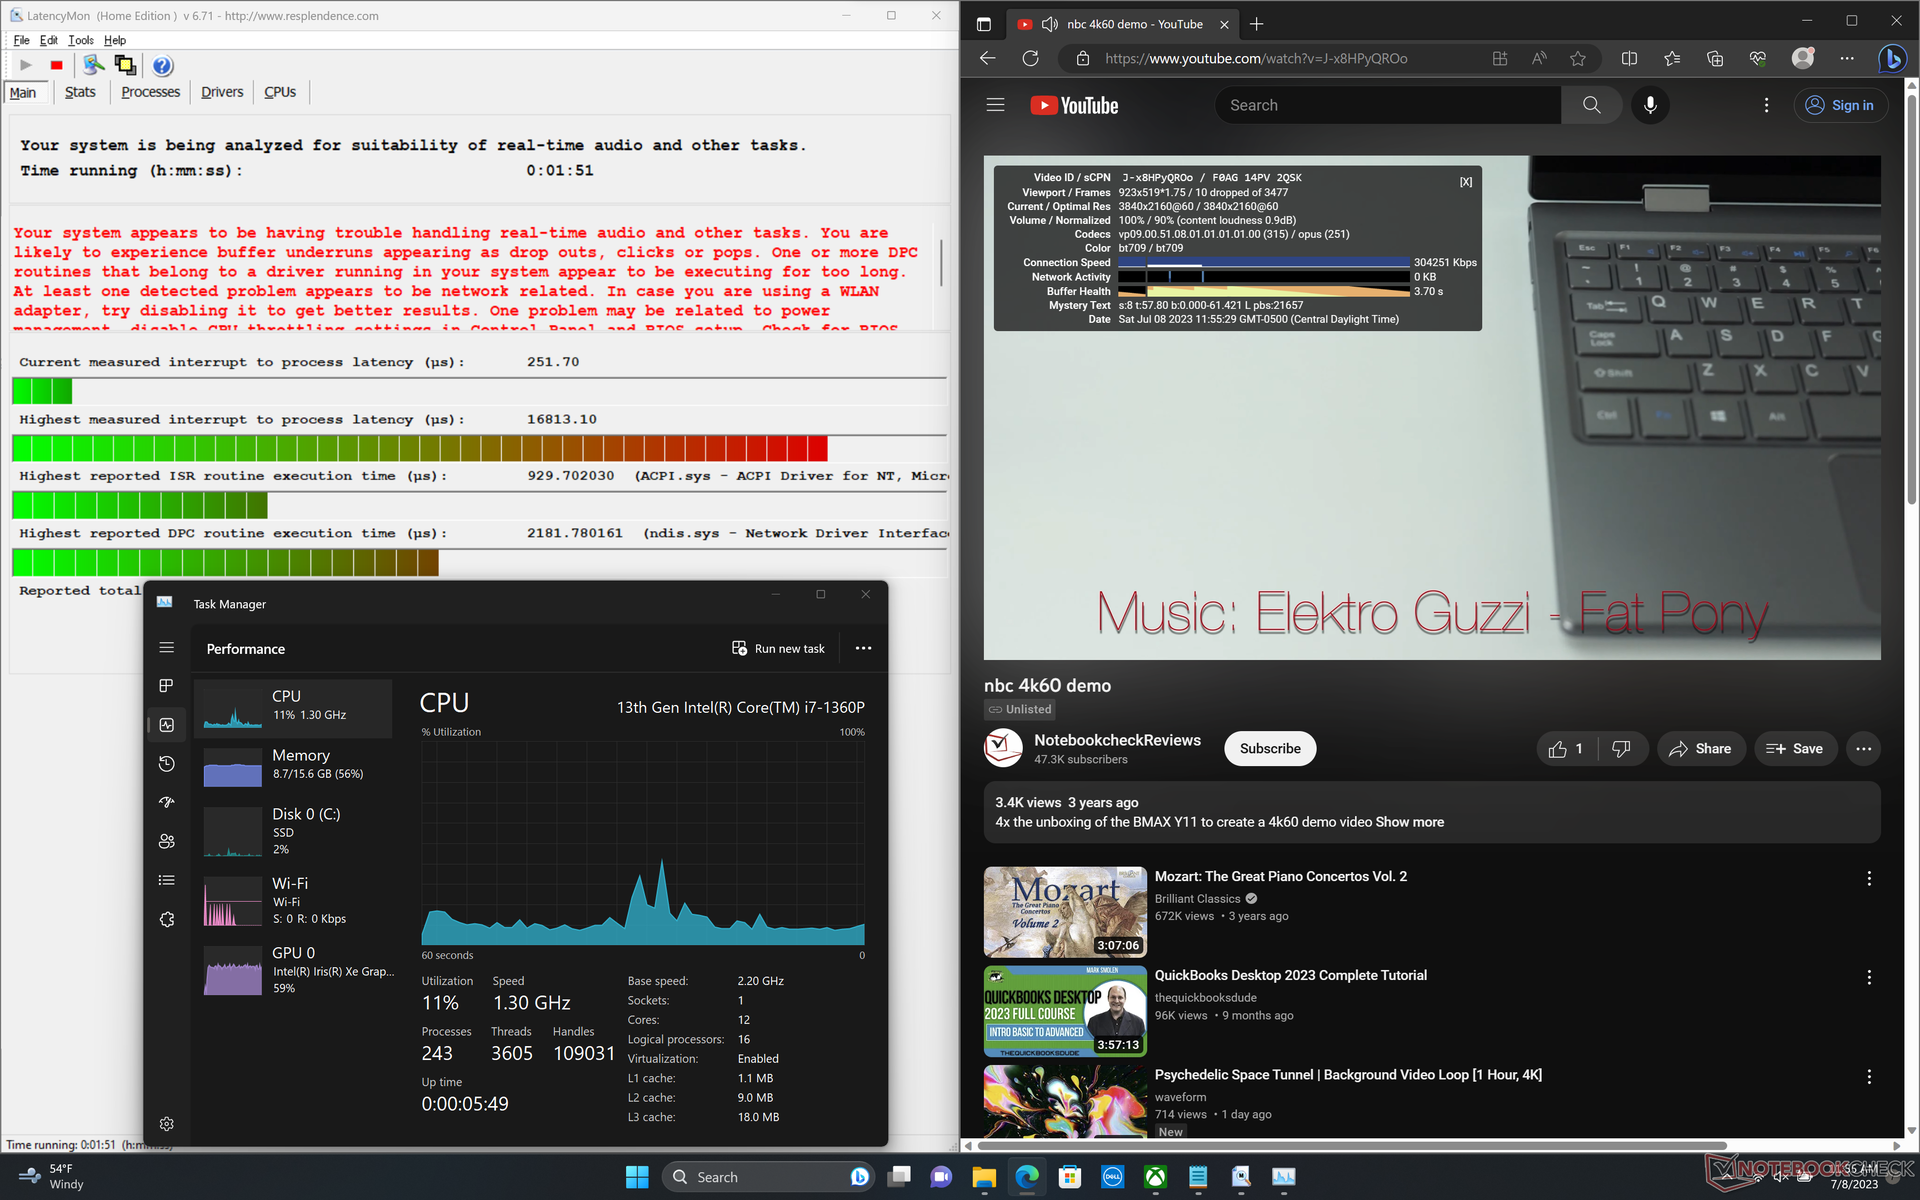
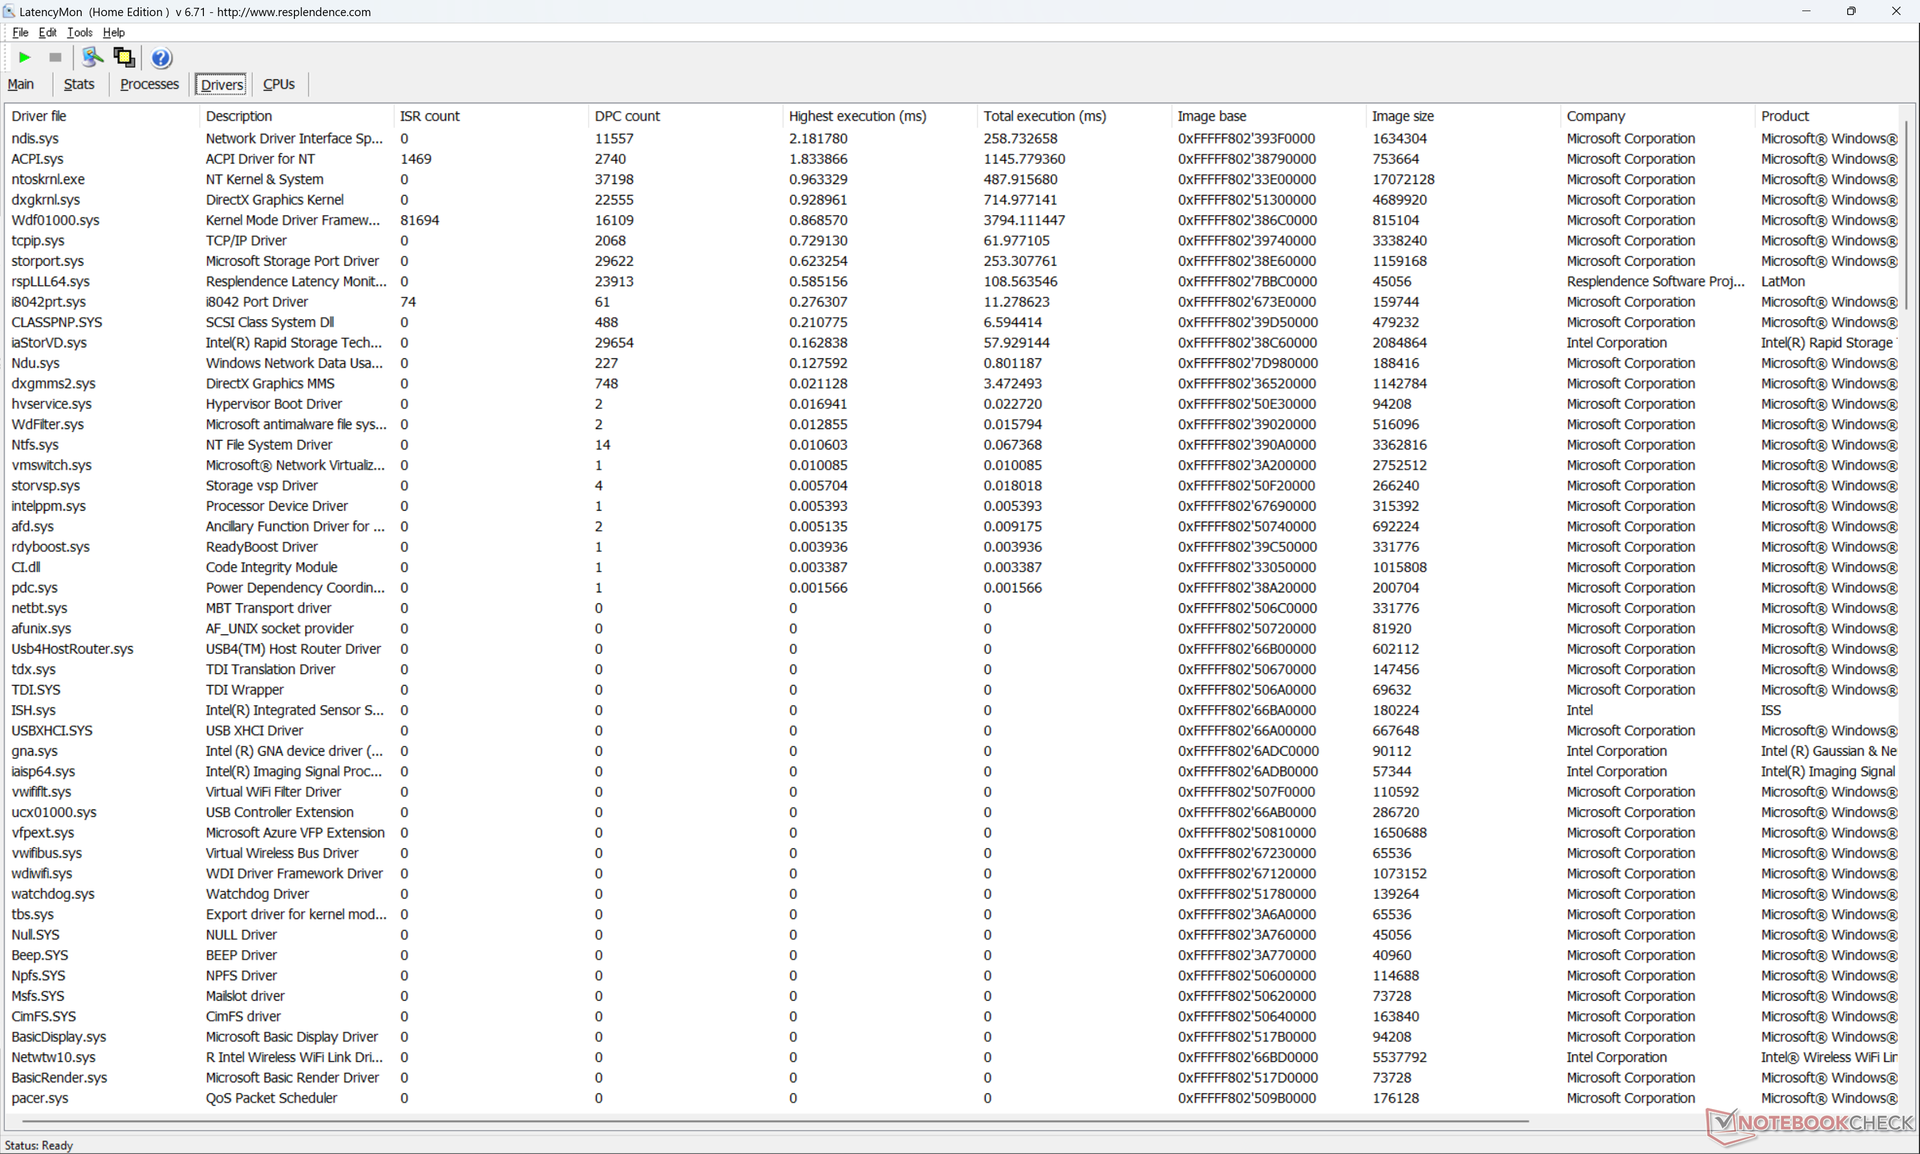
Задержки DPC
Как показал наш стандартный тест (множество вкладок в браузере, 4K YouTube видео, Prime95) в системе присутствуют значительные задержки DPC.
| DPC Latencies / LatencyMon - interrupt to process latency (max), Web, Youtube, Prime95 | |
| Dell XPS 13 Plus 9320 Core i7-1360P | |
| Lenovo ThinkPad X13 Yoga G3 21AW003UGE | |
| Dell XPS 13 Plus 9320 i5-1240p | |
| Dell XPS 13 Plus 9320 4K | |
| HP Spectre x360 13.5 14t-ef000 | |
| Dell XPS 13 Plus 9320 i7-1280P OLED | |
| Framework Laptop 13.5 13th Gen Intel | |
* ... меньше = лучше
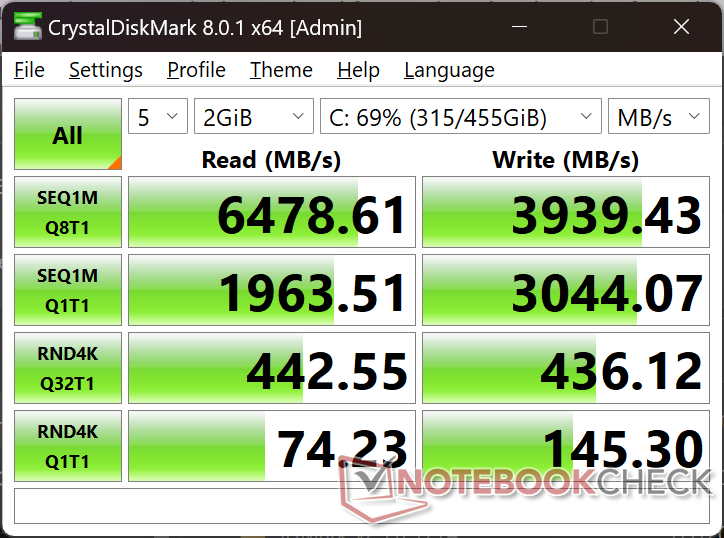
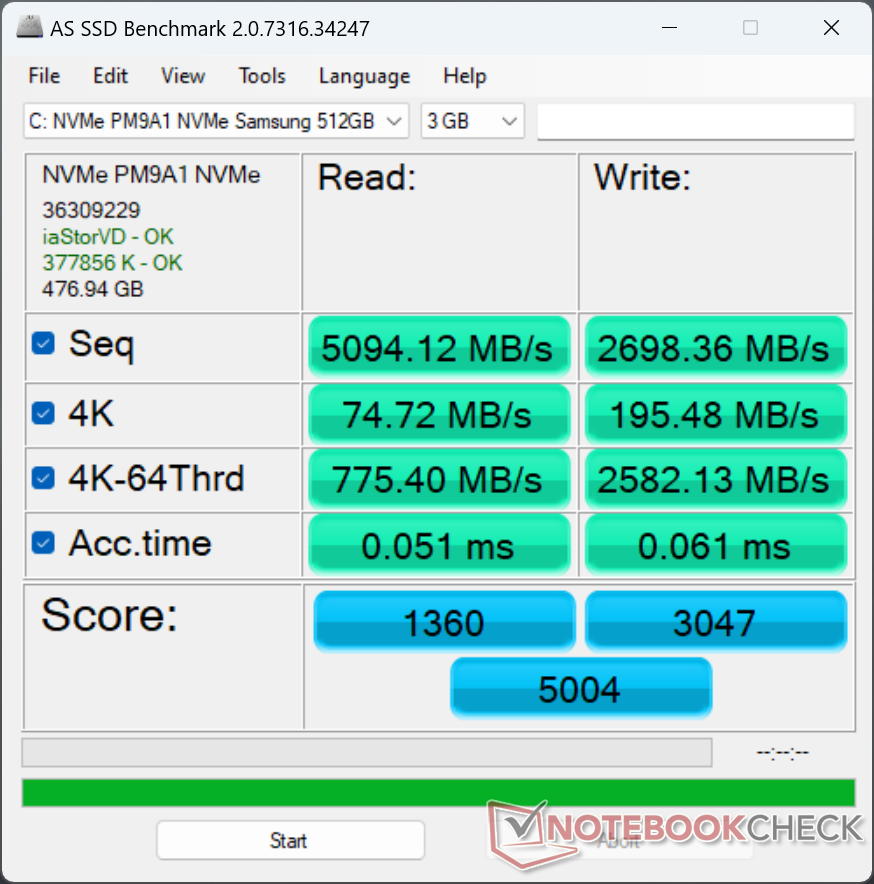
Хранение данных
Для XPS 13 Plus производитель использует накопители от Samsung, Micron и Western Digital. В нашем тестовом образце установлен SSD Samsung PM9A1 с поддержкой PCIe4 x4, который обеспечивает скорость последовательного чтения до 7000 МБ/с и последовательной записи до 4000 МБ/с. К несчастью, скорость накопителя ограничивается до 2000 МБ/с при длительной нагрузке, что видно в тесте длительного чтения DiskSpd. Повторение теста не привело к изменению результатов. К слову, у предшественника был точно такой же накопитель и за ним такого поведения мы не заметили. Охлаждения накопителя не изменилось, потому причины данного явления не ясны.

| Drive Performance rating - Percent | |
| Framework Laptop 13.5 13th Gen Intel | |
| Dell XPS 13 Plus 9320 i7-1280P OLED | |
| Dell XPS 13 Plus 9320 Core i7-1360P | |
| HP Spectre x360 13.5 14t-ef000 | |
| Lenovo ThinkPad X13 Yoga G3 21AW003UGE | |
| Dell XPS 13 7390 Core i7-10710U -8! | |
* ... меньше = лучше
Чтение в DiskSpd, Глубина запроса 8
Видеокарта
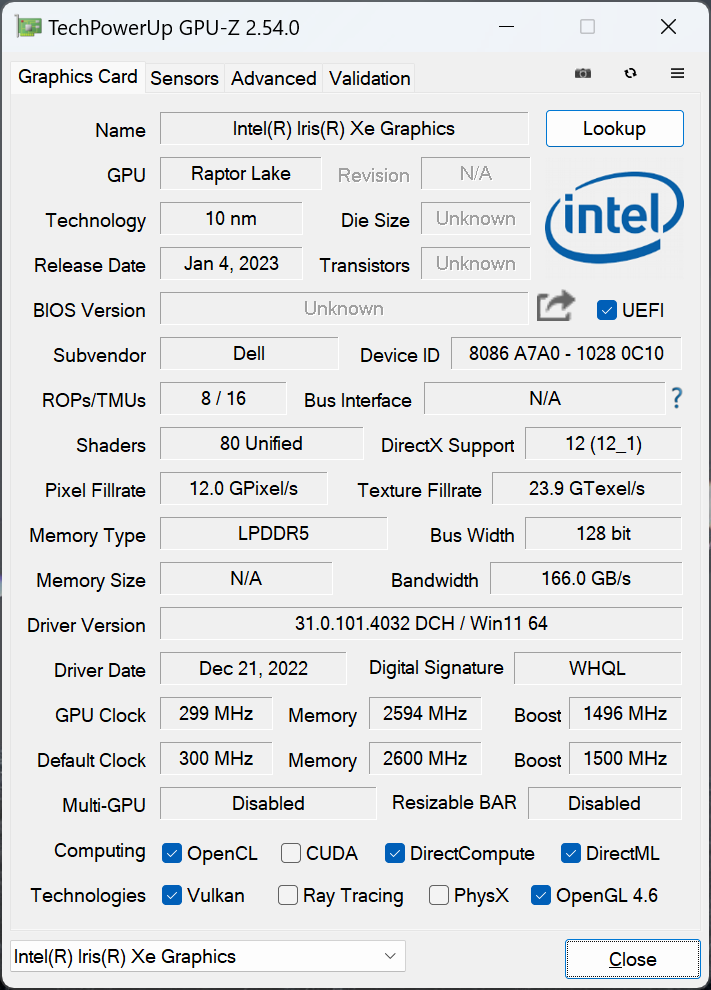
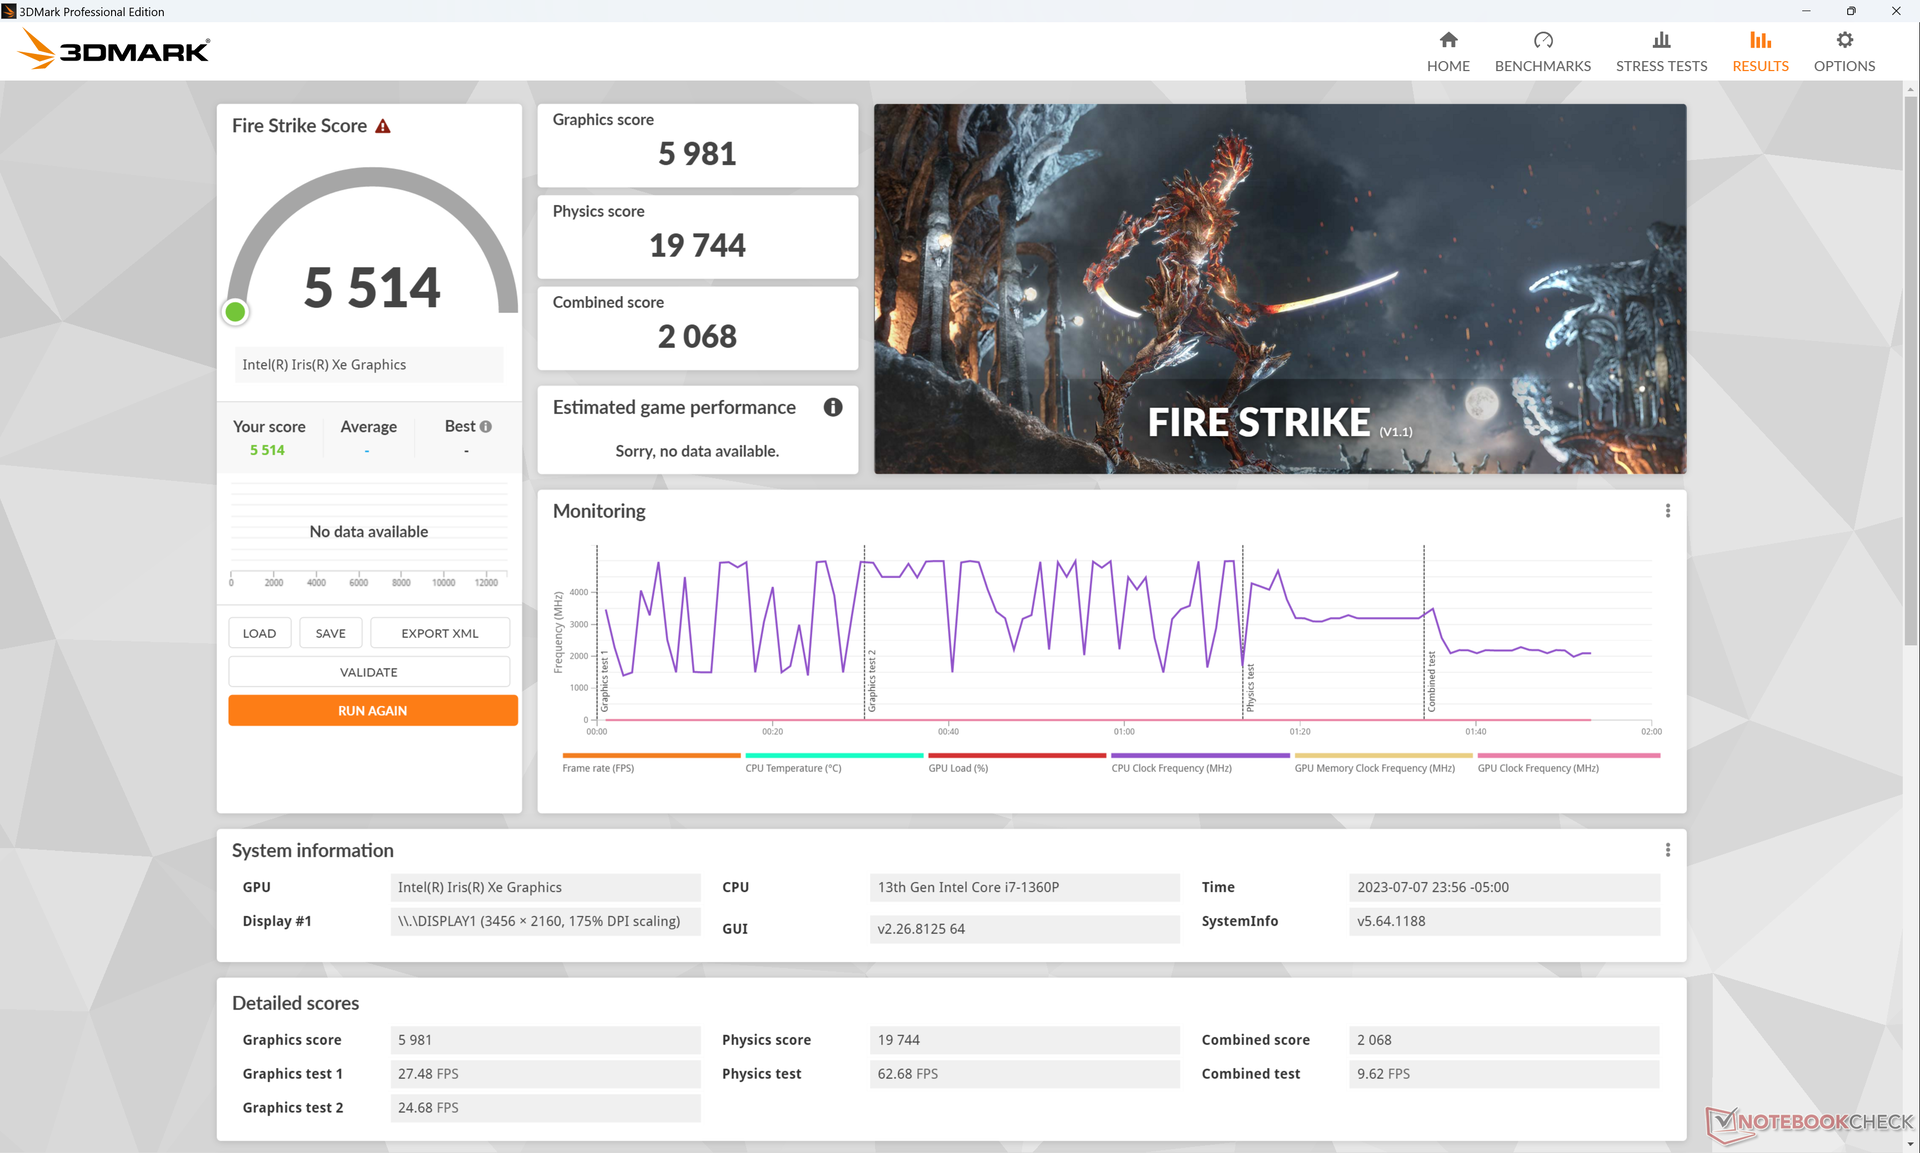
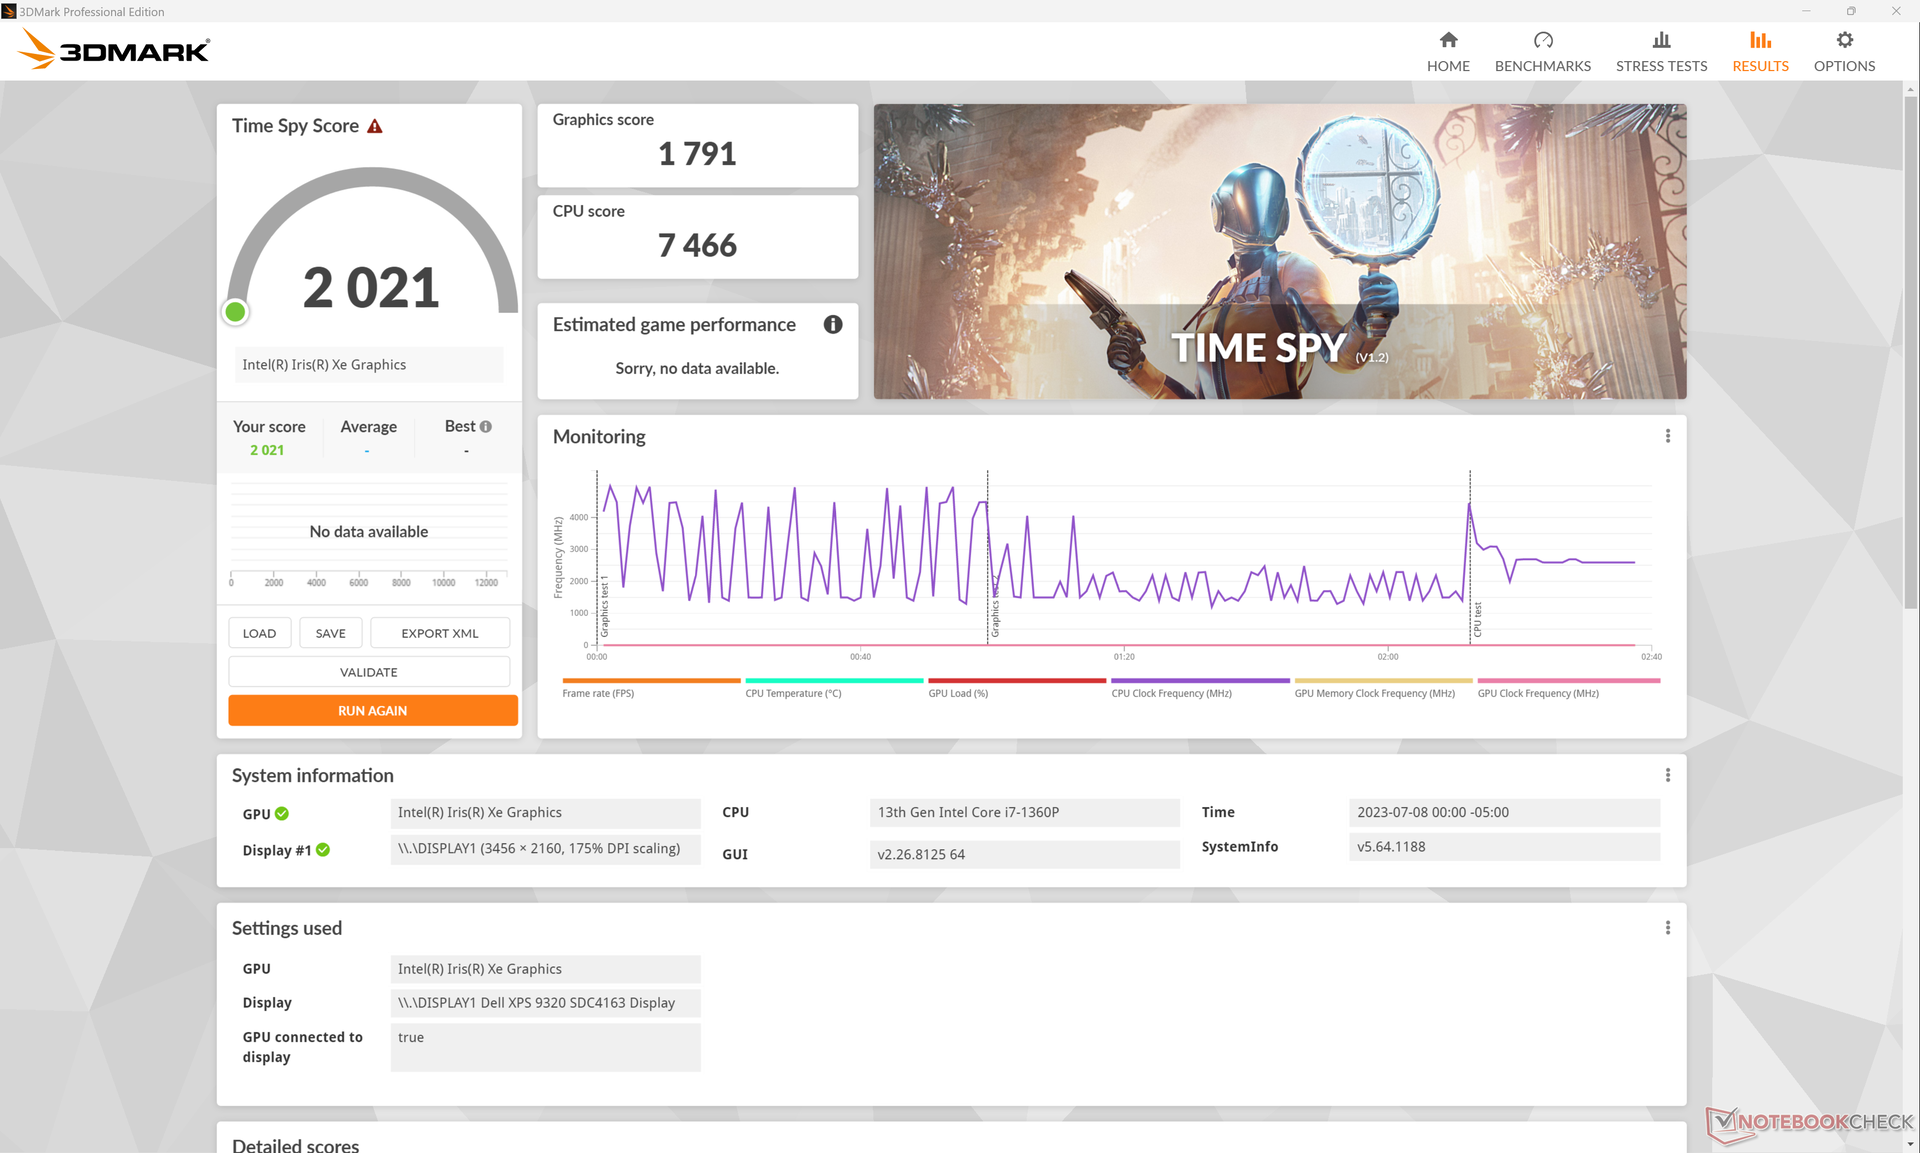
Графика Iris Xe (96 блоков) до сих пор является наиболее быстрой среди встроенных решений Intel, хотя ей уже несколько лет. В данном случае ее производительность немного выше нормы за счет более быстрой памяти, но она все еще уступает Radeon 680M и 780M.
| 3DMark Performance rating - Percent | |
| Asus Zenbook S 13 OLED | |
| Dell XPS 13 Plus 9320 Core i7-1360P | |
| Framework Laptop 13.5 13th Gen Intel | |
| Dell XPS 13 Plus 9320 i7-1280P OLED | |
| Microsoft Surface Laptop 4 13 i7 | |
| Lenovo Yoga Book 9i 2-in-1 Dual Screen | |
| HP Spectre x360 13.5 14t-ef000 | |
| Dell Inspiron 13 7306-6TYH5 | |
| Усредн. модель с Intel Iris Xe Graphics G7 96EUs | |
| Lenovo ThinkPad X13 Yoga G3 21AW003UGE | |
| HP Envy 13-ba0001ng | |
| Lenovo Yoga 6 13ALC6 | |
| HP Pavilion Aero 13 be0097nr | |
| Dell XPS 13 7390 Core i7-10710U | |
| 3DMark 11 - 1280x720 Performance GPU | |
| Asus Zenbook S 13 OLED | |
| Framework Laptop 13.5 13th Gen Intel | |
| Dell XPS 13 Plus 9320 i7-1280P OLED | |
| Microsoft Surface Laptop 4 13 i7 | |
| Dell XPS 13 Plus 9320 Core i7-1360P | |
| Lenovo Yoga Book 9i 2-in-1 Dual Screen | |
| Усредн. модель с Intel Iris Xe Graphics G7 96EUs (2867 - 7676, n=209) | |
| HP Spectre x360 13.5 14t-ef000 | |
| Dell Inspiron 13 7306-6TYH5 | |
| HP Pavilion Aero 13 be0097nr | |
| Lenovo Yoga 6 13ALC6 | |
| Lenovo ThinkPad X13 Yoga G3 21AW003UGE | |
| HP Envy 13-ba0001ng | |
| Dell XPS 13 7390 Core i7-10710U | |
| 3DMark | |
| 1920x1080 Fire Strike Graphics | |
| Asus Zenbook S 13 OLED | |
| Dell XPS 13 Plus 9320 Core i7-1360P | |
| Framework Laptop 13.5 13th Gen Intel | |
| Microsoft Surface Laptop 4 13 i7 | |
| Dell XPS 13 Plus 9320 i7-1280P OLED | |
| Lenovo Yoga Book 9i 2-in-1 Dual Screen | |
| Dell Inspiron 13 7306-6TYH5 | |
| HP Spectre x360 13.5 14t-ef000 | |
| Усредн. модель с Intel Iris Xe Graphics G7 96EUs (2286 - 6624, n=222) | |
| Lenovo ThinkPad X13 Yoga G3 21AW003UGE | |
| HP Envy 13-ba0001ng | |
| Lenovo Yoga 6 13ALC6 | |
| HP Pavilion Aero 13 be0097nr | |
| Dell XPS 13 7390 Core i7-10710U | |
| 2560x1440 Time Spy Graphics | |
| Asus Zenbook S 13 OLED | |
| Dell XPS 13 Plus 9320 Core i7-1360P | |
| Dell XPS 13 Plus 9320 i7-1280P OLED | |
| Framework Laptop 13.5 13th Gen Intel | |
| Lenovo Yoga Book 9i 2-in-1 Dual Screen | |
| Dell Inspiron 13 7306-6TYH5 | |
| HP Spectre x360 13.5 14t-ef000 | |
| Microsoft Surface Laptop 4 13 i7 | |
| Усредн. модель с Intel Iris Xe Graphics G7 96EUs (707 - 1890, n=218) | |
| Lenovo ThinkPad X13 Yoga G3 21AW003UGE | |
| HP Envy 13-ba0001ng | |
| HP Pavilion Aero 13 be0097nr | |
| Lenovo Yoga 6 13ALC6 | |
| Dell XPS 13 7390 Core i7-10710U | |
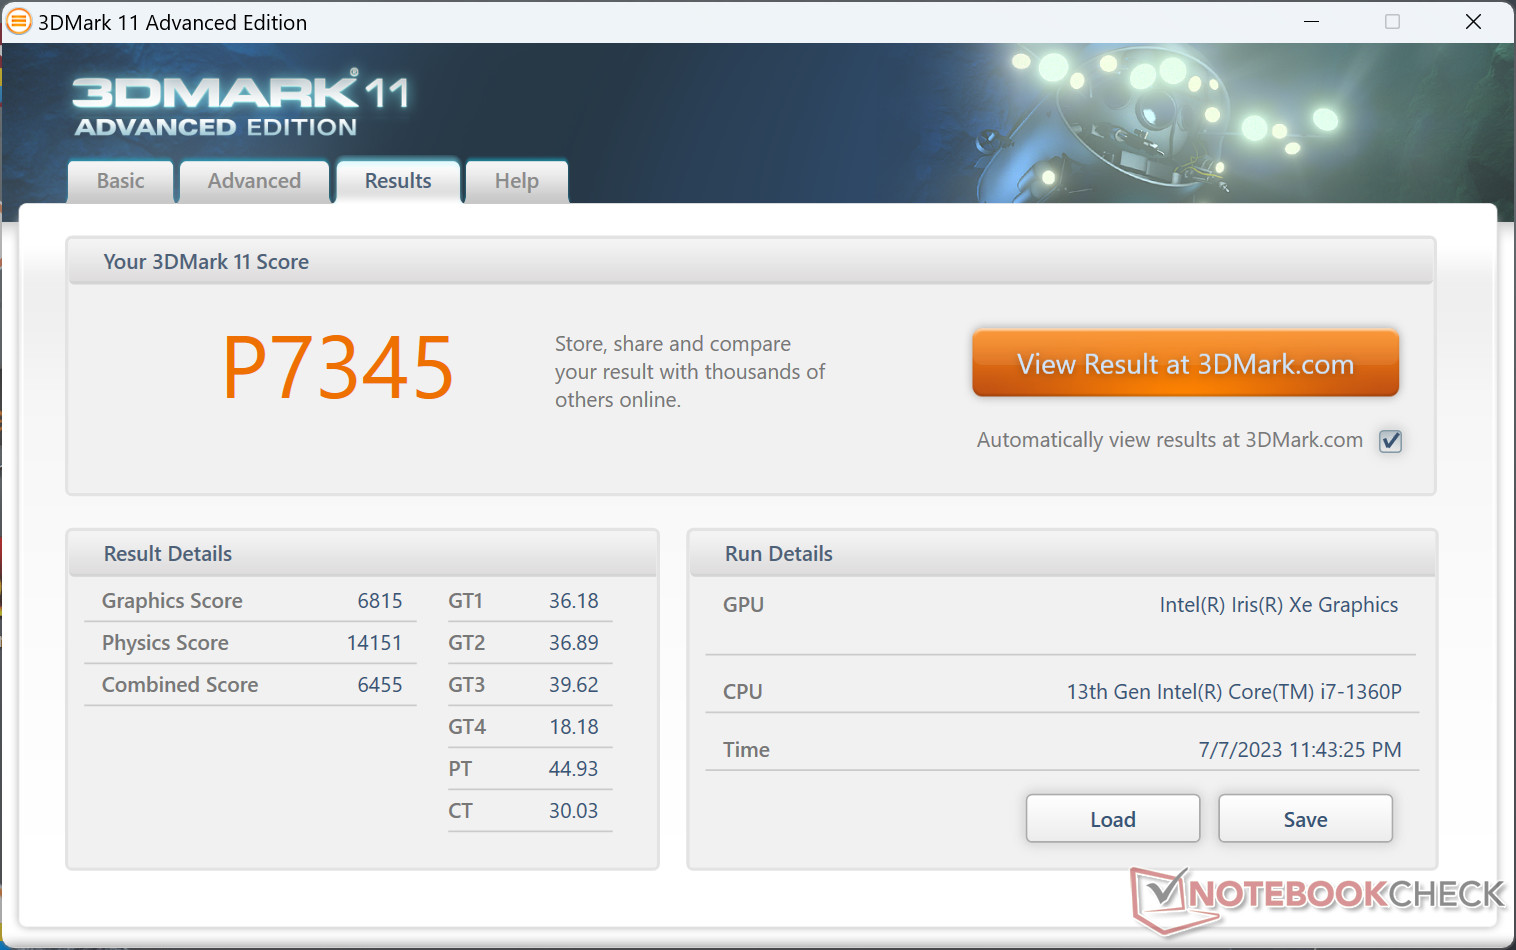
| 3DMark 11 Performance | 7345 баллов | |
| 3DMark Fire Strike Score | 5514 баллов | |
| 3DMark Time Spy Score | 2021 баллов | |
? | ||
| Blender - v3.3 Classroom CPU | |
| Lenovo ThinkPad X13 Yoga G3 21AW003UGE | |
| Lenovo Yoga Book 9i 2-in-1 Dual Screen | |
| HP Spectre x360 13.5 14t-ef000 | |
| Усредн. модель с Intel Iris Xe Graphics G7 96EUs (336 - 1259, n=109) | |
| Dell XPS 13 Plus 9320 i7-1280P OLED | |
| Dell XPS 13 Plus 9320 Core i7-1360P | |
| Framework Laptop 13.5 13th Gen Intel | |
* ... меньше = лучше
| Tiny Tina's Wonderlands | |
| 1920x1080 Low Preset (DX12) | |
| Framework Laptop 13.5 13th Gen Intel | |
| Усредн. модель с Intel Iris Xe Graphics G7 96EUs (22.3 - 53, n=32) | |
| Dell XPS 13 Plus 9320 Core i7-1360P | |
| 1920x1080 Medium Preset (DX12) | |
| Framework Laptop 13.5 13th Gen Intel | |
| Dell XPS 13 Plus 9320 Core i7-1360P | |
| Усредн. модель с Intel Iris Xe Graphics G7 96EUs (17 - 40.1, n=30) | |
| 1920x1080 High Preset (DX12) | |
| Framework Laptop 13.5 13th Gen Intel | |
| Dell XPS 13 Plus 9320 Core i7-1360P | |
| Усредн. модель с Intel Iris Xe Graphics G7 96EUs (10.6 - 24.1, n=29) | |
| 1920x1080 Badass Preset (DX12) | |
| Framework Laptop 13.5 13th Gen Intel | |
| Dell XPS 13 Plus 9320 Core i7-1360P | |
| Усредн. модель с Intel Iris Xe Graphics G7 96EUs (8.4 - 18.4, n=26) | |
| 1280x720 Lowest Preset (DX12) | |
| Dell XPS 13 Plus 9320 Core i7-1360P | |
| Усредн. модель с Intel Iris Xe Graphics G7 96EUs (25.9 - 67.3, n=32) | |
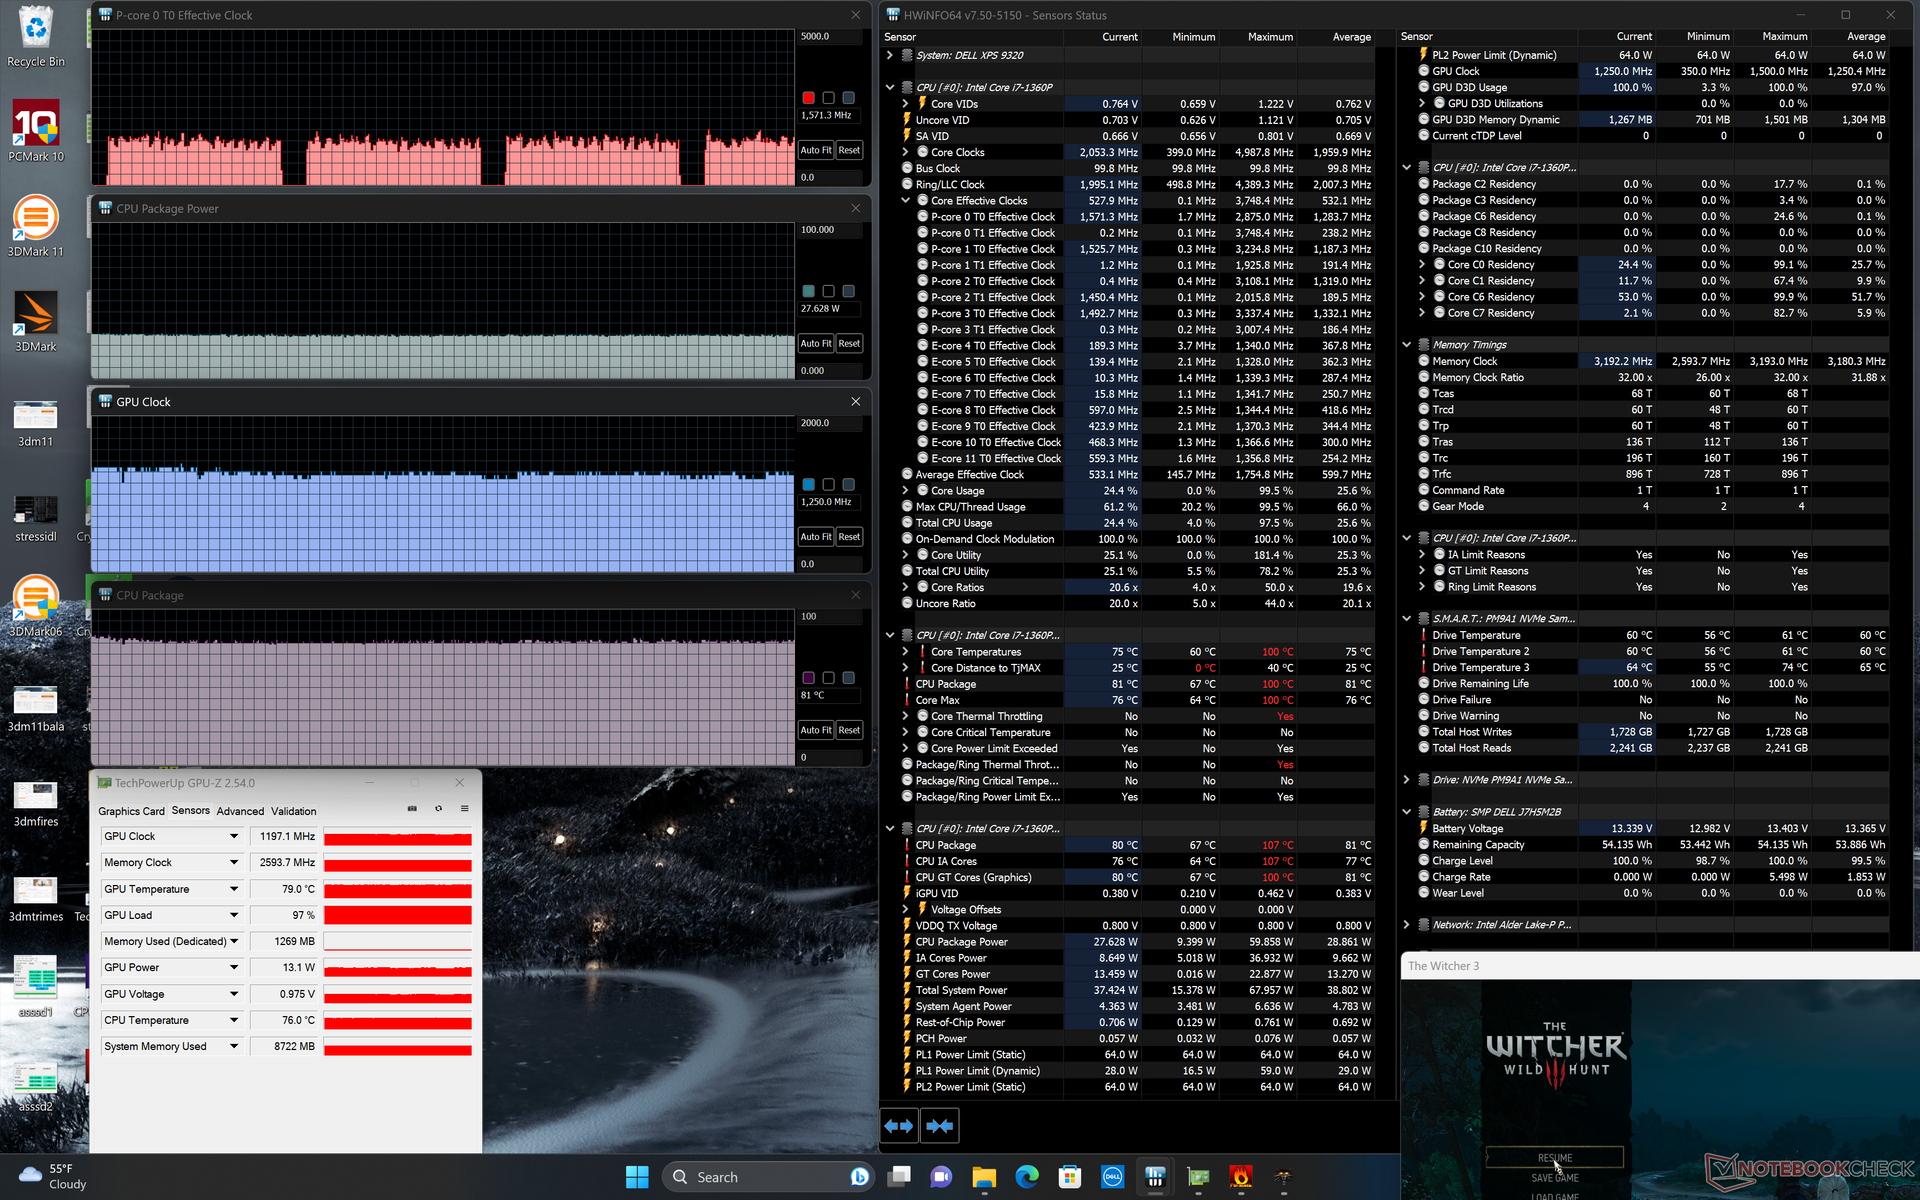
Частота кадров, Witcher 3
| мин. | сред. | выс. | макс. | QHD | |
|---|---|---|---|---|---|
| GTA V (2015) | 130.6 | 105.3 | 26.6 | 11.6 | 7.35 |
| The Witcher 3 (2015) | 86.7 | 56.1 | 33.9 | 15.4 | |
| Dota 2 Reborn (2015) | 125.6 | 97.7 | 68.7 | 61.6 | |
| Final Fantasy XV Benchmark (2018) | 44.5 | 25.2 | 17.5 | ||
| X-Plane 11.11 (2018) | 42.7 | 36.2 | 33.2 | ||
| Strange Brigade (2018) | 93.9 | 43.8 | 35.4 | 27.5 | |
| Cyberpunk 2077 1.6 (2022) | 20.8 | 17.3 | 13.6 | 11 | |
| Tiny Tina's Wonderlands (2022) | 29.6 | 23.7 | 15.2 | 12.2 | |
| F1 22 (2022) | 47.5 | 42.8 | 31.9 | 24.1 |
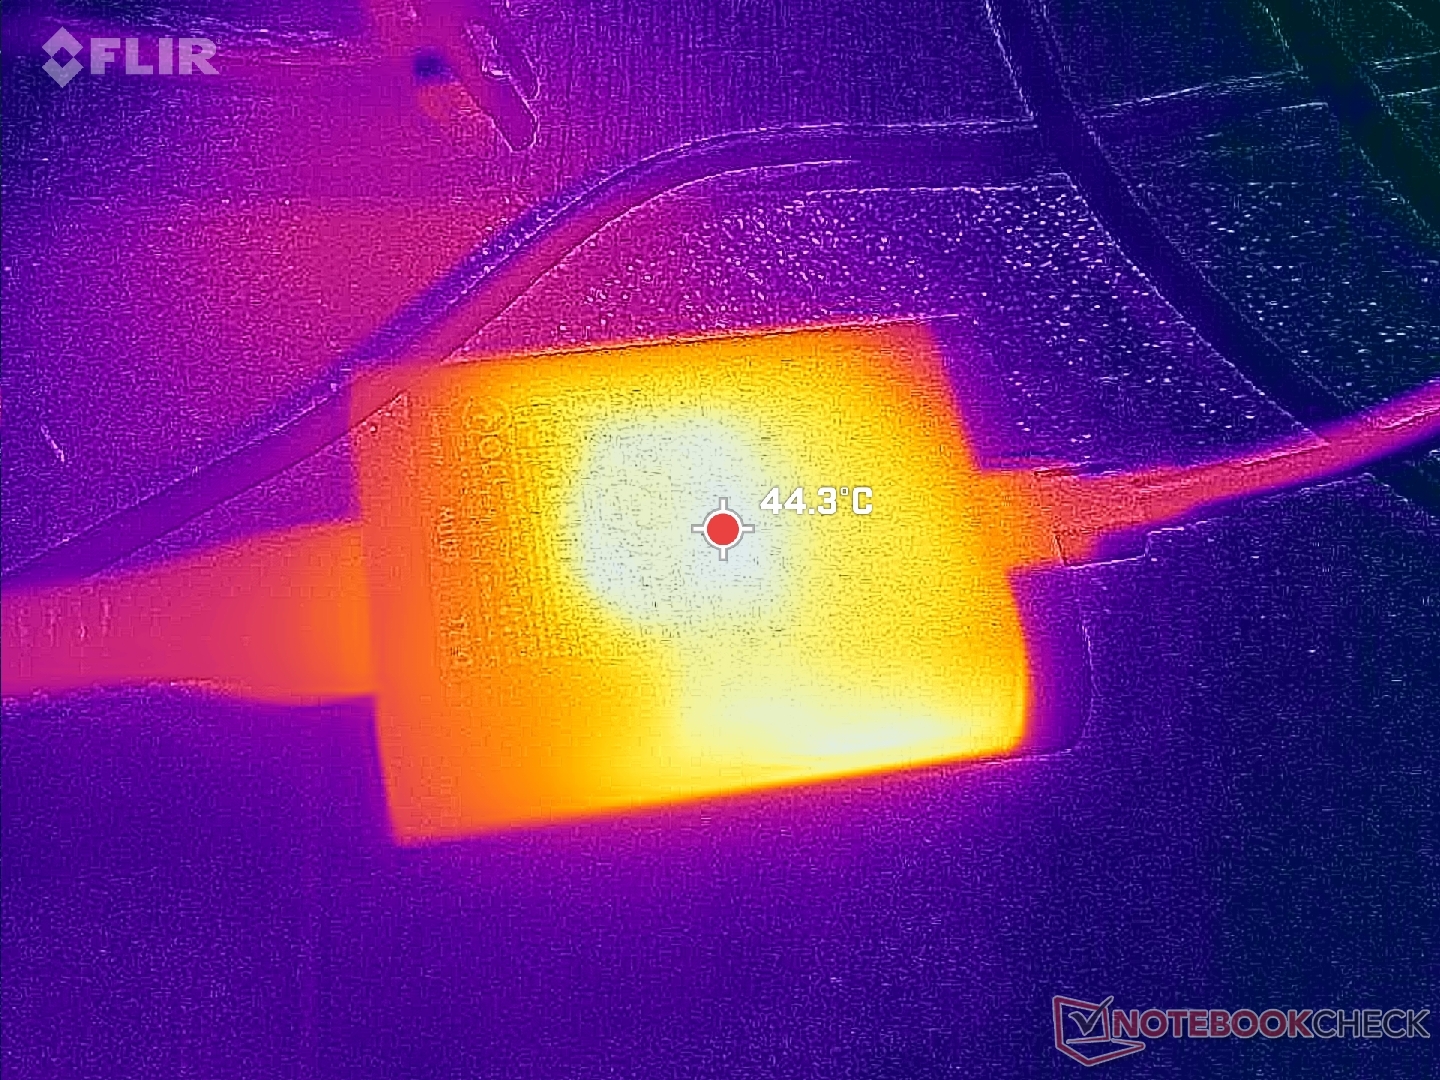
Температурные и акустические показатели
Система охлаждения
Система охлаждения никак не изменилась у нового поколения модели, однако мы заметили едва различимый свист дросселей у нашего образца, который слышен, если поднести ухо к клавиатуре. Вентиляторы обычно либо отключены, либо работают на минимальной скорости и их практически не слышно.
Уровень шума
| Ожидание |
| 24 / 24 / 24.4 дБ |
| Нагрузка |
| 37 / 42 дБ |
 | ||
30 dB бесшумно 40 dB(A) различимо 50 dB(A) громко |
||
min: | ||
| Dell XPS 13 Plus 9320 Core i7-1360P Iris Xe G7 96EUs, i7-1360P, Samsung PM9A1 MZVL2512HCJQ | Dell XPS 13 Plus 9320 i7-1280P OLED Iris Xe G7 96EUs, i7-1280P, WDC PC SN810 512GB | Dell XPS 13 7390 Core i7-10710U UHD Graphics 620, i7-10710U, SK Hynix PC601 NVMe 512 GB | Framework Laptop 13.5 13th Gen Intel Iris Xe G7 96EUs, i7-1370P, WD PC SN740 SDDPNQD-1T00 | Lenovo ThinkPad X13 Yoga G3 21AW003UGE Iris Xe G7 96EUs, i7-1265U, Samsung PM9A1 MZVL2512HCJQ | HP Spectre x360 13.5 14t-ef000 Iris Xe G7 96EUs, i7-1255U, Micron 3400 1TB MTFDKBA1T0TFH | |
|---|---|---|---|---|---|---|
| Уровень шума | 3% | -12% | -6% | -2% | 7% | |
| в выкл. виде (фон) * (dB) | 23.7 | 23.4 1% | 28 -18% | 23.2 2% | 23.22 2% | 23.5 1% |
| Мин. в простое * (dB) | 24 | 23.4 2% | 28 -17% | 23.2 3% | 23.2 3% | 23.5 2% |
| В простое, сред. * (dB) | 24 | 23.4 2% | 28 -17% | 23.2 3% | 23.2 3% | 23.5 2% |
| В простое, макс. * (dB) | 24.4 | 23.4 4% | 28 -15% | 23.2 5% | 28.6 -17% | 23.5 4% |
| Нагрузка, сред. * (dB) | 37 | 35 5% | 33.7 9% | 45.3 -22% | 39.8 -8% | 27 27% |
| Witcher 3 ultra * (dB) | 42.1 | 41.6 1% | 47.9 -14% | 41.8 1% | 36.2 14% | |
| Нагрузка, макс. * (dB) | 42 | 39.9 5% | 46.5 -11% | 49.2 -17% | 40.6 3% | 42.4 -1% |
* ... меньше = лучше
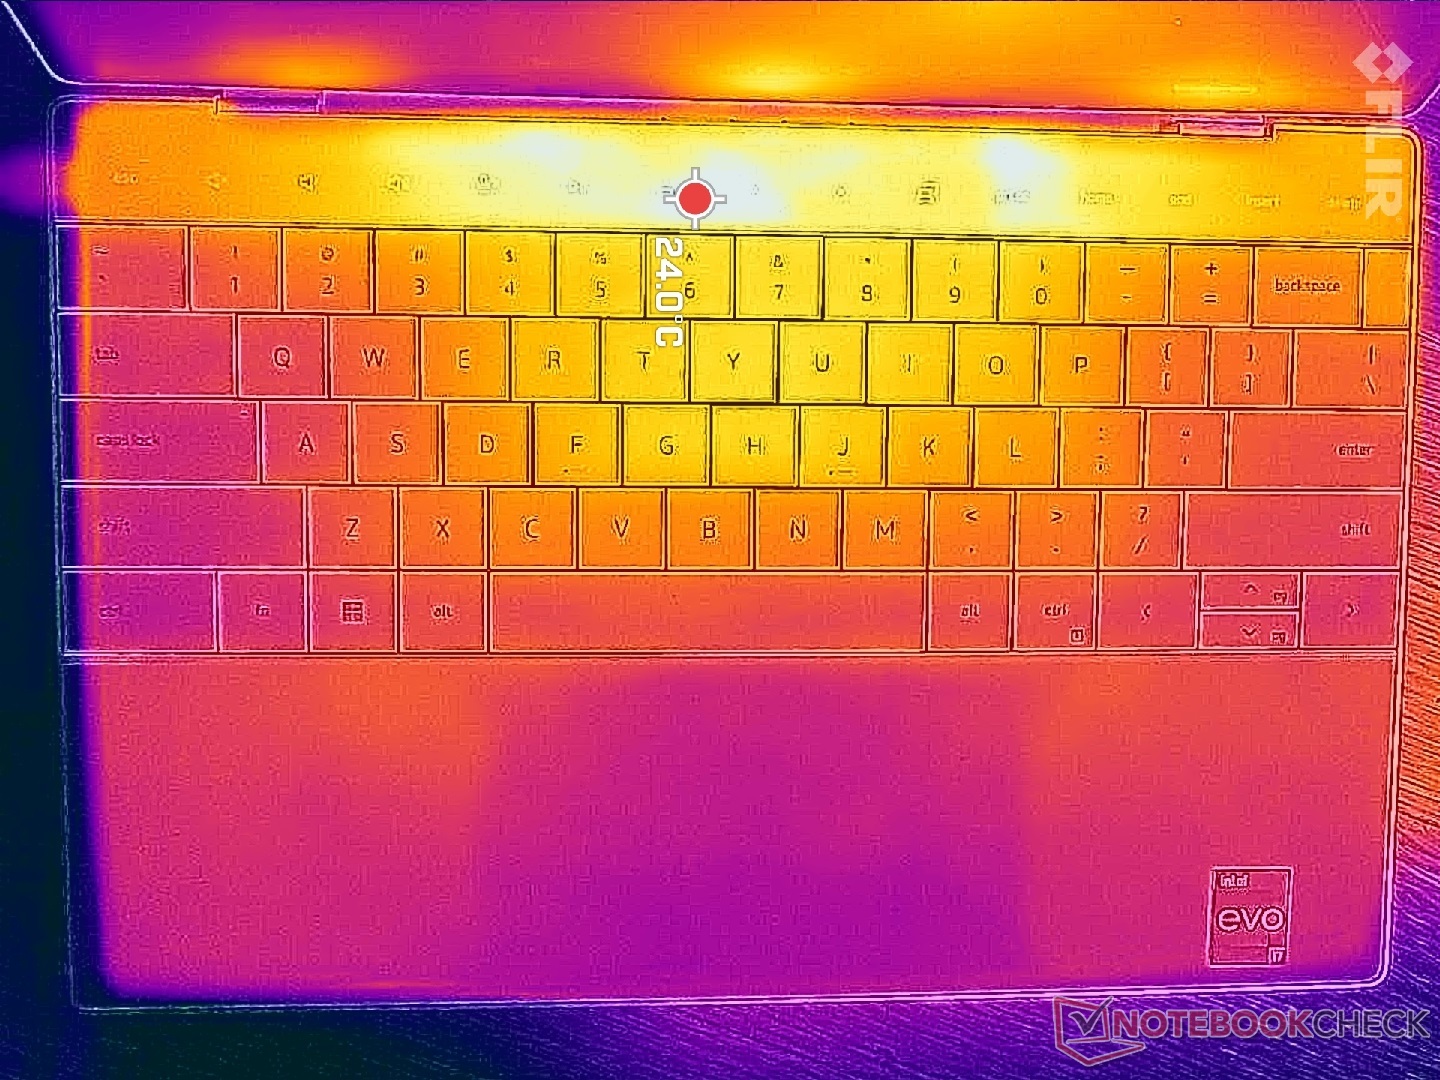
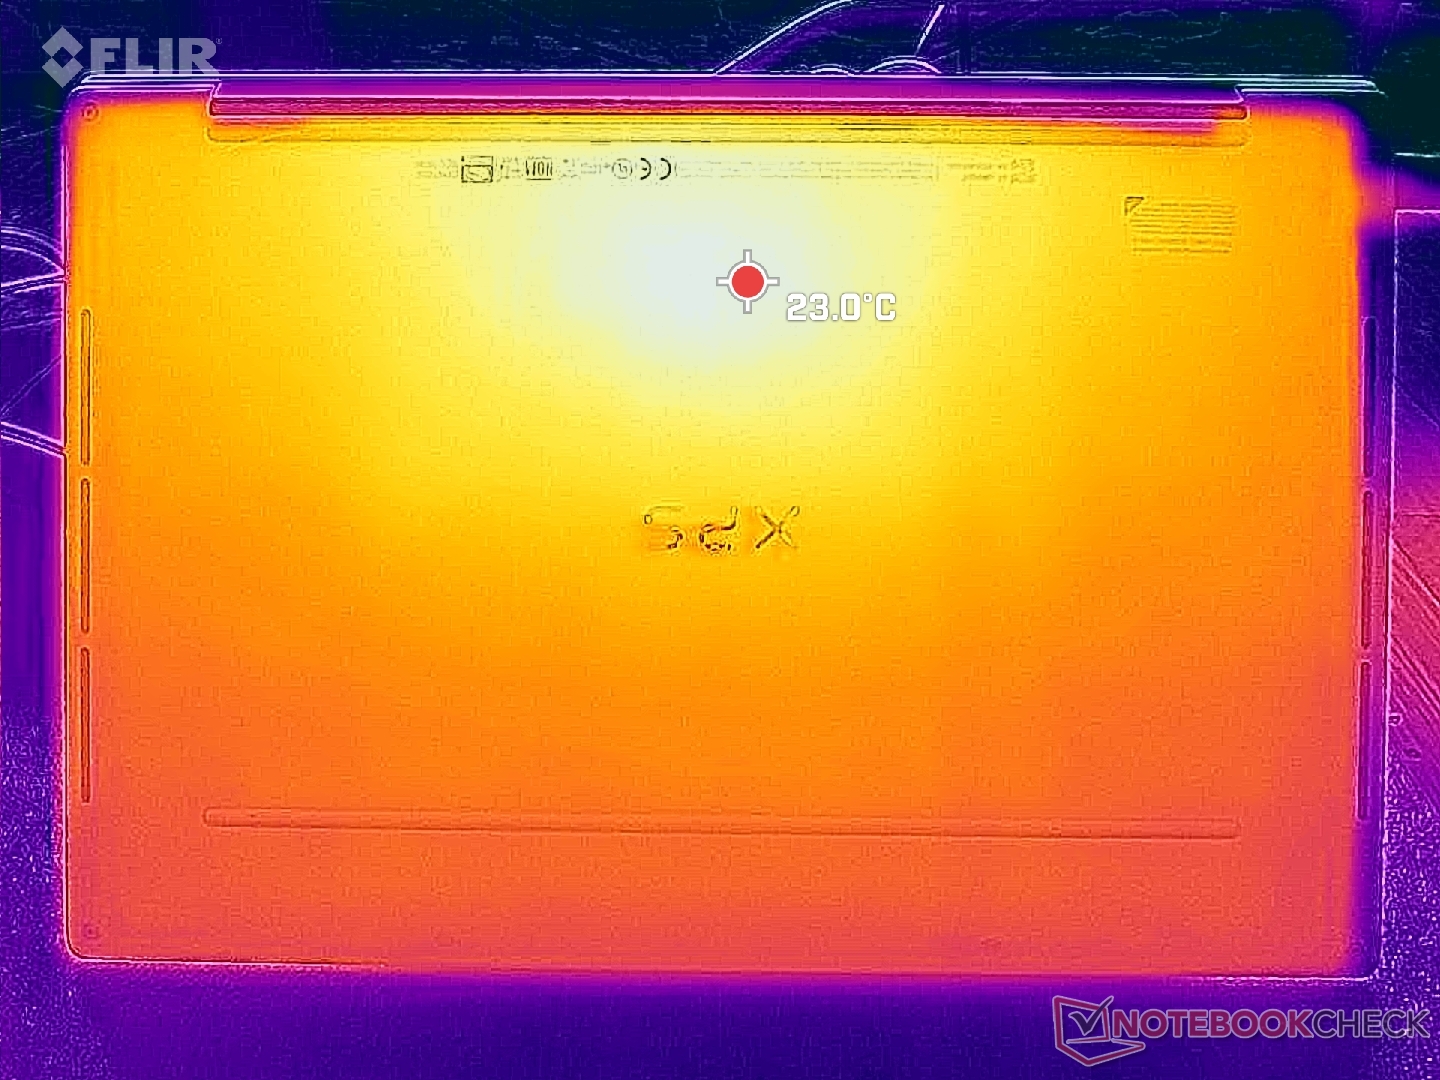
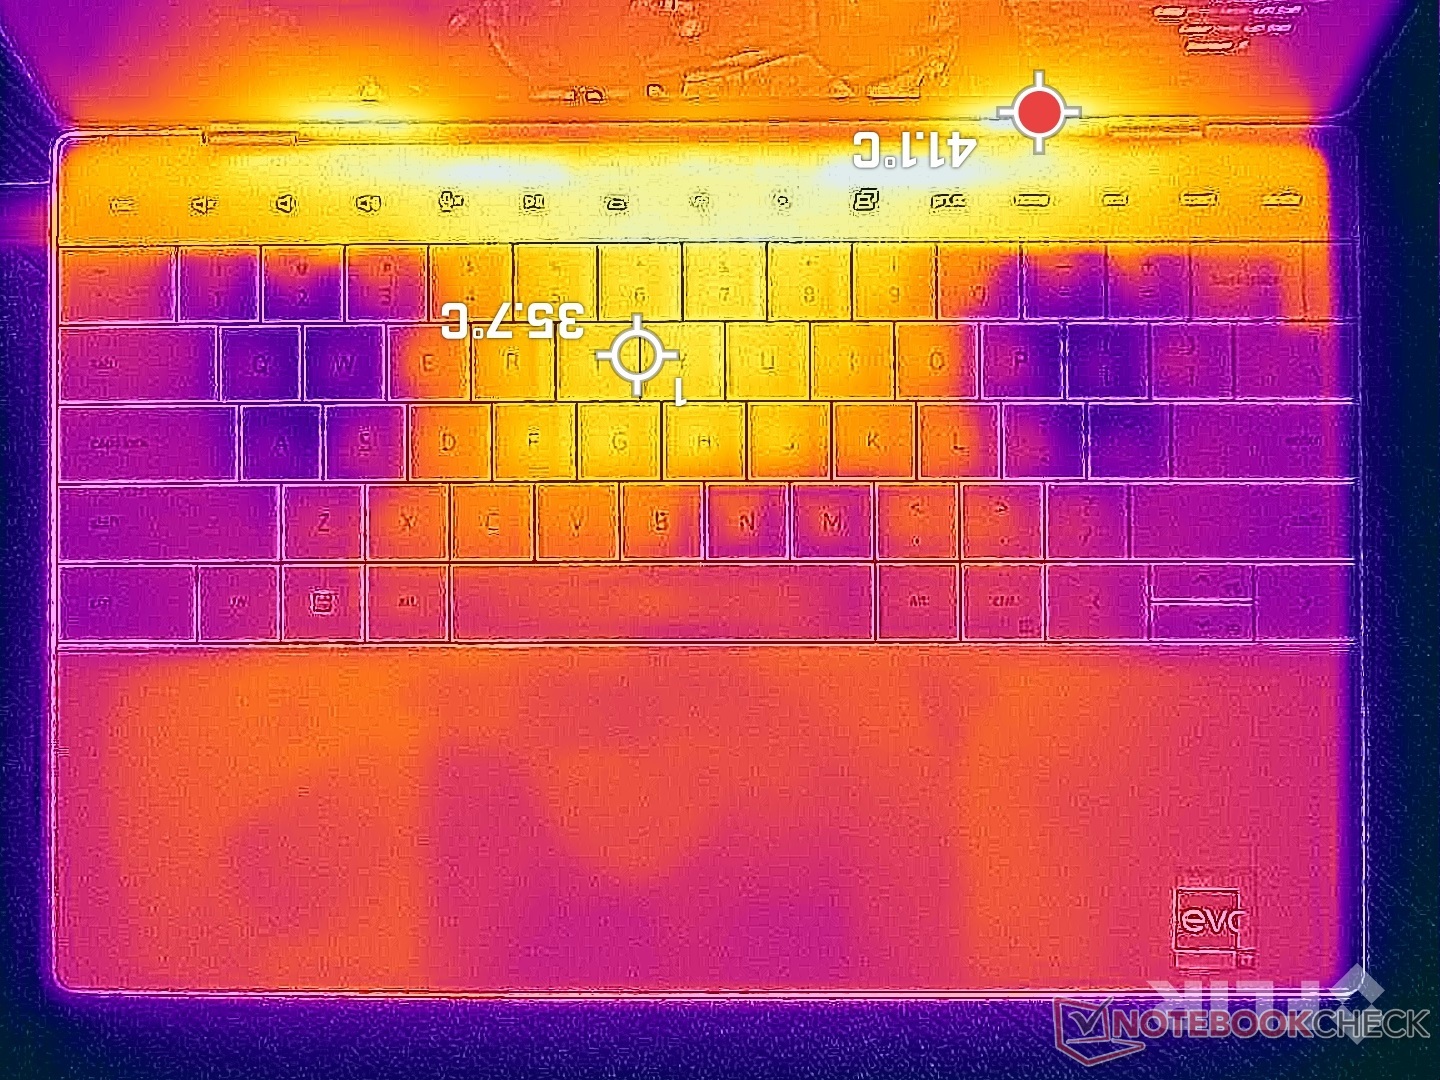
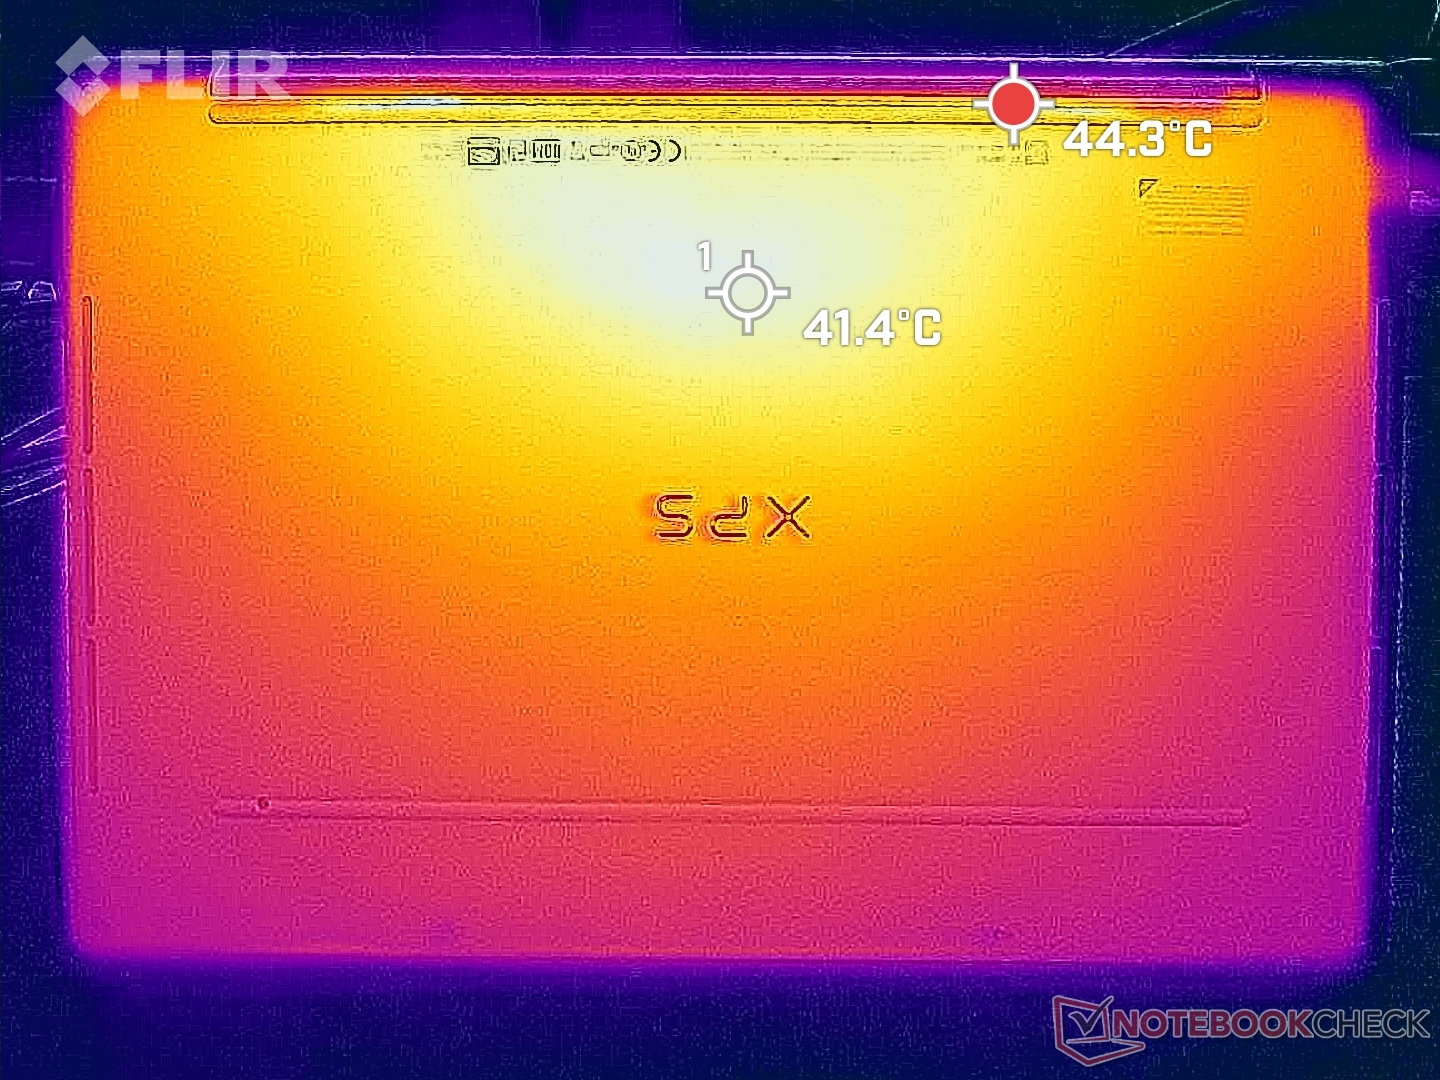
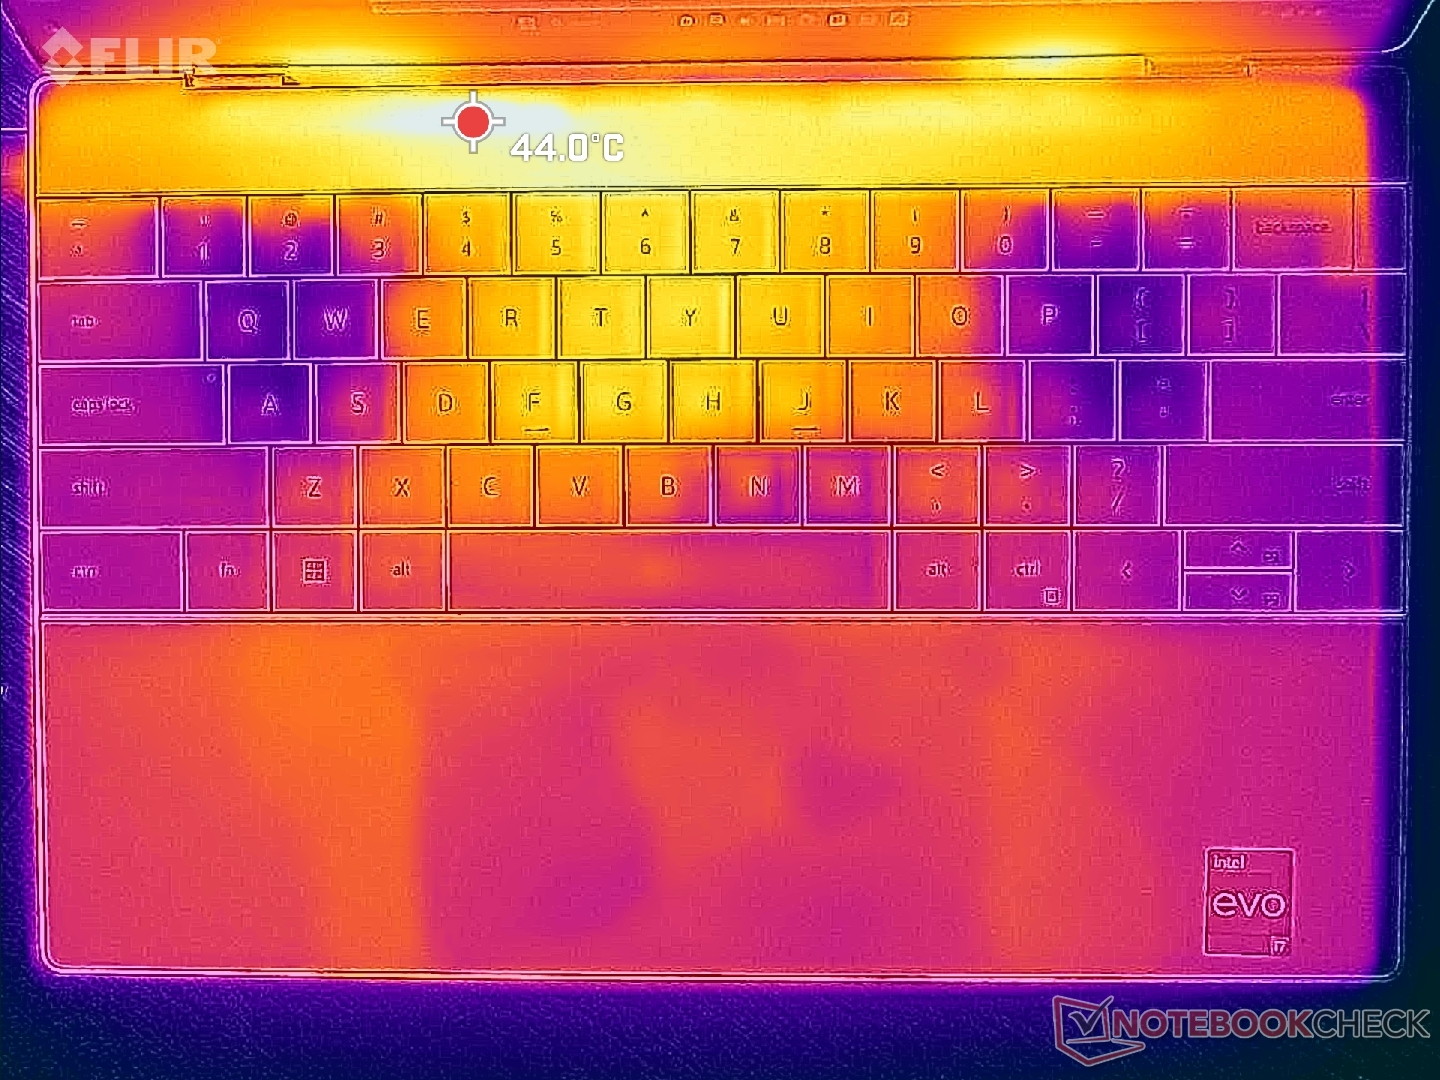
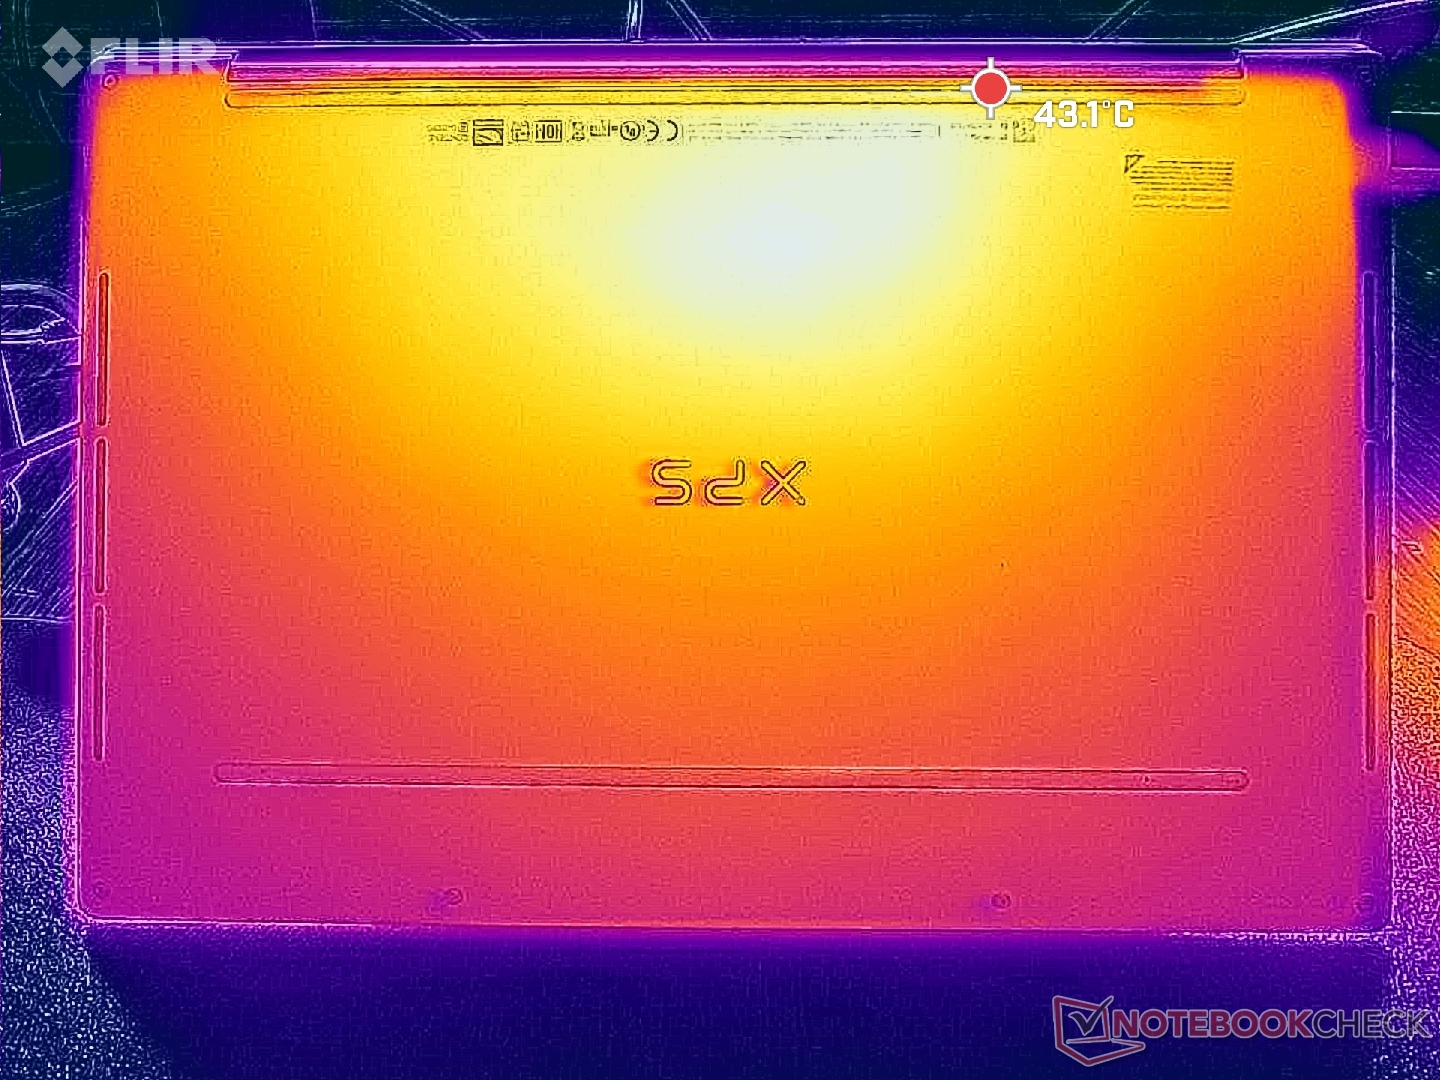
Нагрев
Нагрев корпуса может быть высоким за счет тонкого корпуса с минимумом вентиляционных прорезей. Температура в наиболее горячих областях достигает 45 градусов Цельсия.
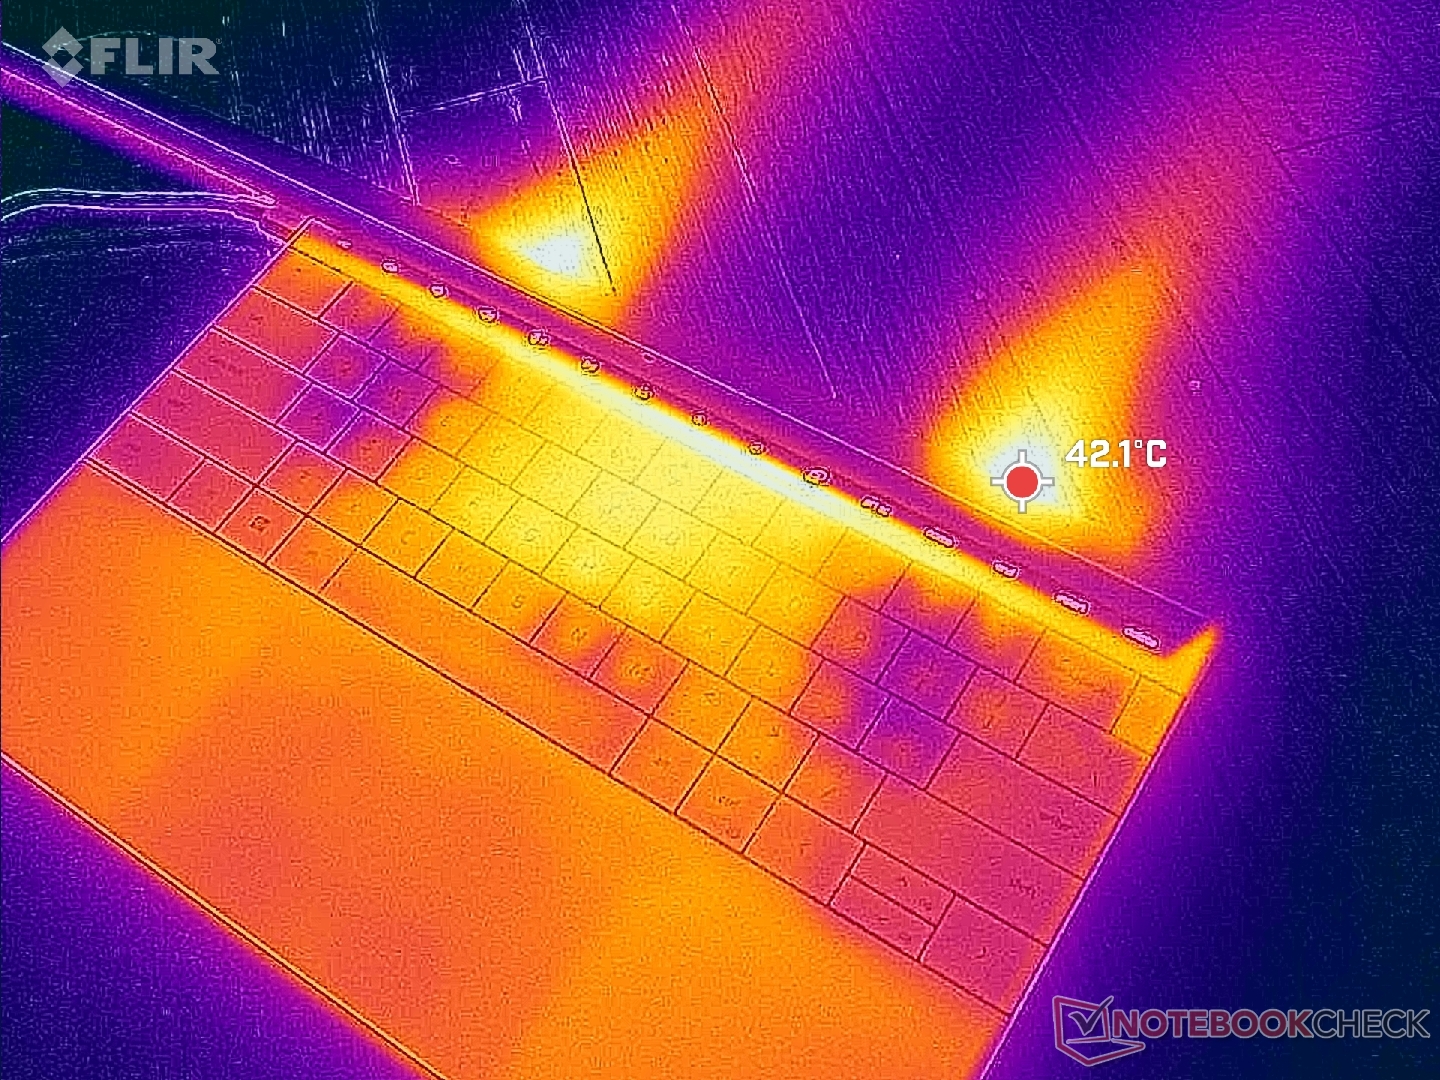
(±) Макс. температура верха корпуса составила 43.8 град. Цельсия. Типичное значение для устройств этого же класса (Subnotebook) = 35.9 градуса (-ов) при минимуме в 21.4 град. и максимуме в 59 град.
(±) Макс. температура дна составила 44.4 град. Цельсия. Типичное значение для устройств этого же класса = 39.2 градуса (-ов).
(+) При отсутствии вычислительной нагрузки верх корпуса нагревается в среднем до 22.4 град. Типичное значение для устройств этого же класса = 30.8 градуса (-ов).
(±) При игре в Ведьмак 3 верх корпуса нагревается в среднем до 32.9 град. Типичное значение для устройств этого же класса = 30.8 градуса (-ов).
(+) Палуба на ощупь: Умеренно тепло (32.6 град. Цельсия).
(-) Средняя температура палубы у похожих моделей составила 28.2 град. Цельсия, это -4.4 градуса (-ов) разницы.
| Dell XPS 13 Plus 9320 Core i7-1360P Intel Core i7-1360P, Intel Iris Xe Graphics G7 96EUs | Dell XPS 13 Plus 9320 i5-1240p Intel Core i5-1240P, Intel Iris Xe Graphics G7 80EUs | Dell XPS 13 7390 Core i7-10710U Intel Core i7-10710U, Intel UHD Graphics 620 | Framework Laptop 13.5 13th Gen Intel Intel Core i7-1370P, Intel Iris Xe Graphics G7 96EUs | Lenovo ThinkPad X13 Yoga G3 21AW003UGE Intel Core i7-1265U, Intel Iris Xe Graphics G7 96EUs | HP Spectre x360 13.5 14t-ef000 Intel Core i7-1255U, Intel Iris Xe Graphics G7 96EUs | |
|---|---|---|---|---|---|---|
| Нагрев | -41% | -13% | 1% | -25% | 14% | |
| Нагрузка, макс. сверху * (°C) | 43.8 | 47.6 -9% | 44.6 -2% | 38.2 13% | 52.2 -19% | 36.4 17% |
| Нагрузка, макс. на дне * (°C) | 44.4 | 57 -28% | 49.2 -11% | 41.4 7% | 50.2 -13% | 37 17% |
| В простое сверху * (°C) | 24 | 38.8 -62% | 28.2 -18% | 25.8 -8% | 32 -33% | 20.8 13% |
| В простое на дне * (°C) | 25.2 | 41 -63% | 30.2 -20% | 27.6 -10% | 33.6 -33% | 22.6 10% |
* ... меньше = лучше
Стресс-тест
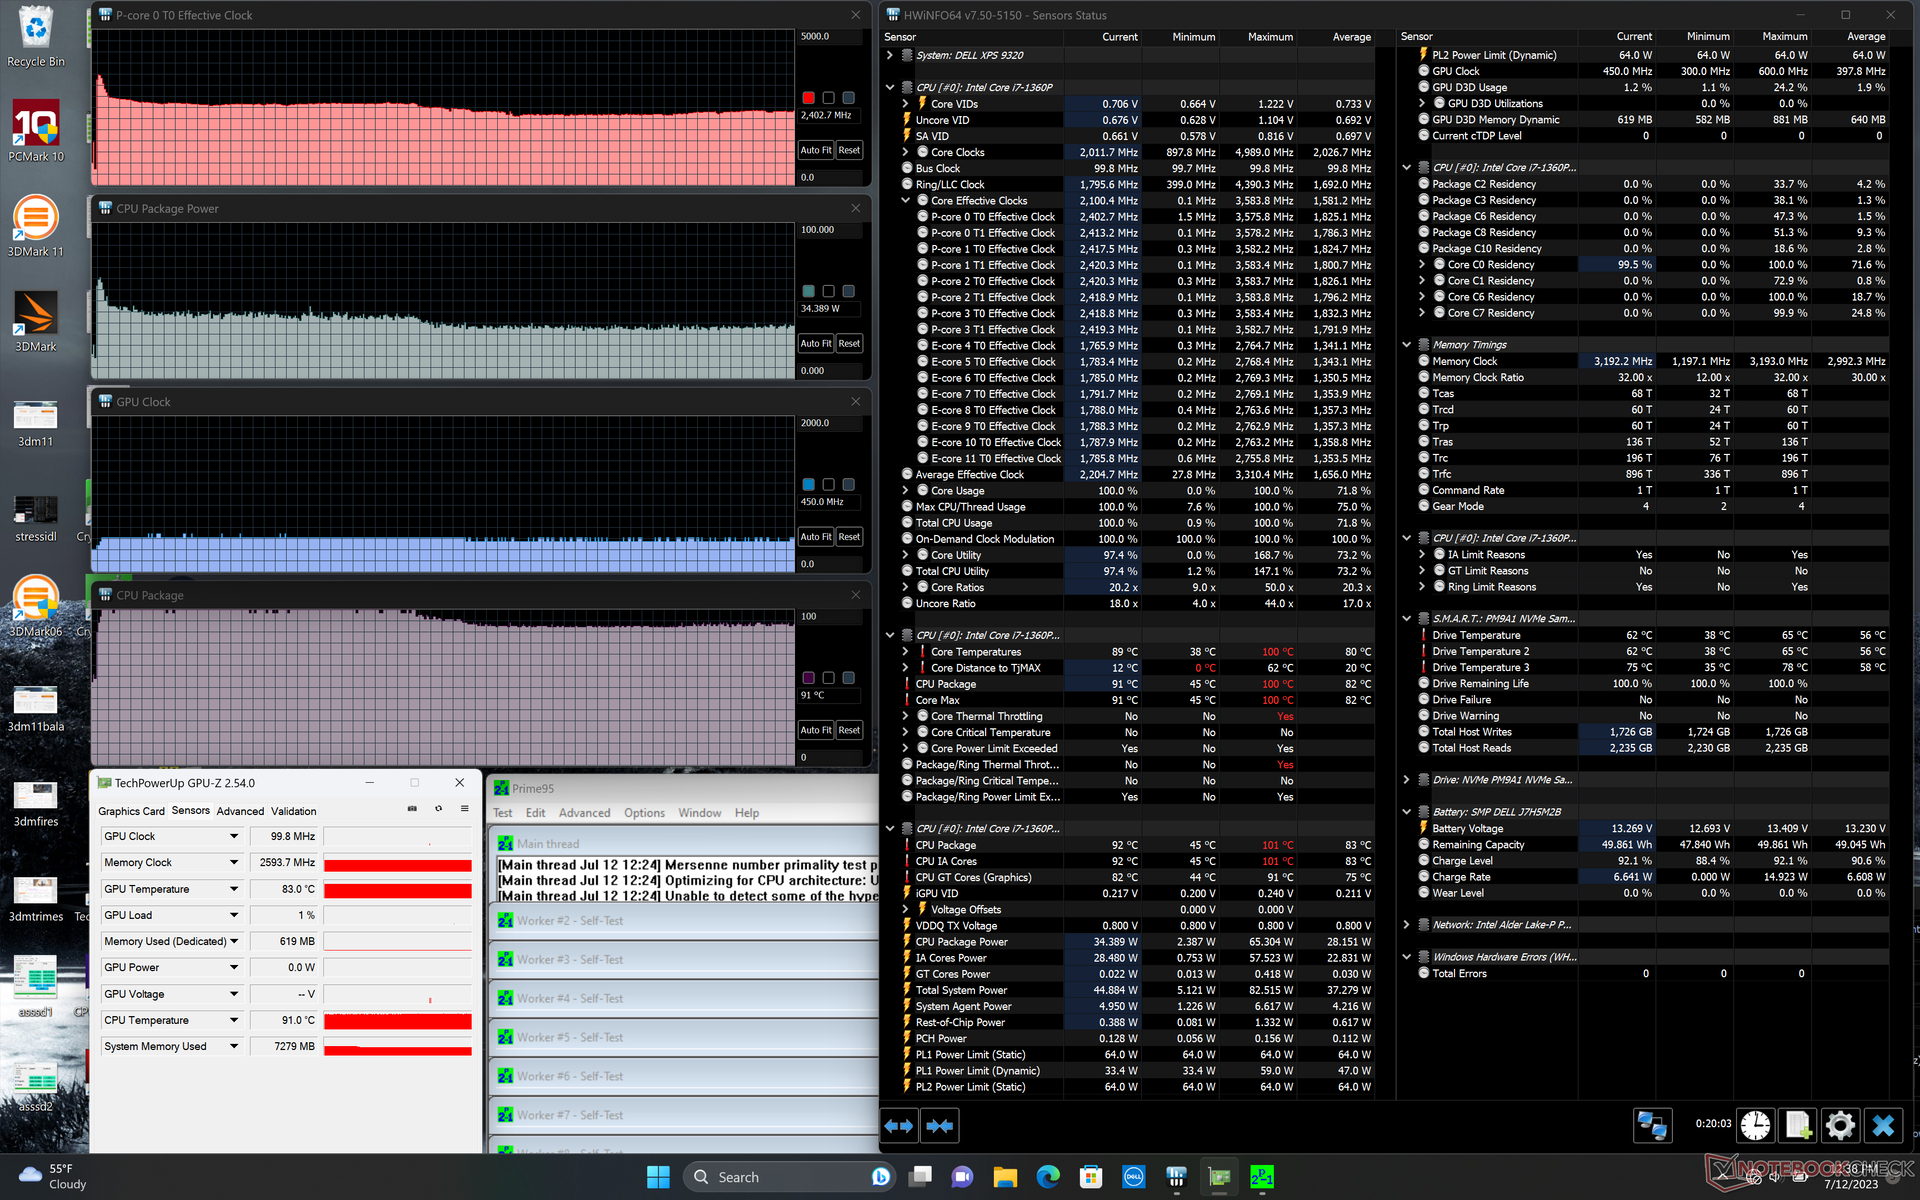
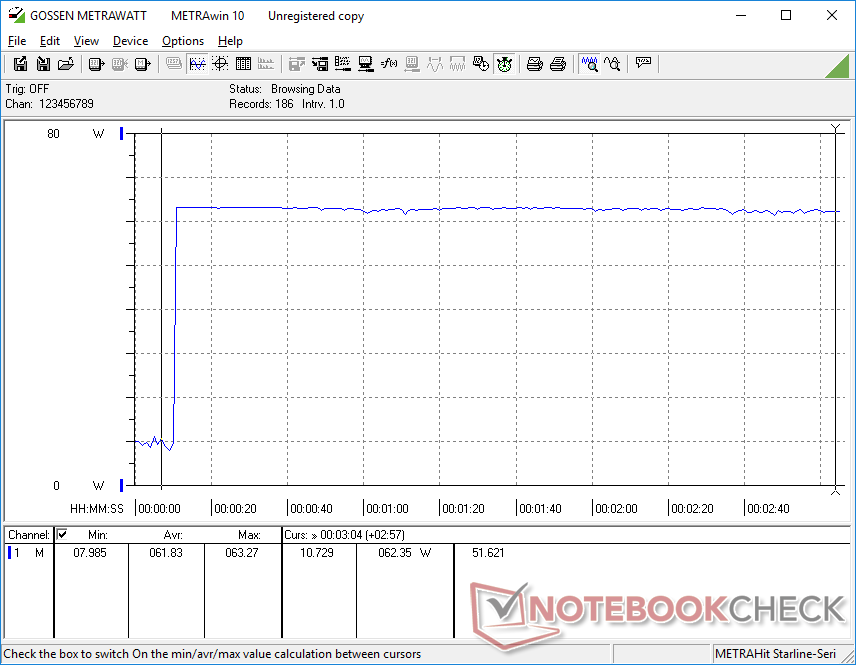
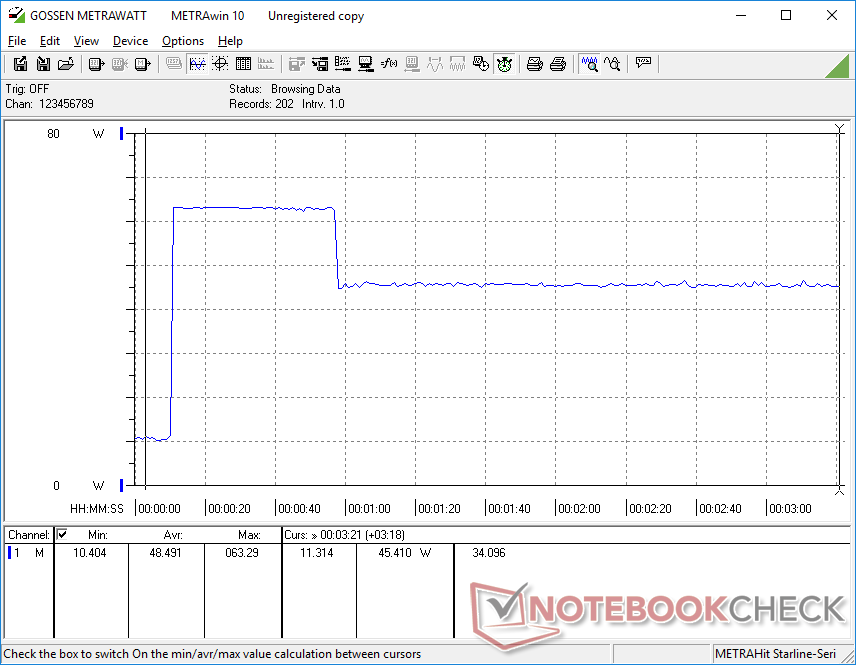
В Prime95 уровень PL2 и PL1 у Core i7-1360P точно такой же, как у Core i7-1280P в предыдущем XPS 13 Plus: 64 и 34 Вт соответственно. Частота достигает 3.6 ГГц на протяжении первых секунд теста, а затем стабилизируется на 2.3 ГГц при температуре 90 градусов Цельсия. Сильный нагрев процессора и приводит к заметному нагреву корпуса.
При питании от батареи производительность процессора не снижается. Оценка в 3DMark 11 остается практически неизменной при отключении адаптера питания.
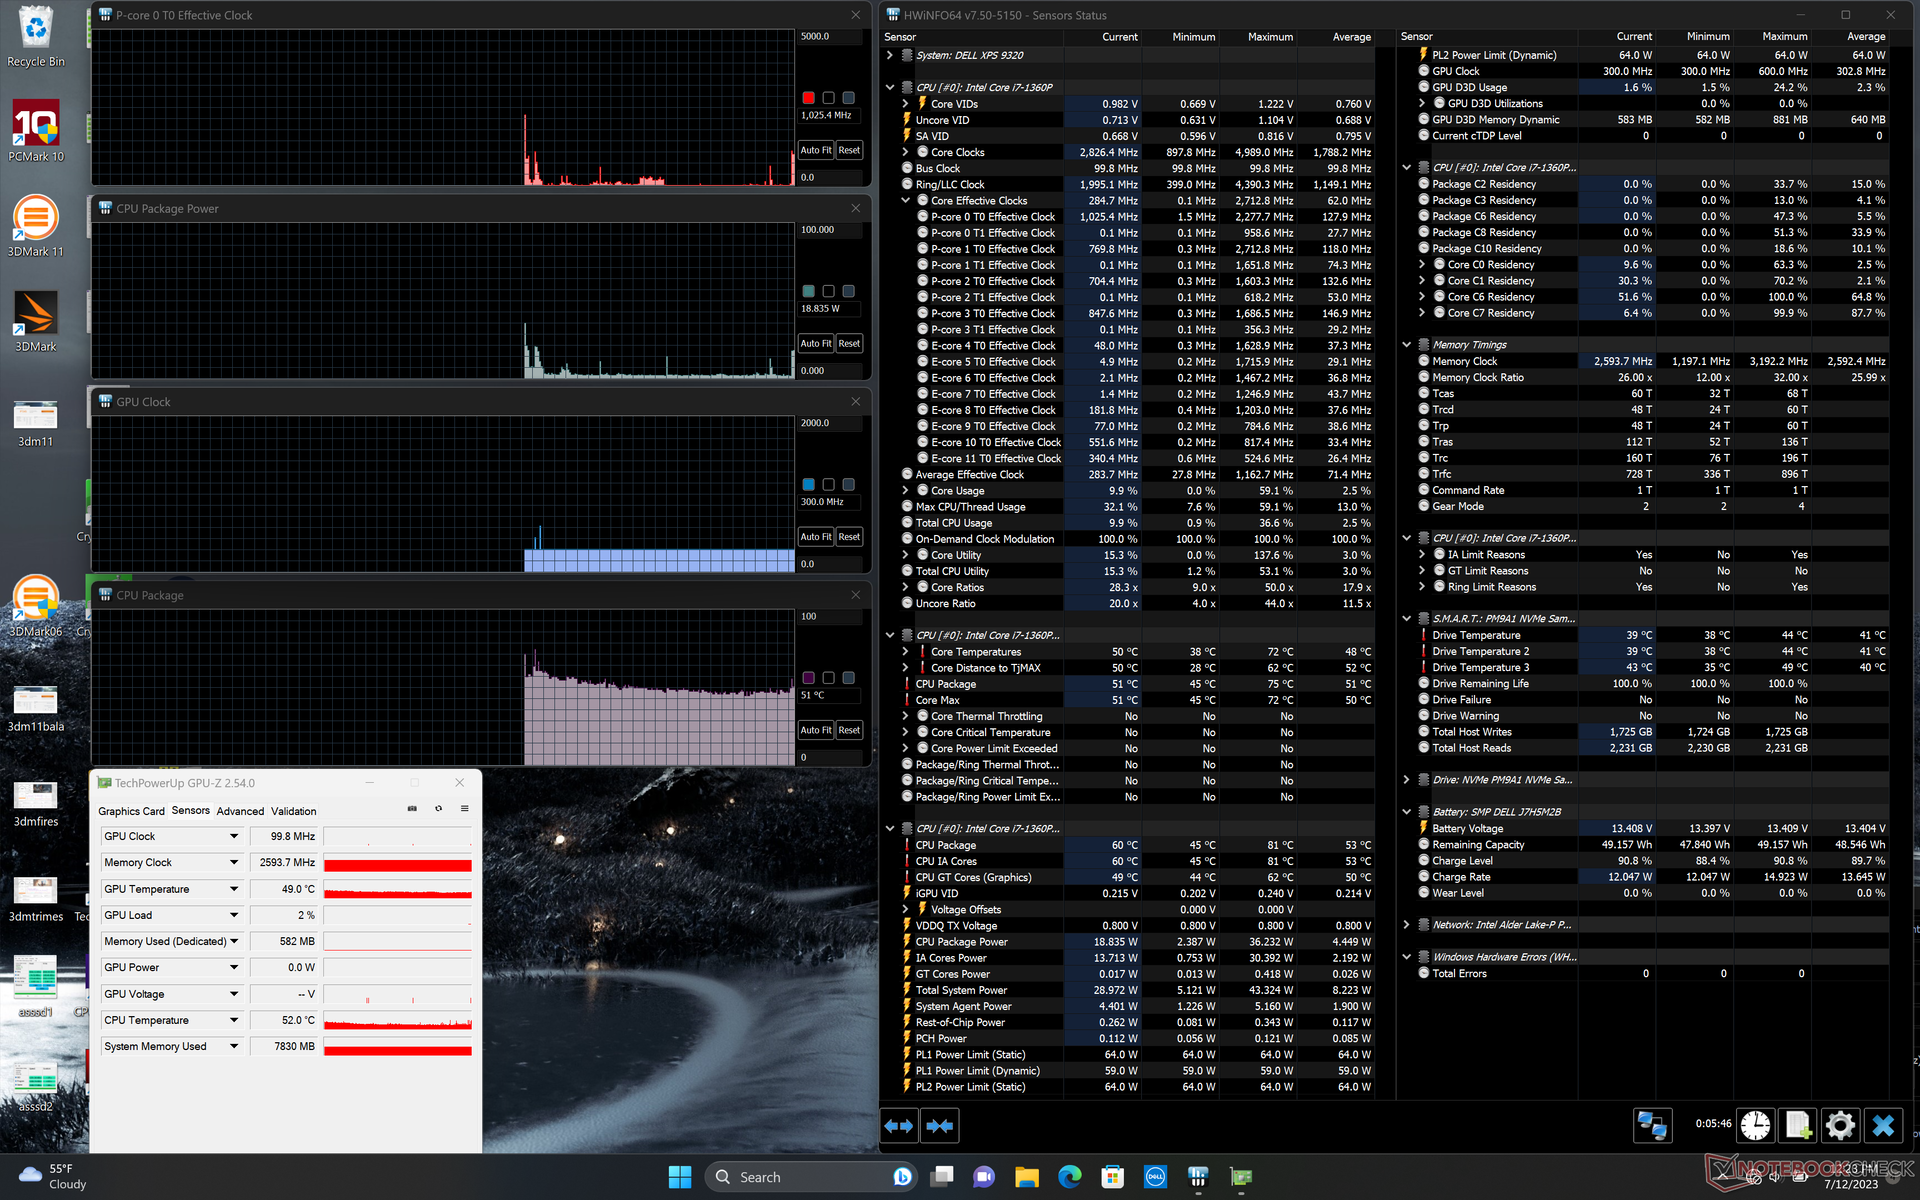
| Частота ЦП (ГГц) | Частота ГП (МГц) | Средняя температура ЦП (°C) | |
| Без нагрузки | -- | -- | 51 |
| Prime95 | 2.4 | -- | 91 |
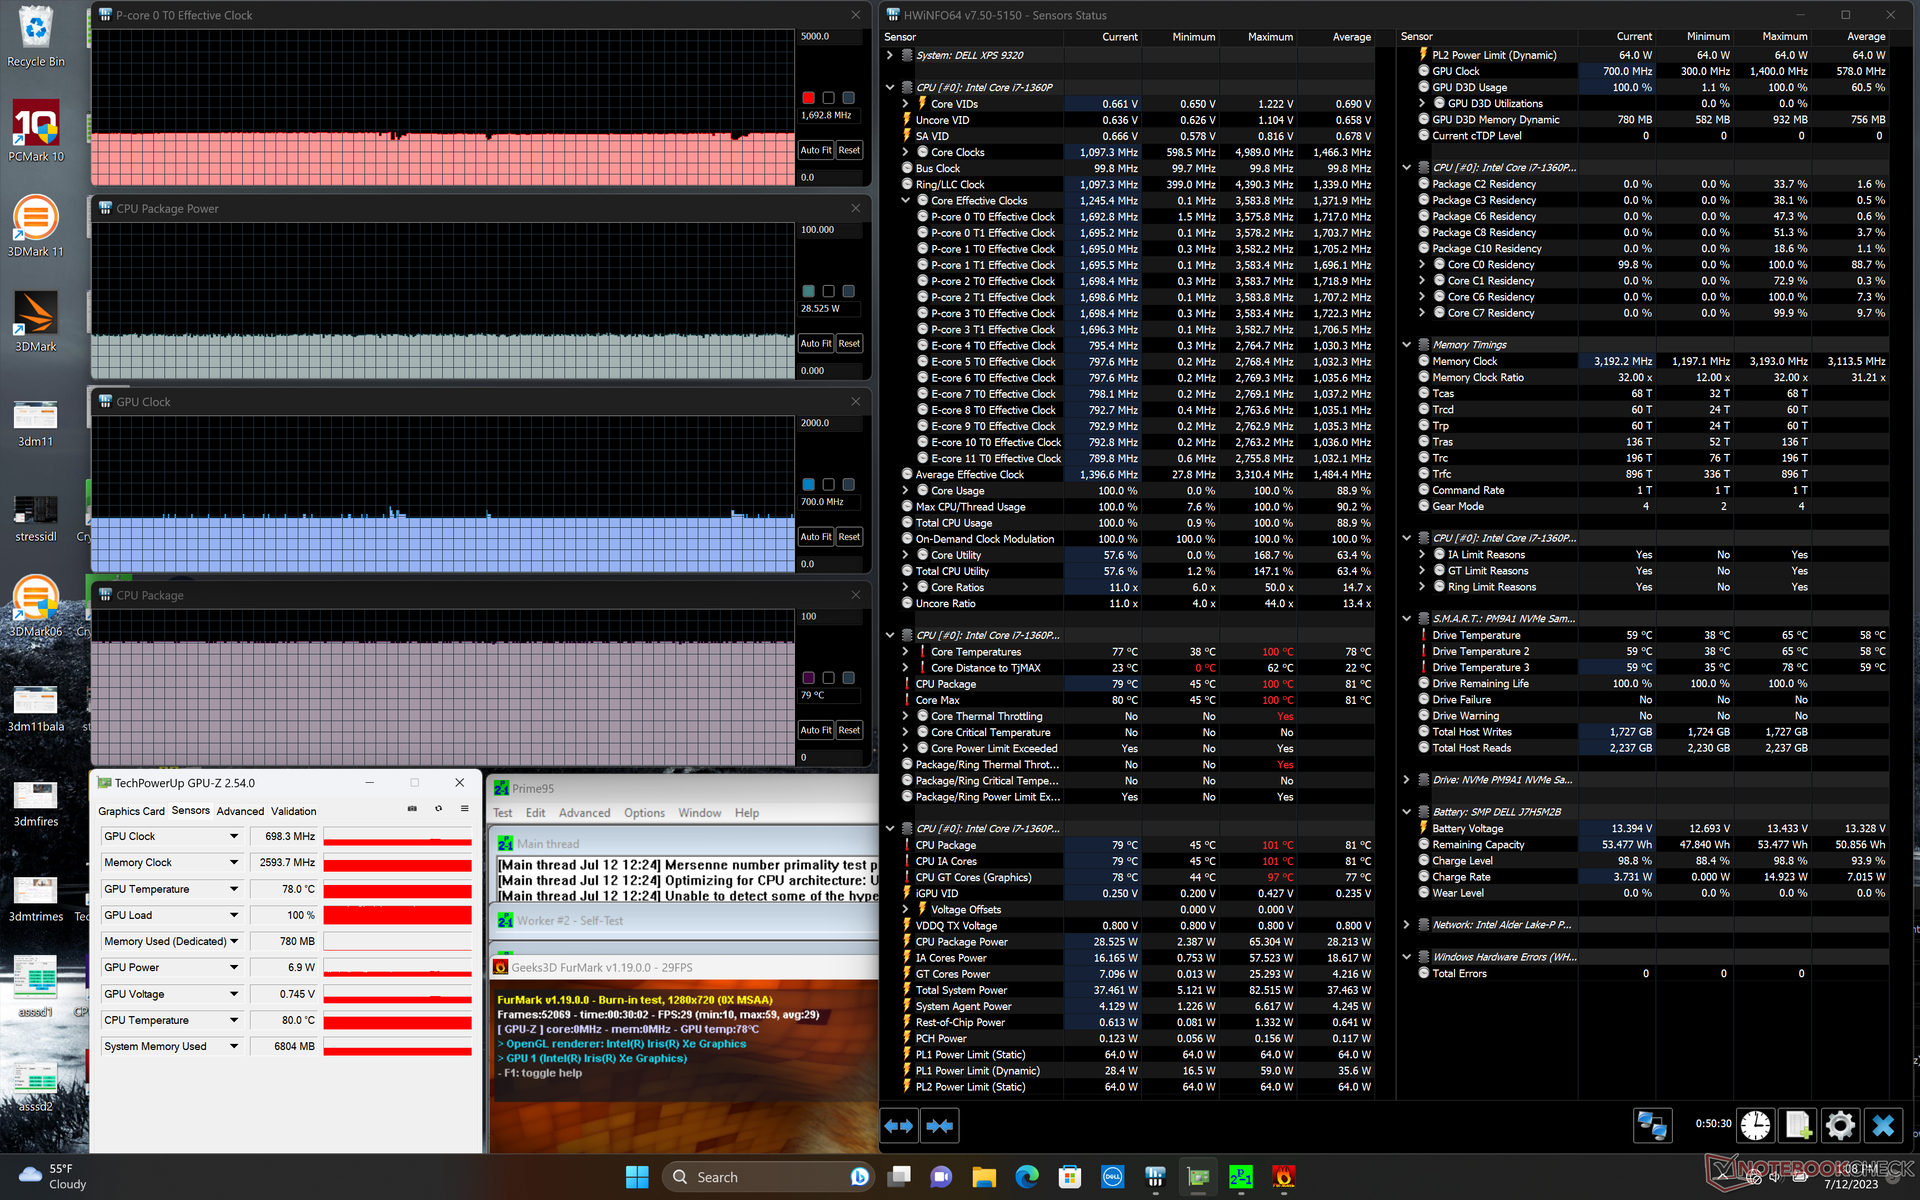
| Prime95 + FurMark | 1.7 | 700 | 79 |
| Witcher 3 | ~1.6 | 1250 | 81 |
Акустическая система
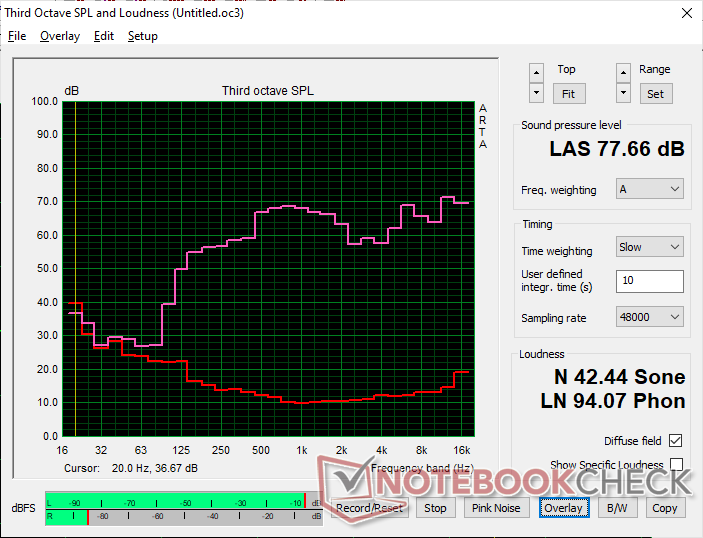
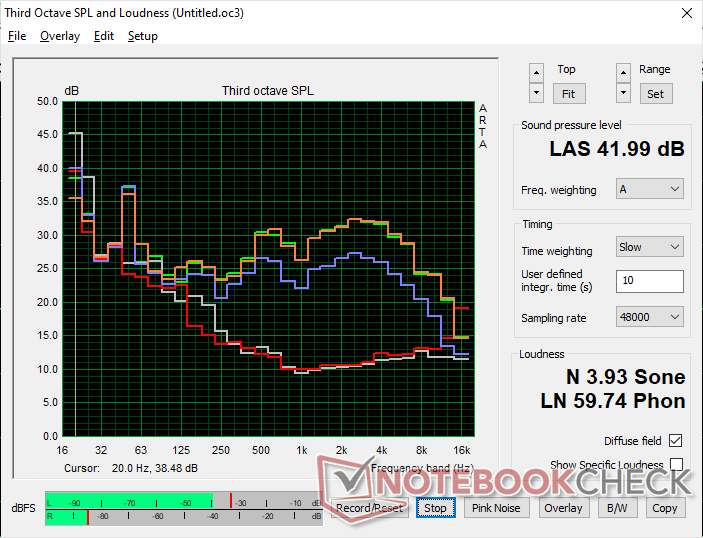
Анализ АЧХ аудиосистемы Dell XPS 13 Plus 9320 Core i7-1360P
(±) | неплохой уровень макс. громкости (77.7 дБА)
Низкие частоты (100 Гц - 315 Гц)
(±) | баса мало (на 10.8% меньше медианы)
(±) | он умеренно сбалансирован
Средние частоты (400 Гц - 2000 Гц)
(+) | диапазон не провален и не выпячен (отклонение лишь 3.6% от медианы)
(+) | он ровный, без "горбов" или провалов
Высокие частоты (2 кГц - 16 кГц)
(+) | диапазон отлично сбалансирован (отклонение лишь 3.6% от медианы)
(±) | он умеренно ровный, без больших "горбов" или провалов
Весь диапазон (100 - 16000 Гц)
(+) | звук в целом сбалансирован (13.2% отличия от медианы)
в сравнении с устройствами того же класса
» 21% прямо сравнимых устройств показал(и) себя лучше, 5% примерно так же, 74% значительно хуже
» Δ наилучшего устройства из прямо сравнимых: 5%, средняя Δ: 18%, худший результат: 53%
в сравнении со всеми тестированными устройствами
» 13% известных нам устройств показал(и) себя лучше, 3% примерно так же, 84% значительно хуже
» Δ наилучшего устройства среди известных нам: 4%, средняя Δ: 24%, худший результат: 134%
Анализ АЧХ аудиосистемы Apple MacBook Pro 16 2021 M1 Pro
(+) | отличный уровень макс. громкости (84.7 дБА)
Низкие частоты (100 Гц - 315 Гц)
(+) | бас отлично сбалансирован (отклонение лишь 3.8% от медианы)
(+) | он ровный, без "горбов" или провалов
Средние частоты (400 Гц - 2000 Гц)
(+) | диапазон не провален и не выпячен (отклонение лишь 1.3% от медианы)
(+) | он ровный, без "горбов" или провалов
Высокие частоты (2 кГц - 16 кГц)
(+) | диапазон отлично сбалансирован (отклонение лишь 1.9% от медианы)
(+) | он ровный, без "горбов" или провалов
Весь диапазон (100 - 16000 Гц)
(+) | звук в целом сбалансирован (4.6% отличия от медианы)
в сравнении с устройствами того же класса
» 0% прямо сравнимых устройств показал(и) себя лучше, 0% примерно так же, 100% значительно хуже
» Δ наилучшего устройства из прямо сравнимых: 5%, средняя Δ: 17%, худший результат: 45%
в сравнении со всеми тестированными устройствами
» 0% известных нам устройств показал(и) себя лучше, 0% примерно так же, 100% значительно хуже
» Δ наилучшего устройства среди известных нам: 4%, средняя Δ: 24%, худший результат: 134%
Энергопотребление и автономная работа
Энергопотребление
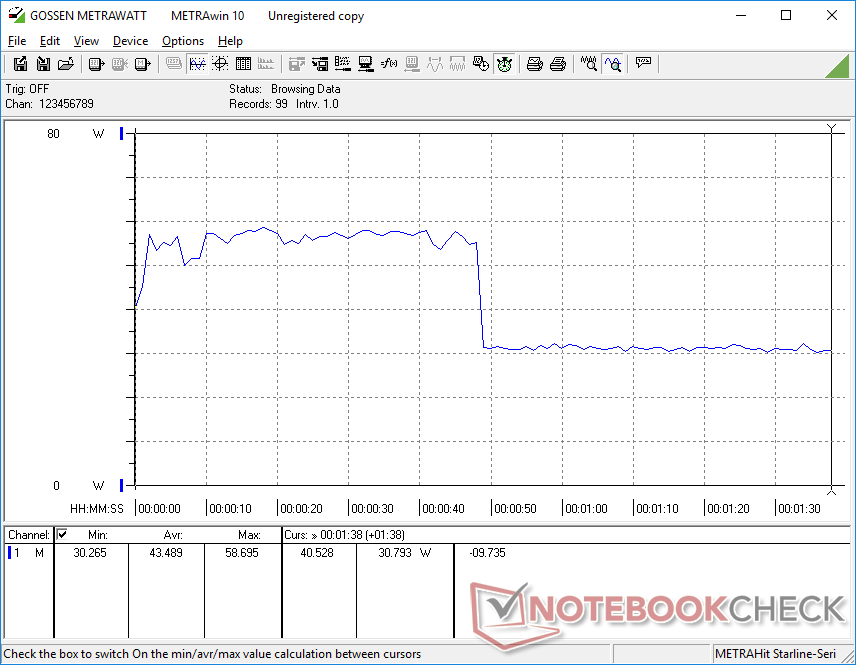
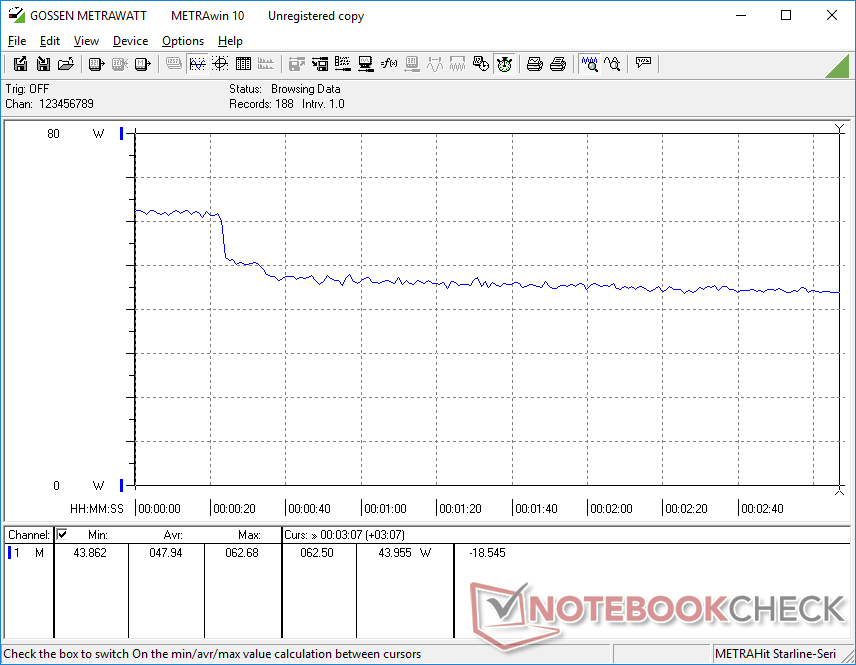
В состоянии простоя ноутбук потребляет от 6 до 14 Вт, что больше чем у большинства субноутбуков из-за OLED экрана.
Общее потребление системы точно такое же, как у предшественника, несмотря на новый процессор. В Prime95 мы наблюдали 63 Вт на обоих моделях, а значит энергоэффективность у новой модели не улучшилась.
| Выкл. | |
| Ожидание | |
| Нагрузка |
|
Легенда:
min: | |
| Dell XPS 13 Plus 9320 Core i7-1360P i7-1360P, Iris Xe G7 96EUs, Samsung PM9A1 MZVL2512HCJQ, OLED, 3456x2160, 13.4" | Dell XPS 13 Plus 9320 i7-1280P OLED i7-1280P, Iris Xe G7 96EUs, WDC PC SN810 512GB, OLED, 3456x2160, 13.4" | Dell XPS 13 7390 Core i7-10710U i7-10710U, UHD Graphics 620, SK Hynix PC601 NVMe 512 GB, IPS, 3840x2160, 13.3" | Framework Laptop 13.5 13th Gen Intel i7-1370P, Iris Xe G7 96EUs, WD PC SN740 SDDPNQD-1T00, IPS, 2256x1504, 13.5" | Lenovo ThinkPad X13 Yoga G3 21AW003UGE i7-1265U, Iris Xe G7 96EUs, Samsung PM9A1 MZVL2512HCJQ, IPS LED, 2560x1600, 13.3" | HP Spectre x360 13.5 14t-ef000 i7-1255U, Iris Xe G7 96EUs, Micron 3400 1TB MTFDKBA1T0TFH, OLED, 3000x2000, 13.5" | |
|---|---|---|---|---|---|---|
| Энергопотребление | -5% | 16% | 10% | 7% | 16% | |
| В простое, мин. * (Watt) | 6.9 | 6.5 6% | 4.7 32% | 2.9 58% | 4.6 33% | 4 42% |
| В простое, сред. * (Watt) | 7.4 | 7.8 -5% | 8.3 -12% | 6.3 15% | 7.9 -7% | 4.9 34% |
| В простое, макс. * (Watt) | 13.6 | 13 4% | 9 34% | 9.9 27% | 8.9 35% | 12.5 8% |
| Нагрузка, сред. * (Watt) | 43.5 | 56.6 -30% | 42 3% | 56.2 -29% | 56.1 -29% | 48.1 -11% |
| Witcher 3 ultra * (Watt) | 48 | 49.2 -3% | 56.6 -18% | 40.4 16% | 35.8 25% | |
| Нагрузка, макс. * (Watt) | 63.3 | 63 -0% | 49 23% | 60.8 4% | 66.1 -4% | 65.2 -3% |
* ... меньше = лучше
Энергопотребление: Witcher 3, Стресс-тест
Энергопотребление с внешним монитором
Автономность
Автономность практически такая же, как у предшественника на Core i7-1260P - 7.5 часов в нашем Wi-Fi тесте.
На полную зарядку с комплектным адаптером уходит 2 часа.
| Dell XPS 13 Plus 9320 Core i7-1360P i7-1360P, Iris Xe G7 96EUs, 55 Вт⋅ч | Dell XPS 13 Plus 9320 i7-1280P OLED i7-1280P, Iris Xe G7 96EUs, 55 Вт⋅ч | Dell XPS 13 7390 Core i7-10710U i7-10710U, UHD Graphics 620, 52 Вт⋅ч | Framework Laptop 13.5 13th Gen Intel i7-1370P, Iris Xe G7 96EUs, 61 Вт⋅ч | Lenovo ThinkPad X13 Yoga G3 21AW003UGE i7-1265U, Iris Xe G7 96EUs, 52.8 Вт⋅ч | HP Spectre x360 13.5 14t-ef000 i7-1255U, Iris Xe G7 96EUs, 66 Вт⋅ч | |
|---|---|---|---|---|---|---|
| Время работы | -21% | 15% | 21% | 11% | 10% | |
| Чтение сайтов по Wi-Fi v.2 (h) | 7.3 | 5.8 -21% | 8.4 15% | 8.8 21% | 8.1 11% | 8 10% |
| Нагрузка и 100% яркости (h) | 1.9 | 2.2 | ||||
| В простое (h) | 20.4 |
За
Против
Вердикт
XPS 13 Plus был впервые представлен в прошлом году, потому вполне ожидаемо новая модель получила минимальные изменения. Конечно, многого мы и не ждали, но даже так изменения практически отсутствуют: производительность точно такая же несмотря на смену процессора. Более того, появились новые проблемы: перегрев SSD (несмотря на идентичную модель) и пропуск кадров при воспроизведении 4K видео (высокие задержки DPC). Все основные достоинства и недостатки XPS 13 Plus 9320 перекочевали в версию 2023 года выпуска.
Core i7-1360P ведет себя как переименованный Core i7-1280P. Заинтересованным пользователям рекомендуется рассмотреть вариант покупки прошлогоднего XPS 13 Plus 9320 вместо версии 2023 года ввиду отсутствия позитивных изменений
Если вы выбрали конкретно XPS 13 Plus 9320, то рекомендуем обратить внимание на модель 2022 года, так как она дешевле - сэкономленные деньги можно потратить на увеличение памяти, более качественный экран или другие апгрейды.
Dell XPS 13 Plus 9320 Core i7-1360P
- 16 July 2023 v7 (old)
Allen Ngo
Декларация о непредвзятости
Отбор устройств для обзора осуществляется нашей редакцией. Тестовый образец был предоставлен автору производителем или продавцом для целей настоящего обзора. Кредитор не имел никакого влияния на этот обзор, и производитель не получил копию этого обзора до публикации. Обязанности публиковать этот обзор не было. Являясь независимой медиа-компанией, Notebookcheck не подчиняется власти производителей, розничных продавцов или издателей.
Вот как проводит тестирование Notebookcheck
Каждый год Notebookcheck независимо проверяет сотни ноутбуков и смартфонов, используя стандартизированные процедуры, чтобы гарантировать сопоставимость всех результатов. В течение примерно 20 лет мы постоянно совершенствовали наши методы испытаний и при этом установили отраслевые стандарты. В наших испытательных лабораториях опытные специалисты и редакторы используют высококачественное измерительное оборудование. Эти тесты включают в себя многоэтапный процесс проверки. Наша сложная рейтинговая система основана на сотнях обоснованных измерений и критериев, что обеспечивает объективность.
Price comparison

