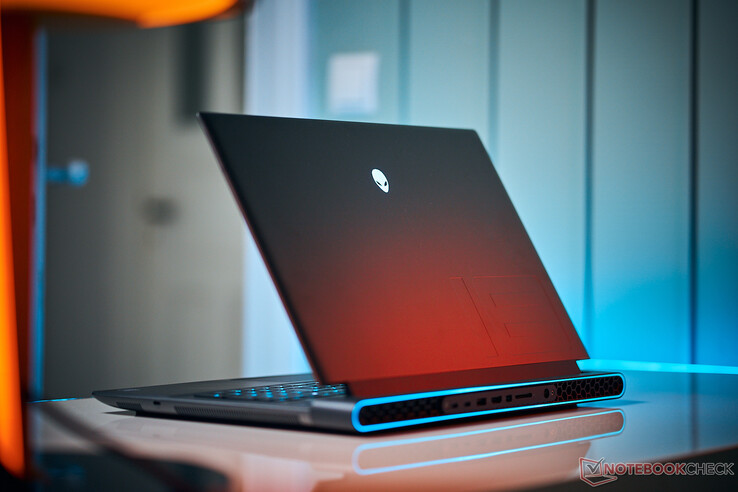
Обзор ноутбука Alienware m18 R2: Меняем Core i9-13980HX на i9-14900HX
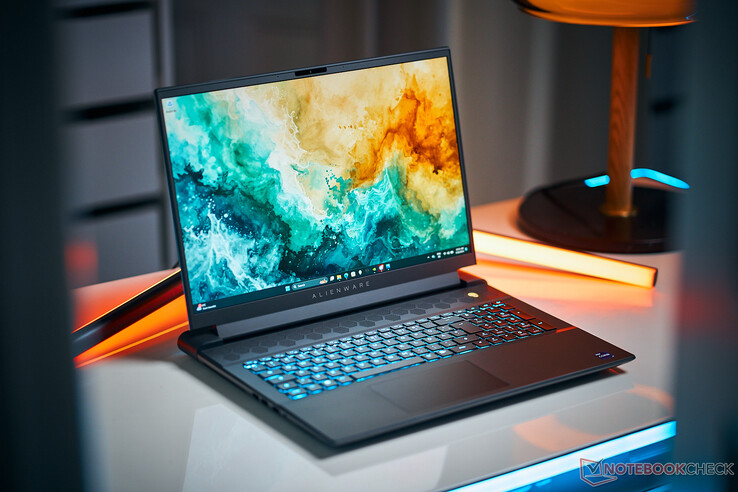
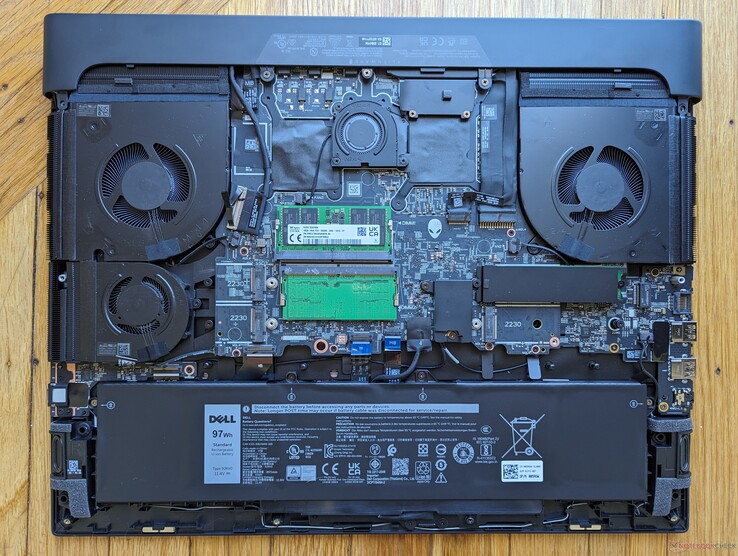
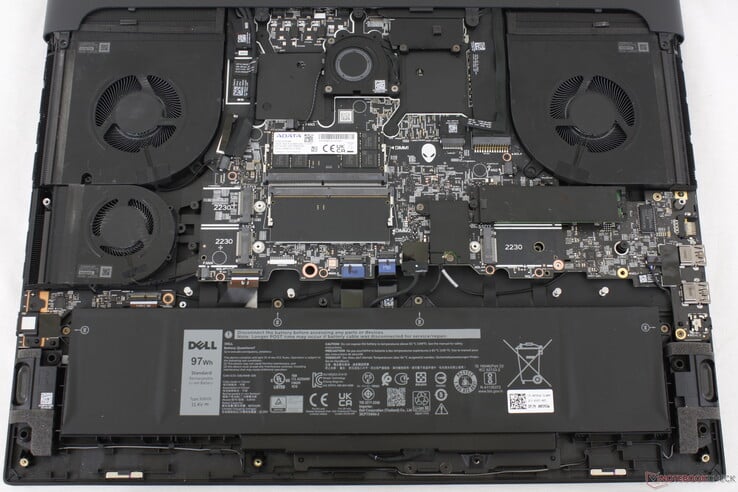
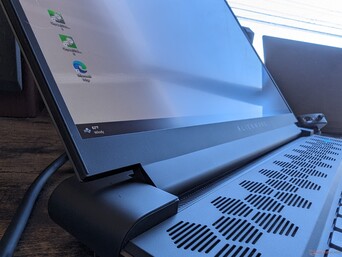
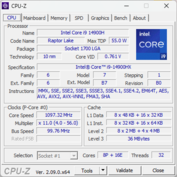
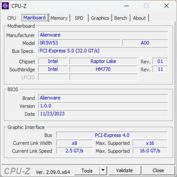
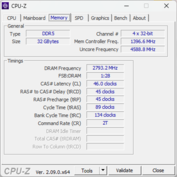
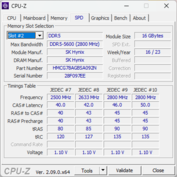
Dell обновила Alienware m18, выпустив второе поколение R2. Несмотря на кардинальную разницу между m16 R1 и m16 R2, для нового m18 R2 производитель подготовил лишь апгрейд до процессоров Raptor Lake-HX Core ix-14000HX на смену предыдущему 13 поколению. Практически во всем остальном новинка повторяет предыдущий m18 R1 и m18 R1 AMD. По этой причине в этом обзоре мы опустим все известные подробности о ноутбуке, сконцентрировавшись на изменениях.
Для тестирования нам досталась старшая конфигурация на Core i9-14900HX, со 175-Вт RTX 4090, 1600p 165-Гц IPS экраном и механической клавиатурой CherryMX с ценником около $3200. Для модели также доступны Core i7-14650HX, RTX 4060, 1200p 480-Гц экран и стандартная мембранная клавиатура по цене от $2000.
Обзоры других ноутбуков Alienware:
Соперники
Рейтинг | Дата | Модель | Вес | Height | Размер | Разрешение | Цена |
|---|---|---|---|---|---|---|---|
| 89.5 % v7 (old) | March 2024 | Alienware m18 R2 i9-14900HX, GeForce RTX 4090 Laptop GPU | 4 килог. | 26.7 мм | 18.00" | 2560x1600 | |
| 89.2 % v7 (old) | December 2023 | Alienware m18 R1 AMD R9 7945HX, Radeon RX 7900M | 3.9 килог. | 26.7 мм | 18.00" | 1920x1200 | |
| 90.7 % v7 (old) | April 2023 | Alienware m18 R1 i9-13980HX, GeForce RTX 4090 Laptop GPU | 3.9 килог. | 26.7 мм | 18.00" | 1920x1200 | |
| 88.8 % v7 (old) | February 2024 | MSI Titan 18 HX A14VIG i9-14900HX, GeForce RTX 4090 Laptop GPU | 3.6 килог. | 32.1 мм | 18.00" | 3840x2400 | |
| 87.4 % v7 (old) | March 2023 | Asus ROG Strix G18 G814JI i7-13650HX, GeForce RTX 4070 Laptop GPU | 3 килог. | 31 мм | 18.00" | 2560x1600 | |
| 88.3 % v7 (old) | October 2023 | Acer Predator Helios 18 N23Q2 i9-13900HX, GeForce RTX 4080 Laptop GPU | 3.2 килог. | 29.15 мм | 18.00" | 2560x1600 |
Дизайн и особенности — По-прежнему большой корпус
Порт Ethernet в этом году получил увеличенную скорость за счет контроллера Killer E5000, который поддерживает до 5 Гбит. В остальном дизайн ноутбука остался без изменений.
Картридер
| SD Card Reader | |
| average JPG Copy Test (av. of 3 runs) | |
| Alienware m18 R1 (Angelibird AV Pro V60) | |
| Alienware m18 R2 (Toshiba Exceria Pro SDXC 64 GB UHS-II) | |
| Alienware m18 R1 AMD (Toshiba Exceria Pro SDXC 64 GB UHS-II) | |
| MSI Titan 18 HX A14VIG (Toshiba Exceria Pro SDXC 64 GB UHS-II) | |
| Acer Predator Helios 18 N23Q2 | |
| maximum AS SSD Seq Read Test (1GB) | |
| Alienware m18 R1 AMD (Toshiba Exceria Pro SDXC 64 GB UHS-II) | |
| Alienware m18 R2 (Toshiba Exceria Pro SDXC 64 GB UHS-II) | |
| Alienware m18 R1 (Angelibird AV Pro V60) | |
| MSI Titan 18 HX A14VIG (Toshiba Exceria Pro SDXC 64 GB UHS-II) | |
| Acer Predator Helios 18 N23Q2 | |
Связь
| Networking | |
| iperf3 transmit AXE11000 | |
| Asus ROG Strix G18 G814JI | |
| Alienware m18 R1 AMD | |
| Alienware m18 R1 | |
| MSI Titan 18 HX A14VIG | |
| Acer Predator Helios 18 N23Q2 | |
| Alienware m18 R2 | |
| iperf3 receive AXE11000 | |
| Asus ROG Strix G18 G814JI | |
| Alienware m18 R1 AMD | |
| Alienware m18 R2 | |
| Alienware m18 R1 | |
| MSI Titan 18 HX A14VIG | |
| Acer Predator Helios 18 N23Q2 | |
| iperf3 transmit AXE11000 6GHz | |
| Alienware m18 R1 AMD | |
| Acer Predator Helios 18 N23Q2 | |
| Alienware m18 R1 | |
| MSI Titan 18 HX A14VIG | |
| Alienware m18 R2 | |
| iperf3 receive AXE11000 6GHz | |
| Alienware m18 R1 AMD | |
| Acer Predator Helios 18 N23Q2 | |
| MSI Titan 18 HX A14VIG | |
| Alienware m18 R1 | |
| Alienware m18 R2 | |
Веб-камера
Дисплей — 1200p или 1600p?
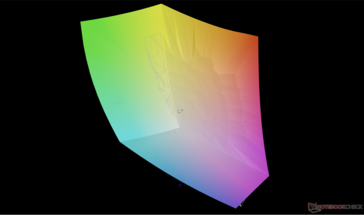
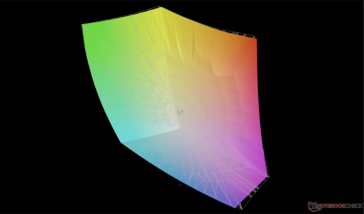
Довольно необычно, что экран у тестовой конфигурации m18 R2 точно такой, как у m18 R1, хотя разрешение (1600p против 1200p) и частота обновления (165 Гц против 480 Гц) у них отличаются. Оба экрана обеспечивают полный охват DCI-P3, низкое время отклика и контрастность на уровне ~1000:1.
Теперь, когда мы посмотрели на оба экрана вживую, мы рекомендуем выбирать вариант с разрешением 1600p, так как 1200p разрешение на 18-дюймовом экране уже дает не самую четкую картинку, а частота 480 Гц дает минимальные заметные улучшения по сравнению с 165 Гц в подавляющем большинстве случаев.
Windows VRR не поддерживается, потому пользователь может переключаться лишь между 165 и 60 Гц. Технология G-Sync поддерживается, но только с режимом дискретной видеокарты. HDR отсутствует, так как яркость подсветки недостаточная для соответствия стандарту. Значение у нашего тестового образца чуть меньше, чем у 1200p экрана.
| |||||||||||||||||||||||||
Равномерность подсветки: 78 %
От батареи: 271.8 cd/m²
Контрастность: 1007:1 (Уровень чёрного: 0.27 cd/m²)
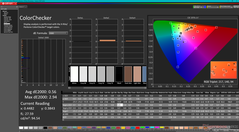
ΔE ColorChecker Calman: 2.48 | ∀{0.5-29.43 Ø4.77}
calibrated: 0.56
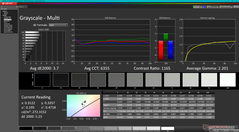
ΔE Greyscale Calman: 3.7 | ∀{0.09-98 Ø5}
88.9% AdobeRGB 1998 (Argyll 3D)
99.5% sRGB (Argyll 3D)
97.8% Display P3 (Argyll 3D)
Gamma: 2.2
CCT: 6355 K
| Alienware m18 R2 BOE NE18NZ1, IPS, 2560x1600, 18" | Alienware m18 R1 AMD BOE NE18NZ1, IPS, 1920x1200, 18" | Alienware m18 R1 Chi Mei 180JME, IPS, 1920x1200, 18" | MSI Titan 18 HX A14VIG AU Optronics B180ZAN01.0, Mini-LED, 3840x2400, 18" | Asus ROG Strix G18 G814JI NE180QDM-NZ2 (BOE0B35), IPS, 2560x1600, 18" | Acer Predator Helios 18 N23Q2 AUO45A8 (B180QAN01.2), IPS, 2560x1600, 18" | |
|---|---|---|---|---|---|---|
| Display | 0% | 1% | -1% | -1% | 2% | |
| Display P3 Coverage (%) | 97.8 | 98.5 1% | 97.7 0% | 98.1 0% | 98.1 0% | 99.8 2% |
| sRGB Coverage (%) | 99.5 | 99.7 0% | 100 1% | 99.8 0% | 99.9 0% | 100 1% |
| AdobeRGB 1998 Coverage (%) | 88.9 | 88.7 0% | 89.8 1% | 86.2 -3% | 85.6 -4% | 91.8 3% |
| Response Times | 28% | 24% | -375% | 4% | -57% | |
| Response Time Grey 50% / Grey 80% * (ms) | 5.3 ? | 2.8 ? 47% | 3 ? 43% | 8.6 ? -62% | 5.6 ? -6% | 7.6 ? -43% |
| Response Time Black / White * (ms) | 10.4 ? | 9.6 ? 8% | 9.9 ? 5% | 81.8 ? -687% | 9 ? 13% | 17.8 ? -71% |
| PWM Frequency (Hz) | 2592 ? | 2509 | ||||
| Параметры экрана | 29% | 24% | -45% | 9% | -28% | |
| Яркость в центре (cd/m²) | 271.8 | 319.6 18% | 372.8 37% | 467.5 72% | 471 73% | 360 32% |
| Brightness (cd/m²) | 275 | 304 11% | 367 33% | 459 67% | 422 53% | 355 29% |
| Brightness Distribution (%) | 78 | 87 12% | 97 24% | 90 15% | 83 6% | 92 18% |
| Уровень чёрного * (cd/m²) | 0.27 | 0.25 7% | 0.32 -19% | 0.47 -74% | 0.21 22% | |
| Контрастность (:1) | 1007 | 1278 27% | 1165 16% | 1002 0% | 1714 70% | |
| Colorchecker Delta E * | 2.48 | 1.22 51% | 1.92 23% | 3.77 -52% | 2.05 17% | 3.82 -54% |
| Colorchecker dE 2000 max. * | 5.59 | 3.1 45% | 3.65 35% | 6.12 -9% | 4.15 26% | 7.38 -32% |
| Colorchecker dE 2000 calibrated * | 0.56 | 0.47 16% | 0.51 9% | 2.94 -425% | 0.8 -43% | 2.24 -300% |
| Delta E для серого * | 3.7 | 0.8 78% | 1.5 59% | 3.2 14% | 2.8 24% | 5.06 -37% |
| Гамма | 2.2 100% | 2.23 99% | 2.34 94% | 2.43 91% | 2.204 100% | 2.52 87% |
| CCT | 6355 102% | 6471 100% | 6607 98% | 6478 100% | 7122 91% | 5657 115% |
| Среднее значение | 19% /
23% | 16% /
19% | -140% /
-89% | 4% /
6% | -28% /
-26% |
* ... меньше = лучше
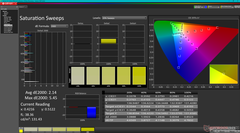
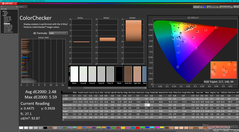
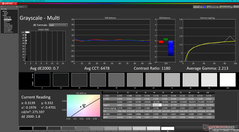
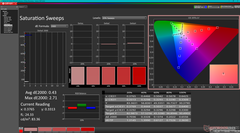
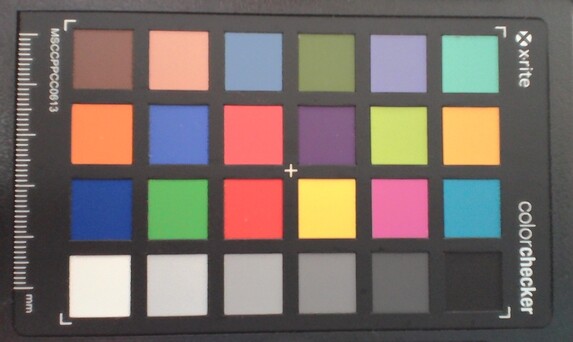
Дисплей не проходил заводскую калибровку, однако значения DeltaE достаточно низкие. С помощью самостоятельной калибровки нам удалось снизить DeltaE до <1 относительно пространства DCI-P3. Наш цветовой профиль можно скачать бесплатно по ссылке в таблице выше.
Дисплей: тест на время отклика
| ↔ Перемена цвета пикселей, чёрный - белый (1) и белый - чёрный (2) | ||
|---|---|---|
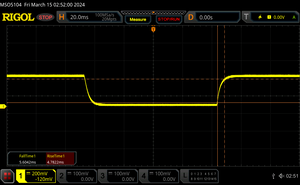
| 10.4 ms ... стадия 1 ↗ и стадия 2 ↘ в сумме | ↗ 4.8 ms стадия 1 | |
| ↘ 5.6 ms стадия 2 | ||
| Это неплохое время отклика. Оно подходит для игр и подобных применений, хоть и не идеально. Для сравнения, самый лучший результат среди всех известных нам устройств равен 0.1 миллисек., самый худший - 240 миллисек. » 27% экранов из нашей базы данных показали более хороший результат. Таким образом, тестируемое устройство находится в верхней половине рейтинга (оно опережает средний результат, равный 20.2 миллисек.) | ||
| ↔ Перемена цвета пикселей, серый 50% - серый 80% (1) и серый 80% - серый 50% (2) | ||
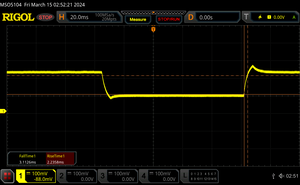
| 5.3 ms ... стадия 1 ↗ и стадия 2 ↘ в сумме | ↗ 2.2 ms стадия 1 | |
| ↘ 3.1 ms стадия 2 | ||
| Это отличное время отклика! Экран идеально подходит для игр и подобных применений. Для сравнения, самый лучший результат среди всех известных нам устройств равен 0.165 миллисек., самый худший - 636 миллисек. » 16% экранов из нашей базы данных показали более хороший результат. Таким образом, тестируемое устройство находится в верхней половине рейтинга (оно опережает средний результат, равный 31.6 миллисек.) | ||
Тест на мерцание
| Ура! ШИМ не обнаружено | |||
Для сравнения, 53 % известных нам устройств не применяют PWM для изменения яркости, а среди тех, где PWM используется, типичная частота модуляции составляет 8083 Гц (мин. 5 Гц, макс. 343500 Гц). | |||
Производительность — Raptor Lake-HX Refresh
Параметры тестирования
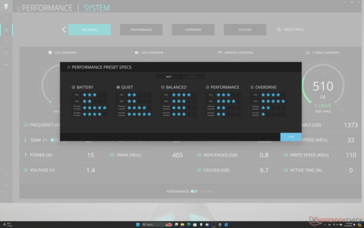
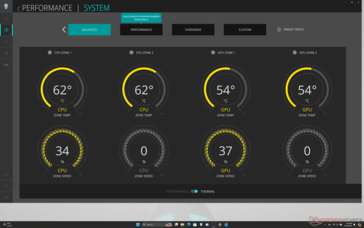
Для проведения тестов мы выставили в Alienware Command Center профиль системы Overdrive, а также схему электропитания Максимальная производительность в Windows. Также мы выбрали режим дискретной видеокарты в панели управления Nvidia. Система поддерживает Advanced Optimus и оснащена MUX-переключателем, потому для переключения видеокарт перезагрузка не нужна.
За время тестирования ноутбука мы столкнулись с проблемами в его работе, связанными со спящим режимом. Порой ноутбук не переходит в спящий режим при закрытии крышки и потому сильно грелся и садил батарею. Если вы закроете ноутбук и будете нести его в рюкзаке - возможны проблемы. Также, порой после выхода из спящего режима система подвисала на пару секунд. Вполне вероятно, что эта проблема связана с MUX и автоматическим переключением видеокарт.
Процессор
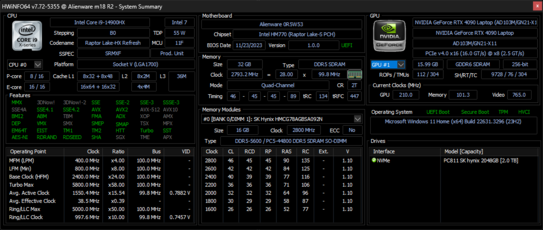
Intel Core i9-14900HX - это переименованная версия прошлогоднего Core i9-13900HX, которая принимает незначительный прирост производительности (в лучшем случае). По факту же Core i9-13980HX у прошлогодней модели оказался чуть быстрее i9-14900HX в многопоточных нагрузках.
Выбрав конфигурацию на Core i7-14700HX или Core i7-14650HX, вам придется смириться с отставанием по производительности на 25-30% или 30-35% соответственно. Младшие чипы также являются переименованными версиями своих прошлогодних аналогов.
Многопоточный тест CB15
Cinebench R23: Multi Core | Single Core
Cinebench R20: CPU (Multi Core) | CPU (Single Core)
Cinebench R15: CPU Multi 64Bit | CPU Single 64Bit
Blender: v2.79 BMW27 CPU
7-Zip 18.03: 7z b 4 | 7z b 4 -mmt1
Geekbench 6.5: Multi-Core | Single-Core
Geekbench 5.5: Multi-Core | Single-Core
HWBOT x265 Benchmark v2.2: 4k Preset
LibreOffice : 20 Documents To PDF
R Benchmark 2.5: Overall mean
| CPU Performance rating | |
| Alienware m18 R1 AMD | |
| Alienware m18 R2 | |
| Alienware m18 R1 -2! | |
| MSI Titan 18 HX A14VIG | |
| Acer Predator Helios 18 N23Q2 | |
| Усредн. модель с Intel Core i9-14900HX | |
| Razer Blade 18 RTX 4070 -2! | |
| Asus TUF Gaming A17 FA707XI-NS94 | |
| Asus ROG Strix G18 G814JI -2! | |
| Schenker XMG Apex 17 (Late 23) | |
| Acer Nitro 17 AN17-51-71ER -2! | |
| Acer Nitro 17 AN17-41-R9LN | |
| Cinebench R23 / Multi Core | |
| Alienware m18 R1 AMD | |
| Alienware m18 R1 | |
| MSI Titan 18 HX A14VIG | |
| Alienware m18 R2 | |
| Acer Predator Helios 18 N23Q2 | |
| Усредн. модель с Intel Core i9-14900HX (17078 - 36249, n=37) | |
| Razer Blade 18 RTX 4070 | |
| Asus ROG Strix G18 G814JI | |
| Acer Nitro 17 AN17-51-71ER | |
| Asus TUF Gaming A17 FA707XI-NS94 | |
| Schenker XMG Apex 17 (Late 23) | |
| Acer Nitro 17 AN17-41-R9LN | |
| Cinebench R23 / Single Core | |
| Alienware m18 R2 | |
| Усредн. модель с Intel Core i9-14900HX (1720 - 2245, n=37) | |
| MSI Titan 18 HX A14VIG | |
| Alienware m18 R1 | |
| Acer Predator Helios 18 N23Q2 | |
| Razer Blade 18 RTX 4070 | |
| Alienware m18 R1 AMD | |
| Asus ROG Strix G18 G814JI | |
| Asus TUF Gaming A17 FA707XI-NS94 | |
| Schenker XMG Apex 17 (Late 23) | |
| Acer Nitro 17 AN17-41-R9LN | |
| Acer Nitro 17 AN17-51-71ER | |
| Cinebench R20 / CPU (Multi Core) | |
| Alienware m18 R1 AMD | |
| Alienware m18 R1 | |
| MSI Titan 18 HX A14VIG | |
| Alienware m18 R2 | |
| Acer Predator Helios 18 N23Q2 | |
| Усредн. модель с Intel Core i9-14900HX (6579 - 13832, n=37) | |
| Razer Blade 18 RTX 4070 | |
| Asus ROG Strix G18 G814JI | |
| Acer Nitro 17 AN17-51-71ER | |
| Asus TUF Gaming A17 FA707XI-NS94 | |
| Schenker XMG Apex 17 (Late 23) | |
| Acer Nitro 17 AN17-41-R9LN | |
| Cinebench R20 / CPU (Single Core) | |
| Alienware m18 R2 | |
| Усредн. модель с Intel Core i9-14900HX (657 - 859, n=37) | |
| MSI Titan 18 HX A14VIG | |
| Alienware m18 R1 | |
| Acer Predator Helios 18 N23Q2 | |
| Razer Blade 18 RTX 4070 | |
| Alienware m18 R1 AMD | |
| Asus ROG Strix G18 G814JI | |
| Asus TUF Gaming A17 FA707XI-NS94 | |
| Schenker XMG Apex 17 (Late 23) | |
| Acer Nitro 17 AN17-41-R9LN | |
| Acer Nitro 17 AN17-51-71ER | |
| Cinebench R15 / CPU Multi 64Bit | |
| Alienware m18 R1 AMD | |
| Alienware m18 R1 | |
| Alienware m18 R2 | |
| MSI Titan 18 HX A14VIG | |
| Acer Predator Helios 18 N23Q2 | |
| Razer Blade 18 RTX 4070 | |
| Усредн. модель с Intel Core i9-14900HX (3263 - 5589, n=38) | |
| Asus ROG Strix G18 G814JI | |
| Acer Nitro 17 AN17-51-71ER | |
| Asus TUF Gaming A17 FA707XI-NS94 | |
| Schenker XMG Apex 17 (Late 23) | |
| Acer Nitro 17 AN17-41-R9LN | |
| Cinebench R15 / CPU Single 64Bit | |
| Alienware m18 R2 | |
| Alienware m18 R1 AMD | |
| Усредн. модель с Intel Core i9-14900HX (247 - 323, n=37) | |
| Alienware m18 R1 | |
| MSI Titan 18 HX A14VIG | |
| Razer Blade 18 RTX 4070 | |
| Acer Predator Helios 18 N23Q2 | |
| Asus TUF Gaming A17 FA707XI-NS94 | |
| Asus ROG Strix G18 G814JI | |
| Schenker XMG Apex 17 (Late 23) | |
| Acer Nitro 17 AN17-41-R9LN | |
| Acer Nitro 17 AN17-51-71ER | |
| Blender / v2.79 BMW27 CPU | |
| Acer Nitro 17 AN17-41-R9LN | |
| Schenker XMG Apex 17 (Late 23) | |
| Asus TUF Gaming A17 FA707XI-NS94 | |
| Acer Nitro 17 AN17-51-71ER | |
| Asus ROG Strix G18 G814JI | |
| Усредн. модель с Intel Core i9-14900HX (91 - 206, n=37) | |
| Razer Blade 18 RTX 4070 | |
| Acer Predator Helios 18 N23Q2 | |
| MSI Titan 18 HX A14VIG | |
| Alienware m18 R2 | |
| Alienware m18 R1 | |
| Alienware m18 R1 AMD | |
| 7-Zip 18.03 / 7z b 4 | |
| Alienware m18 R1 AMD | |
| Alienware m18 R1 | |
| Alienware m18 R2 | |
| MSI Titan 18 HX A14VIG | |
| Acer Predator Helios 18 N23Q2 | |
| Razer Blade 18 RTX 4070 | |
| Усредн. модель с Intel Core i9-14900HX (66769 - 136645, n=37) | |
| Asus ROG Strix G18 G814JI | |
| Asus TUF Gaming A17 FA707XI-NS94 | |
| Acer Nitro 17 AN17-51-71ER | |
| Schenker XMG Apex 17 (Late 23) | |
| Acer Nitro 17 AN17-41-R9LN | |
| 7-Zip 18.03 / 7z b 4 -mmt1 | |
| Alienware m18 R1 AMD | |
| Alienware m18 R2 | |
| Усредн. модель с Intel Core i9-14900HX (5452 - 7545, n=37) | |
| Acer Predator Helios 18 N23Q2 | |
| Alienware m18 R1 | |
| Razer Blade 18 RTX 4070 | |
| Schenker XMG Apex 17 (Late 23) | |
| Asus TUF Gaming A17 FA707XI-NS94 | |
| MSI Titan 18 HX A14VIG | |
| Asus ROG Strix G18 G814JI | |
| Acer Nitro 17 AN17-41-R9LN | |
| Acer Nitro 17 AN17-51-71ER | |
| Geekbench 6.5 / Multi-Core | |
| Alienware m18 R2 | |
| Acer Predator Helios 18 N23Q2 | |
| Усредн. модель с Intel Core i9-14900HX (13158 - 19665, n=37) | |
| MSI Titan 18 HX A14VIG | |
| Alienware m18 R1 AMD | |
| Schenker XMG Apex 17 (Late 23) | |
| Asus TUF Gaming A17 FA707XI-NS94 | |
| Acer Nitro 17 AN17-41-R9LN | |
| Geekbench 6.5 / Single-Core | |
| Alienware m18 R2 | |
| Усредн. модель с Intel Core i9-14900HX (2419 - 3129, n=37) | |
| Acer Predator Helios 18 N23Q2 | |
| Alienware m18 R1 AMD | |
| MSI Titan 18 HX A14VIG | |
| Asus TUF Gaming A17 FA707XI-NS94 | |
| Schenker XMG Apex 17 (Late 23) | |
| Acer Nitro 17 AN17-41-R9LN | |
| Geekbench 5.5 / Multi-Core | |
| Alienware m18 R1 | |
| Alienware m18 R2 | |
| Acer Predator Helios 18 N23Q2 | |
| Razer Blade 18 RTX 4070 | |
| Alienware m18 R1 AMD | |
| Усредн. модель с Intel Core i9-14900HX (8618 - 23194, n=37) | |
| MSI Titan 18 HX A14VIG | |
| Asus ROG Strix G18 G814JI | |
| Acer Nitro 17 AN17-51-71ER | |
| Schenker XMG Apex 17 (Late 23) | |
| Asus TUF Gaming A17 FA707XI-NS94 | |
| Acer Nitro 17 AN17-41-R9LN | |
| Geekbench 5.5 / Single-Core | |
| Alienware m18 R2 | |
| Alienware m18 R1 AMD | |
| MSI Titan 18 HX A14VIG | |
| Усредн. модель с Intel Core i9-14900HX (1669 - 2210, n=37) | |
| Alienware m18 R1 | |
| Acer Predator Helios 18 N23Q2 | |
| Razer Blade 18 RTX 4070 | |
| Asus TUF Gaming A17 FA707XI-NS94 | |
| Schenker XMG Apex 17 (Late 23) | |
| Asus ROG Strix G18 G814JI | |
| Acer Nitro 17 AN17-41-R9LN | |
| Acer Nitro 17 AN17-51-71ER | |
| HWBOT x265 Benchmark v2.2 / 4k Preset | |
| Alienware m18 R1 AMD | |
| Alienware m18 R1 | |
| Alienware m18 R2 | |
| Razer Blade 18 RTX 4070 | |
| MSI Titan 18 HX A14VIG | |
| Acer Predator Helios 18 N23Q2 | |
| Усредн. модель с Intel Core i9-14900HX (16.8 - 38.9, n=37) | |
| Asus ROG Strix G18 G814JI | |
| Asus TUF Gaming A17 FA707XI-NS94 | |
| Schenker XMG Apex 17 (Late 23) | |
| Acer Nitro 17 AN17-51-71ER | |
| Acer Nitro 17 AN17-41-R9LN | |
| LibreOffice / 20 Documents To PDF | |
| Acer Nitro 17 AN17-41-R9LN | |
| Asus ROG Strix G18 G814JI | |
| Acer Nitro 17 AN17-51-71ER | |
| Acer Predator Helios 18 N23Q2 | |
| Asus TUF Gaming A17 FA707XI-NS94 | |
| Schenker XMG Apex 17 (Late 23) | |
| Alienware m18 R1 | |
| MSI Titan 18 HX A14VIG | |
| Alienware m18 R2 | |
| Razer Blade 18 RTX 4070 | |
| Усредн. модель с Intel Core i9-14900HX (19 - 85.1, n=37) | |
| Alienware m18 R1 AMD | |
| R Benchmark 2.5 / Overall mean | |
| Acer Nitro 17 AN17-51-71ER | |
| Acer Nitro 17 AN17-41-R9LN | |
| Asus ROG Strix G18 G814JI | |
| Schenker XMG Apex 17 (Late 23) | |
| Asus TUF Gaming A17 FA707XI-NS94 | |
| Alienware m18 R1 AMD | |
| Acer Predator Helios 18 N23Q2 | |
| Razer Blade 18 RTX 4070 | |
| Alienware m18 R1 | |
| MSI Titan 18 HX A14VIG | |
| Усредн. модель с Intel Core i9-14900HX (0.3604 - 0.4859, n=37) | |
| Alienware m18 R2 | |
* ... меньше = лучше
AIDA64: FP32 Ray-Trace | FPU Julia | CPU SHA3 | CPU Queen | FPU SinJulia | FPU Mandel | CPU AES | CPU ZLib | FP64 Ray-Trace | CPU PhotoWorxx
| Performance rating | |
| Alienware m18 R1 AMD | |
| Acer Predator Helios 18 N23Q2 | |
| Alienware m18 R1 | |
| Alienware m18 R2 | |
| MSI Titan 18 HX A14VIG | |
| Усредн. модель с Intel Core i9-14900HX | |
| Asus ROG Strix G18 G814JI | |
| AIDA64 / FP32 Ray-Trace | |
| Alienware m18 R1 AMD | |
| Alienware m18 R1 | |
| MSI Titan 18 HX A14VIG | |
| Alienware m18 R2 | |
| Acer Predator Helios 18 N23Q2 | |
| Усредн. модель с Intel Core i9-14900HX (13098 - 33474, n=36) | |
| Asus ROG Strix G18 G814JI | |
| AIDA64 / FPU Julia | |
| Alienware m18 R1 AMD | |
| MSI Titan 18 HX A14VIG | |
| Alienware m18 R1 | |
| Alienware m18 R2 | |
| Acer Predator Helios 18 N23Q2 | |
| Усредн. модель с Intel Core i9-14900HX (67573 - 166040, n=36) | |
| Asus ROG Strix G18 G814JI | |
| AIDA64 / CPU SHA3 | |
| Alienware m18 R1 AMD | |
| MSI Titan 18 HX A14VIG | |
| Alienware m18 R1 | |
| Alienware m18 R2 | |
| Acer Predator Helios 18 N23Q2 | |
| Усредн. модель с Intel Core i9-14900HX (3589 - 7979, n=36) | |
| Asus ROG Strix G18 G814JI | |
| AIDA64 / CPU Queen | |
| Alienware m18 R1 AMD | |
| MSI Titan 18 HX A14VIG | |
| Alienware m18 R1 | |
| Alienware m18 R2 | |
| Усредн. модель с Intel Core i9-14900HX (118405 - 148966, n=36) | |
| Acer Predator Helios 18 N23Q2 | |
| Asus ROG Strix G18 G814JI | |
| AIDA64 / FPU SinJulia | |
| Alienware m18 R1 AMD | |
| MSI Titan 18 HX A14VIG | |
| Alienware m18 R1 | |
| Alienware m18 R2 | |
| Acer Predator Helios 18 N23Q2 | |
| Усредн. модель с Intel Core i9-14900HX (10475 - 18517, n=36) | |
| Asus ROG Strix G18 G814JI | |
| AIDA64 / FPU Mandel | |
| Alienware m18 R1 AMD | |
| Alienware m18 R1 | |
| Alienware m18 R2 | |
| MSI Titan 18 HX A14VIG | |
| Acer Predator Helios 18 N23Q2 | |
| Усредн. модель с Intel Core i9-14900HX (32543 - 83662, n=36) | |
| Asus ROG Strix G18 G814JI | |
| AIDA64 / CPU AES | |
| Acer Predator Helios 18 N23Q2 | |
| Alienware m18 R1 AMD | |
| Усредн. модель с Intel Core i9-14900HX (86964 - 241777, n=36) | |
| MSI Titan 18 HX A14VIG | |
| Alienware m18 R1 | |
| Alienware m18 R2 | |
| Asus ROG Strix G18 G814JI | |
| AIDA64 / CPU ZLib | |
| Alienware m18 R1 AMD | |
| MSI Titan 18 HX A14VIG | |
| Alienware m18 R2 | |
| Alienware m18 R1 | |
| Acer Predator Helios 18 N23Q2 | |
| Усредн. модель с Intel Core i9-14900HX (1054 - 2292, n=36) | |
| Asus ROG Strix G18 G814JI | |
| AIDA64 / FP64 Ray-Trace | |
| Alienware m18 R1 AMD | |
| Alienware m18 R1 | |
| Alienware m18 R2 | |
| MSI Titan 18 HX A14VIG | |
| Acer Predator Helios 18 N23Q2 | |
| Усредн. модель с Intel Core i9-14900HX (6809 - 18349, n=36) | |
| Asus ROG Strix G18 G814JI | |
| AIDA64 / CPU PhotoWorxx | |
| Alienware m18 R1 | |
| Acer Predator Helios 18 N23Q2 | |
| Alienware m18 R2 | |
| Усредн. модель с Intel Core i9-14900HX (23903 - 54702, n=36) | |
| Asus ROG Strix G18 G814JI | |
| Alienware m18 R1 AMD | |
| MSI Titan 18 HX A14VIG | |
Стресс-тест
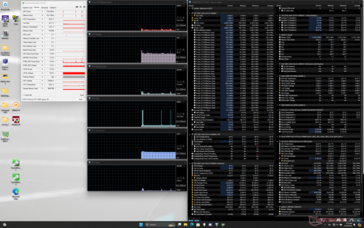
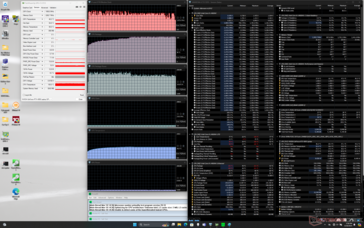
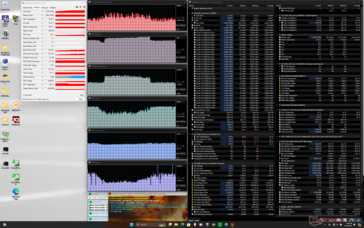
В Prime95 процессор стабилизируется на 100 градусах Цельсия как и у предыдущего m18 R1. Тем не менее, у нового i9-14900HX частота менее стабильна, что и объясняет некоторое отставанием в бенчмарках.
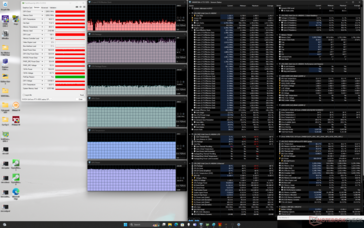
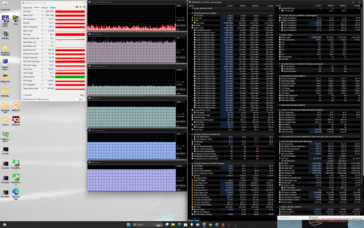
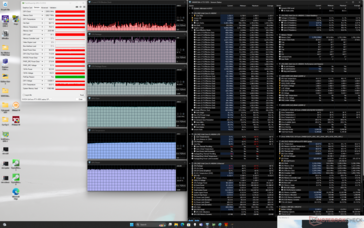
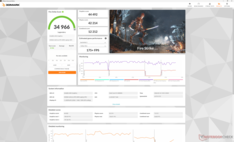
Частота и потребление видеокарты под нагрузкой при переключении профилей Balanced, Performance и Overdrive практически не меняется, что доказывают оценки в Fire Strike.
| Частота ЦП (ГГц) | Частота ГП (МГц) | Средняя температура ЦП (°C) | Средняя температура ГП (°C) | |
| Без нагрузки | -- | -- | 36 | 27 |
| Prime95 | 2.1 - 3.3 | -- | 99 | 46 |
| Prime95 + FurMark | 1.7 - 3.7 | 1350 - 2370 | 74 - 100 | 54 - 61 |
| Witcher 3 (Balanced) | ~1.7 | 2295 | ~84 | 66 |
| Witcher 3 (Performance) | ~1.4 | 2310 | ~82 | 65 |
| Witcher 3 (Overdrive) | ~1.0 | 2310 | ~87 | 64 |
CrossMark: Overall | Productivity | Creativity | Responsiveness
WebXPRT 3: Overall
WebXPRT 4: Overall
Mozilla Kraken 1.1: Total
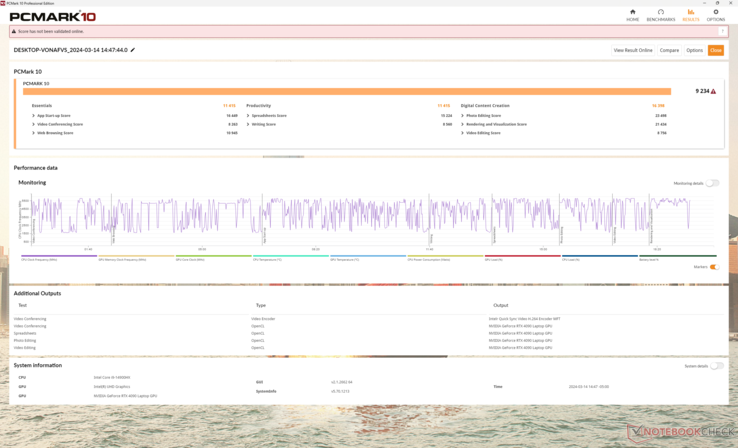
| PCMark 10 / Score | |
| Alienware m18 R1 AMD | |
| Alienware m18 R2 | |
| MSI Titan 18 HX A14VIG | |
| Alienware m18 R1 | |
| Усредн. модель с Intel Core i9-14900HX, NVIDIA GeForce RTX 4090 Laptop GPU (8230 - 9234, n=13) | |
| Acer Predator Helios 18 N23Q2 | |
| Asus ROG Strix G18 G814JI | |
| PCMark 10 / Essentials | |
| Alienware m18 R1 AMD | |
| MSI Titan 18 HX A14VIG | |
| Alienware m18 R2 | |
| Alienware m18 R1 | |
| Усредн. модель с Intel Core i9-14900HX, NVIDIA GeForce RTX 4090 Laptop GPU (10778 - 11628, n=13) | |
| Acer Predator Helios 18 N23Q2 | |
| Asus ROG Strix G18 G814JI | |
| PCMark 10 / Productivity | |
| Alienware m18 R2 | |
| Alienware m18 R1 AMD | |
| Усредн. модель с Intel Core i9-14900HX, NVIDIA GeForce RTX 4090 Laptop GPU (9458 - 11759, n=13) | |
| Acer Predator Helios 18 N23Q2 | |
| MSI Titan 18 HX A14VIG | |
| Alienware m18 R1 | |
| Asus ROG Strix G18 G814JI | |
| PCMark 10 / Digital Content Creation | |
| Alienware m18 R1 AMD | |
| MSI Titan 18 HX A14VIG | |
| Alienware m18 R2 | |
| Alienware m18 R1 | |
| Усредн. модель с Intel Core i9-14900HX, NVIDIA GeForce RTX 4090 Laptop GPU (13219 - 16462, n=13) | |
| Acer Predator Helios 18 N23Q2 | |
| Asus ROG Strix G18 G814JI | |
| CrossMark / Overall | |
| Acer Predator Helios 18 N23Q2 | |
| Alienware m18 R1 | |
| Усредн. модель с Intel Core i9-14900HX, NVIDIA GeForce RTX 4090 Laptop GPU (1877 - 2344, n=10) | |
| Alienware m18 R2 | |
| Alienware m18 R1 AMD | |
| MSI Titan 18 HX A14VIG | |
| CrossMark / Productivity | |
| Acer Predator Helios 18 N23Q2 | |
| Alienware m18 R1 | |
| Усредн. модель с Intel Core i9-14900HX, NVIDIA GeForce RTX 4090 Laptop GPU (1738 - 2162, n=10) | |
| Alienware m18 R2 | |
| Alienware m18 R1 AMD | |
| MSI Titan 18 HX A14VIG | |
| CrossMark / Creativity | |
| Alienware m18 R1 | |
| Acer Predator Helios 18 N23Q2 | |
| Alienware m18 R2 | |
| Усредн. модель с Intel Core i9-14900HX, NVIDIA GeForce RTX 4090 Laptop GPU (2195 - 2660, n=10) | |
| Alienware m18 R1 AMD | |
| MSI Titan 18 HX A14VIG | |
| CrossMark / Responsiveness | |
| Acer Predator Helios 18 N23Q2 | |
| Alienware m18 R1 | |
| Усредн. модель с Intel Core i9-14900HX, NVIDIA GeForce RTX 4090 Laptop GPU (1478 - 2327, n=10) | |
| Alienware m18 R2 | |
| Alienware m18 R1 AMD | |
| MSI Titan 18 HX A14VIG | |
| WebXPRT 3 / Overall | |
| Alienware m18 R1 AMD | |
| Alienware m18 R1 | |
| MSI Titan 18 HX A14VIG | |
| Alienware m18 R2 | |
| Усредн. модель с Intel Core i9-14900HX, NVIDIA GeForce RTX 4090 Laptop GPU (279 - 339, n=10) | |
| Acer Predator Helios 18 N23Q2 | |
| Asus ROG Strix G18 G814JI | |
| Asus ROG Strix G18 G814JI | |
| WebXPRT 4 / Overall | |
| Alienware m18 R2 | |
| Alienware m18 R1 | |
| Alienware m18 R1 AMD | |
| Усредн. модель с Intel Core i9-14900HX, NVIDIA GeForce RTX 4090 Laptop GPU (246 - 309, n=8) | |
| MSI Titan 18 HX A14VIG | |
| Asus ROG Strix G18 G814JI | |
| Asus ROG Strix G18 G814JI | |
| Mozilla Kraken 1.1 / Total | |
| Asus ROG Strix G18 G814JI | |
| Asus ROG Strix G18 G814JI | |
| Alienware m18 R1 AMD | |
| Alienware m18 R1 | |
| Acer Predator Helios 18 N23Q2 | |
| Усредн. модель с Intel Core i9-14900HX, NVIDIA GeForce RTX 4090 Laptop GPU (428 - 535, n=11) | |
| MSI Titan 18 HX A14VIG | |
| Alienware m18 R2 | |
* ... меньше = лучше
| PCMark 10 Score | 9234 баллов | |
? | ||
| AIDA64 / Memory Copy | |
| Alienware m18 R1 | |
| Alienware m18 R2 | |
| Acer Predator Helios 18 N23Q2 | |
| Усредн. модель с Intel Core i9-14900HX (38028 - 83392, n=36) | |
| Asus ROG Strix G18 G814JI | |
| MSI Titan 18 HX A14VIG | |
| Alienware m18 R1 AMD | |
| AIDA64 / Memory Read | |
| Alienware m18 R1 | |
| Acer Predator Helios 18 N23Q2 | |
| Alienware m18 R2 | |
| Усредн. модель с Intel Core i9-14900HX (43306 - 87568, n=36) | |
| Asus ROG Strix G18 G814JI | |
| Alienware m18 R1 AMD | |
| MSI Titan 18 HX A14VIG | |
| AIDA64 / Memory Write | |
| Alienware m18 R1 | |
| Alienware m18 R2 | |
| Acer Predator Helios 18 N23Q2 | |
| Усредн. модель с Intel Core i9-14900HX (37146 - 80589, n=36) | |
| Alienware m18 R1 AMD | |
| Asus ROG Strix G18 G814JI | |
| MSI Titan 18 HX A14VIG | |
| AIDA64 / Memory Latency | |
| MSI Titan 18 HX A14VIG | |
| Alienware m18 R1 AMD | |
| Alienware m18 R2 | |
| Усредн. модель с Intel Core i9-14900HX (76.1 - 105, n=36) | |
| Asus ROG Strix G18 G814JI | |
| Acer Predator Helios 18 N23Q2 | |
| Alienware m18 R1 | |
* ... меньше = лучше
Задержки DPC
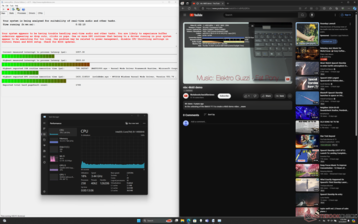
| DPC Latencies / LatencyMon - interrupt to process latency (max), Web, Youtube, Prime95 | |
| Acer Predator Helios 18 N23Q2 | |
| Alienware m18 R2 | |
| Alienware m18 R1 | |
| MSI Titan 18 HX A14VIG | |
| Alienware m18 R1 AMD | |
| Asus ROG Strix G18 G814JI | |
* ... меньше = лучше
Хранение данных
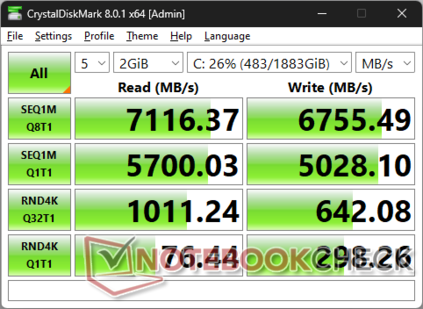
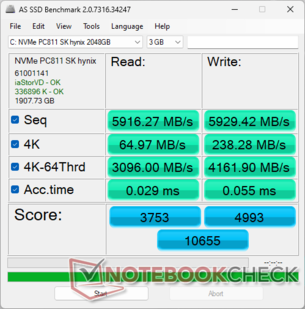
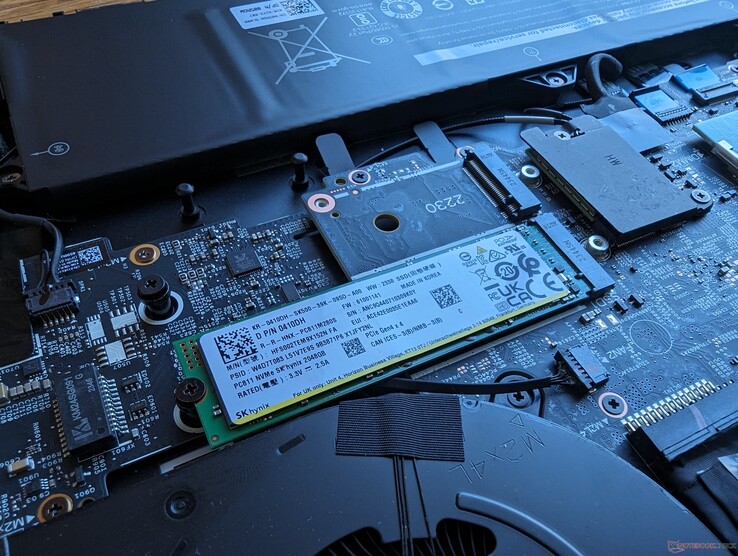
Alienware - один из первых ноутбуков с накопителем SK Hynix PC811 (PCIe4 x4) на 2 ТБ. По сравнению с PC801, PC811 получил чипы памяти 8D NAND с улучшенной эффективностью и вместительностью. Накопитель способен выдавать предельную скорость ~7100 МБ/с даже при длительной нагрузке.
Для ноутбука доступны и накопители объемом 4 ТБ, два из которых в сумме могут дать 8 ТБ дискового пространства.
| Drive Performance rating - Percent | |
| Alienware m18 R2 | |
| Alienware m18 R1 | |
| Acer Predator Helios 18 N23Q2 | |
| MSI Titan 18 HX A14VIG | |
| Alienware m18 R1 AMD | |
| Asus ROG Strix G18 G814JI | |
* ... меньше = лучше
Чтение в DiskSpd, Глубина запроса 8
Видеокарта — 175 Вт TGP
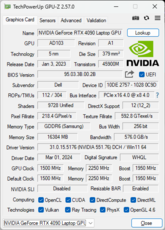
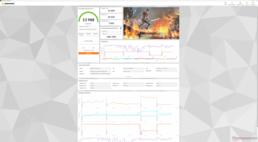
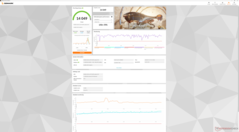
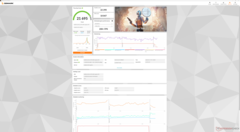
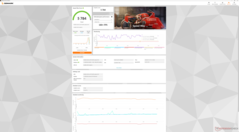
Nvidia GeForce RTX 4090 в данной модели имеет TGP 175 Вт, производительность на таком же уровне, как у предыдущего m18 R1.
| Профиль | Graphics | Physics | Combined |
| Overdrive | 13664 | 42232 | 7665 |
| Performance | 13579 (-0%) | 42217 (-0%) | 7541 (-2%) |
| Balanced | 13449 (-1%) | 40978 (-3%) | 7592 (-1%) |
| Питание от батареи | 5116 (-63%) | 22857 (-46%) | 2102 (-73%) |
Конфигурации на базе RTX 4080, 4070 и 4060 по нашему опыту будут отставать на 5-10%, 30-35% и 45-55% соответственно. Наибольший разрыв по производительности между RTX 4080 и RTX 4070.
| 3DMark Performance rating - Percent | |
| Intel Core i7-14700K -2! | |
| Alienware m18 R1 | |
| MSI Titan 18 HX A14VIG | |
| Alienware m18 R2 | |
| Усредн. модель с NVIDIA GeForce RTX 4090 Laptop GPU | |
| Alienware m18 R1 AMD -1! | |
| Acer Predator Helios 18 N23Q2 -2! | |
| Asus TUF Gaming A17 FA707XI-NS94 | |
| Razer Blade 18 RTX 4070 | |
| Asus ROG Strix G18 G814JI -1! | |
| Acer Nitro 17 AN17-41-R9LN -1! | |
| Schenker XMG Apex 17 (Late 23) | |
| Acer Nitro 17 AN17-51-71ER -2! | |
| 3DMark 11 - 1280x720 Performance GPU | |
| Intel Core i7-14700K | |
| Alienware m18 R1 | |
| Alienware m18 R2 | |
| Усредн. модель с NVIDIA GeForce RTX 4090 Laptop GPU (54073 - 73027, n=42) | |
| MSI Titan 18 HX A14VIG | |
| Alienware m18 R1 AMD | |
| Acer Predator Helios 18 N23Q2 | |
| Asus TUF Gaming A17 FA707XI-NS94 | |
| Asus ROG Strix G18 G814JI | |
| Acer Nitro 17 AN17-41-R9LN | |
| Razer Blade 18 RTX 4070 | |
| Schenker XMG Apex 17 (Late 23) | |
| Acer Nitro 17 AN17-51-71ER | |
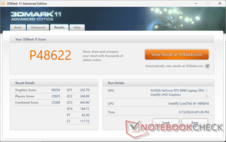
| 3DMark 11 Performance | 48622 баллов | |
| 3DMark Fire Strike Score | 34966 баллов | |
| 3DMark Time Spy Score | 21695 баллов | |
? | ||
* ... меньше = лучше
Игры
Производительность в играх точно такая же, как у m18 R1. RTX 4090 отлично себя чувствует в разрешении 1600p, выдавая более 60 к/с в играх.
| Performance rating - Percent | |
| Alienware m18 R1 | |
| Alienware m18 R2 | |
| MSI Titan 18 HX A14VIG | |
| Acer Predator Helios 18 N23Q2 | |
| Alienware m18 R1 AMD | |
| Asus ROG Strix G18 G814JI | |
| The Witcher 3 - 1920x1080 Ultra Graphics & Postprocessing (HBAO+) | |
| Alienware m18 R1 | |
| MSI Titan 18 HX A14VIG | |
| Alienware m18 R2 | |
| Acer Predator Helios 18 N23Q2 | |
| Alienware m18 R1 AMD | |
| Asus ROG Strix G18 G814JI | |
| GTA V - 1920x1080 Highest AA:4xMSAA + FX AF:16x | |
| Acer Predator Helios 18 N23Q2 | |
| Alienware m18 R1 | |
| MSI Titan 18 HX A14VIG | |
| Alienware m18 R2 | |
| Asus ROG Strix G18 G814JI | |
| Alienware m18 R1 AMD | |
| Final Fantasy XV Benchmark - 1920x1080 High Quality | |
| Alienware m18 R1 | |
| Alienware m18 R2 | |
| MSI Titan 18 HX A14VIG | |
| Acer Predator Helios 18 N23Q2 | |
| Alienware m18 R1 AMD | |
| Asus ROG Strix G18 G814JI | |
| Strange Brigade - 1920x1080 ultra AA:ultra AF:16 | |
| MSI Titan 18 HX A14VIG | |
| Alienware m18 R1 | |
| Alienware m18 R2 | |
| Alienware m18 R1 AMD | |
| Acer Predator Helios 18 N23Q2 | |
| Asus ROG Strix G18 G814JI | |
| Dota 2 Reborn - 1920x1080 ultra (3/3) best looking | |
| Alienware m18 R1 | |
| Acer Predator Helios 18 N23Q2 | |
| MSI Titan 18 HX A14VIG | |
| Alienware m18 R2 | |
| Asus ROG Strix G18 G814JI | |
| Alienware m18 R1 AMD | |
| X-Plane 11.11 - 1920x1080 high (fps_test=3) | |
| Alienware m18 R1 | |
| Alienware m18 R2 | |
| Acer Predator Helios 18 N23Q2 | |
| MSI Titan 18 HX A14VIG | |
| Asus ROG Strix G18 G814JI | |
| Alienware m18 R1 AMD | |
| X-Plane 11.11 | |
| 1920x1080 high (fps_test=3) | |
| Intel Core i7-14700K | |
| Alienware m18 R1 | |
| Alienware m18 R2 | |
| Acer Predator Helios 18 N23Q2 | |
| Razer Blade 18 RTX 4070 | |
| Усредн. модель с NVIDIA GeForce RTX 4090 Laptop GPU (77.8 - 166.2, n=46) | |
| MSI Titan 18 HX A14VIG | |
| Asus ROG Strix G18 G814JI | |
| Acer Nitro 17 AN17-51-71ER | |
| Schenker XMG Apex 17 (Late 23) | |
| Alienware m18 R1 AMD | |
| Asus TUF Gaming A17 FA707XI-NS94 | |
| Acer Nitro 17 AN17-41-R9LN | |
| 3840x2160 high (fps_test=3) | |
| Acer Predator Helios 18 N23Q2 | |
| Intel Core i7-14700K | |
| Alienware m18 R1 | |
| Alienware m18 R2 | |
| Razer Blade 18 RTX 4070 | |
| Усредн. модель с NVIDIA GeForce RTX 4090 Laptop GPU (67.6 - 145.5, n=25) | |
| MSI Titan 18 HX A14VIG | |
| Asus TUF Gaming A17 FA707XI-NS94 | |
| Alienware m18 R1 AMD | |
| Far Cry 5 | |
| 1920x1080 Ultra Preset AA:T | |
| Alienware m18 R2 | |
| Acer Predator Helios 18 N23Q2 | |
| MSI Titan 18 HX A14VIG | |
| Intel Core i7-14700K | |
| Усредн. модель с NVIDIA GeForce RTX 4090 Laptop GPU (117 - 218, n=21) | |
| Asus ROG Strix G18 G814JI | |
| Acer Nitro 17 AN17-51-71ER | |
| Schenker XMG Apex 17 (Late 23) | |
| Alienware m18 R1 AMD | |
| Asus TUF Gaming A17 FA707XI-NS94 | |
| 2560x1440 Ultra Preset AA:T | |
| Acer Predator Helios 18 N23Q2 | |
| Intel Core i7-14700K | |
| Alienware m18 R2 | |
| MSI Titan 18 HX A14VIG | |
| Усредн. модель с NVIDIA GeForce RTX 4090 Laptop GPU (115 - 194, n=23) | |
| Alienware m18 R1 AMD | |
| Asus TUF Gaming A17 FA707XI-NS94 | |
| Schenker XMG Apex 17 (Late 23) | |
| Acer Nitro 17 AN17-51-71ER | |
| 3840x2160 Ultra Preset AA:T | |
| Intel Core i7-14700K | |
| MSI Titan 18 HX A14VIG | |
| Alienware m18 R2 | |
| Alienware m18 R1 AMD | |
| Усредн. модель с NVIDIA GeForce RTX 4090 Laptop GPU (75 - 113, n=13) | |
| Asus TUF Gaming A17 FA707XI-NS94 | |
| Dota 2 Reborn - 3840x2160 ultra (3/3) best looking | |
| Intel Core i7-14700K | |
| Alienware m18 R1 | |
| MSI Titan 18 HX A14VIG | |
| Усредн. модель с NVIDIA GeForce RTX 4090 Laptop GPU (120.2 - 205, n=26) | |
| Alienware m18 R2 | |
| Razer Blade 18 RTX 4070 | |
| Acer Predator Helios 18 N23Q2 | |
| Alienware m18 R1 AMD | |
| Asus TUF Gaming A17 FA707XI-NS94 | |
| Tiny Tina's Wonderlands | |
| 1920x1080 Badass Preset (DX12) | |
| Intel Core i7-14700K | |
| Alienware m18 R1 | |
| Alienware m18 R2 | |
| MSI Titan 18 HX A14VIG | |
| Усредн. модель с NVIDIA GeForce RTX 4090 Laptop GPU (141.1 - 189.4, n=14) | |
| Alienware m18 R1 AMD | |
| Asus TUF Gaming A17 FA707XI-NS94 | |
| 2560x1440 Badass Preset (DX12) | |
| Intel Core i7-14700K | |
| Alienware m18 R1 | |
| Alienware m18 R2 | |
| MSI Titan 18 HX A14VIG | |
| Усредн. модель с NVIDIA GeForce RTX 4090 Laptop GPU (103.4 - 137.8, n=14) | |
| Alienware m18 R1 AMD | |
| Asus TUF Gaming A17 FA707XI-NS94 | |
| 3840x2160 Badass Preset (DX12) | |
| Intel Core i7-14700K | |
| Alienware m18 R1 | |
| Alienware m18 R2 | |
| MSI Titan 18 HX A14VIG | |
| Усредн. модель с NVIDIA GeForce RTX 4090 Laptop GPU (53.3 - 73.7, n=12) | |
| Alienware m18 R1 AMD | |
| Asus TUF Gaming A17 FA707XI-NS94 | |
| Cyberpunk 2077 | |
| 1920x1080 Ultra Preset (FSR off) | |
| Intel Core i7-14700K | |
| Alienware m18 R2 | |
| MSI Titan 18 HX A14VIG | |
| Alienware m18 R1 AMD | |
| Acer Predator Helios 18 N23Q2 | |
| Усредн. модель с NVIDIA GeForce RTX 4090 Laptop GPU (93.1 - 158, n=21) | |
| Asus TUF Gaming A17 FA707XI-NS94 | |
| 2560x1440 Ultra Preset (FSR off) | |
| Intel Core i7-14700K | |
| MSI Titan 18 HX A14VIG | |
| Alienware m18 R2 | |
| Усредн. модель с NVIDIA GeForce RTX 4090 Laptop GPU (68.1 - 103.9, n=21) | |
| Alienware m18 R1 AMD | |
| Acer Predator Helios 18 N23Q2 | |
| Asus TUF Gaming A17 FA707XI-NS94 | |
| 3840x2160 Ultra Preset (FSR off) | |
| Intel Core i7-14700K | |
| MSI Titan 18 HX A14VIG | |
| Alienware m18 R2 | |
| Усредн. модель с NVIDIA GeForce RTX 4090 Laptop GPU (31.6 - 50.6, n=11) | |
| Alienware m18 R1 AMD | |
| Asus TUF Gaming A17 FA707XI-NS94 | |
| 1920x1080 Ray Tracing Ultra Preset (DLSS off) | |
| Intel Core i7-14700K | |
| MSI Titan 18 HX A14VIG | |
| Усредн. модель с NVIDIA GeForce RTX 4090 Laptop GPU (65.5 - 77.7, n=11) | |
| Alienware m18 R2 | |
| Asus TUF Gaming A17 FA707XI-NS94 | |
| Alienware m18 R1 AMD | |
| Strange Brigade | |
| 1920x1080 ultra AA:ultra AF:16 | |
| Intel Core i7-14700K | |
| MSI Titan 18 HX A14VIG | |
| Alienware m18 R1 | |
| Alienware m18 R2 | |
| Усредн. модель с NVIDIA GeForce RTX 4090 Laptop GPU (233 - 421, n=39) | |
| Alienware m18 R1 AMD | |
| Acer Predator Helios 18 N23Q2 | |
| Asus TUF Gaming A17 FA707XI-NS94 | |
| Asus ROG Strix G18 G814JI | |
| Razer Blade 18 RTX 4070 | |
| Acer Nitro 17 AN17-51-71ER | |
| Acer Nitro 17 AN17-41-R9LN | |
| Schenker XMG Apex 17 (Late 23) | |
| 2560x1440 ultra AA:ultra AF:16 | |
| Intel Core i7-14700K | |
| Alienware m18 R2 | |
| Alienware m18 R1 | |
| MSI Titan 18 HX A14VIG | |
| Усредн. модель с NVIDIA GeForce RTX 4090 Laptop GPU (217 - 322, n=38) | |
| Alienware m18 R1 AMD | |
| Acer Predator Helios 18 N23Q2 | |
| Asus TUF Gaming A17 FA707XI-NS94 | |
| Razer Blade 18 RTX 4070 | |
| Acer Nitro 17 AN17-51-71ER | |
| Schenker XMG Apex 17 (Late 23) | |
| 3840x2160 ultra AA:ultra AF:16 | |
| Intel Core i7-14700K | |
| Alienware m18 R2 | |
| Alienware m18 R1 | |
| MSI Titan 18 HX A14VIG | |
| Усредн. модель с NVIDIA GeForce RTX 4090 Laptop GPU (120 - 298, n=24) | |
| Alienware m18 R1 AMD | |
| Asus TUF Gaming A17 FA707XI-NS94 | |
| Razer Blade 18 RTX 4070 | |
Частота кадров, Witcher 3
| мин. | сред. | выс. | макс. | QHD DLSS | QHD | 4K DLSS | 4K | |
|---|---|---|---|---|---|---|---|---|
| GTA V (2015) | 185.2 | 181.6 | 179.6 | 137 | 134.7 | 174.9 | ||
| The Witcher 3 (2015) | 585.5 | 525.8 | 405.6 | 205.7 | 157.7 | |||
| Dota 2 Reborn (2015) | 217 | 190.1 | 181.5 | 171.8 | 160.8 | |||
| Final Fantasy XV Benchmark (2018) | 229 | 199.2 | 193.2 | 160.1 | 93.8 | |||
| X-Plane 11.11 (2018) | 201 | 180.1 | 140.6 | 120.4 | ||||
| Far Cry 5 (2018) | 181 | 171 | 160 | 154 | 112 | |||
| Strange Brigade (2018) | 471 | 387 | 383 | 369 | 309 | 160.2 | ||
| Tiny Tina's Wonderlands (2022) | 348.6 | 285.3 | 227.2 | 187.5 | 132.8 | 71.2 | ||
| F1 22 (2022) | 305 | 295 | 276 | 135.1 | 91.4 | 45.4 | ||
| Baldur's Gate 3 (2023) | 246.9 | 222.5 | 206.7 | 202 | 151.6 | 81.7 | ||
| Cyberpunk 2077 (2023) | 149.3 | 148.7 | 142.9 | 133.9 | 94.1 | 43.4 | ||
| Assassin's Creed Mirage (2023) | 230 | 215 | 205 | 160 | 135 | 110 | 81 | |
| Alan Wake 2 (2023) | 124.6 | 121.4 | 116.9 | 83.1 | 62.3 | 45.2 | ||
| Call of Duty Modern Warfare 3 2023 (2023) | 276 | 255 | 220 | 205 | 160 | 113 | 106 | |
| Avatar Frontiers of Pandora (2023) | 162 | 150 | 131 | 103 | 70 | 63 | 36 | |
| Black Myth: Wukong (2024) | 55 | 62 | 42 | 25 | ||||
| Indiana Jones and the Great Circle (2024) | 121.1 | 95.6 | 60.9 | |||||
| Monster Hunter Wilds (2025) | 78.54 | 76.96 | 66.98 | 42.01 | ||||
| Assassin's Creed Shadows (2025) | 100 | 90 | 77 | 57 | 59 | 50 |
Температурные и акустические показатели
Система охлаждения
Шумность модели не особо изменилась по сравнению с предшественником. Главное, что стоит знать владельцу - шумность охлаждения с профилем Performance и Overdrive выше, чем с Balanced, несмотря на отсутствие заметной разницы в производительности. Это значит что в большинстве случаев можно смело выставлять Balanced или Performance не жертвуя быстродействием. Профиль Overdrive предназначен для разгона.
Уровень шума
| Ожидание |
| 23.8 / 26.1 / 31.5 дБ |
| Нагрузка |
| 31.5 / 56.6 дБ |
 | ||
30 dB бесшумно 40 dB(A) различимо 50 dB(A) громко |
||
min: | ||
| Alienware m18 R2 GeForce RTX 4090 Laptop GPU, i9-14900HX, SK Hynix PC811 HFS002TEM9X152N | Alienware m18 R1 AMD Radeon RX 7900M, R9 7945HX, Kioxia XG8 KXG80ZNV1T02 | Alienware m18 R1 GeForce RTX 4090 Laptop GPU, i9-13980HX, SK hynix PC801 HFS001TEJ9X101N | MSI Titan 18 HX A14VIG GeForce RTX 4090 Laptop GPU, i9-14900HX, 2x Samsung PM9A1a MZVL22T0HDLB (RAID 0) | Asus ROG Strix G18 G814JI GeForce RTX 4070 Laptop GPU, i7-13650HX, Micron 2400 MTFDKBA1T0QFM | Acer Predator Helios 18 N23Q2 GeForce RTX 4080 Laptop GPU, i9-13900HX, Samsung PM9A1 MZVL22T0HBLB | |
|---|---|---|---|---|---|---|
| Уровень шума | 1% | 5% | -3% | -1% | -3% | |
| в выкл. виде (фон) * (dB) | 23.6 | 22.4 5% | 22.8 3% | 22.8 3% | 25 -6% | 23 3% |
| Мин. в простое * (dB) | 23.8 | 23 3% | 23 3% | 23.8 -0% | 26 -9% | 23 3% |
| В простое, сред. * (dB) | 26.1 | 23.4 10% | 23 12% | 23.8 9% | 28 -7% | 23 12% |
| В простое, макс. * (dB) | 31.5 | 33.5 -6% | 23 27% | 28 11% | 29 8% | 23 27% |
| Нагрузка, сред. * (dB) | 31.5 | 33.5 -6% | 35.6 -13% | 38 -21% | 41 -30% | 45.26 -44% |
| Witcher 3 ultra * (dB) | 52.1 | 53.6 -3% | 51.3 2% | 57.3 -10% | 44 16% | 59.82 -15% |
| Нагрузка, макс. * (dB) | 56.6 | 53.6 5% | 56.7 -0% | 62.8 -11% | 46 19% | 59.94 -6% |
* ... меньше = лучше
Нагрев
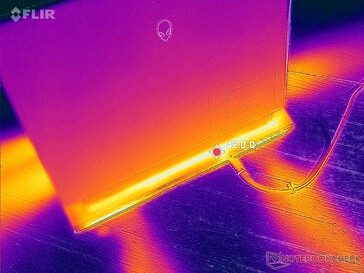
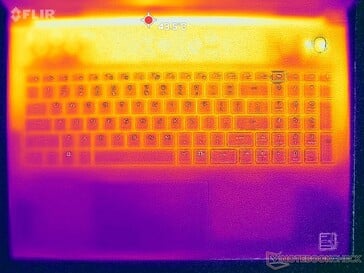
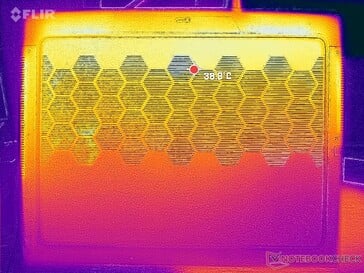
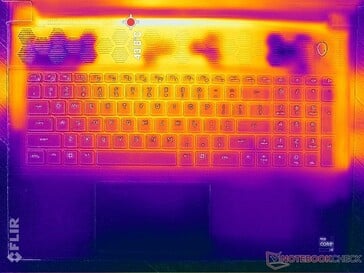
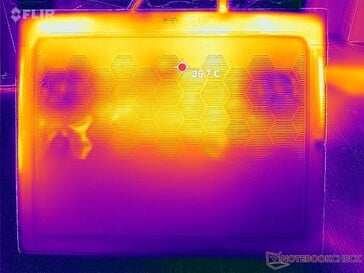
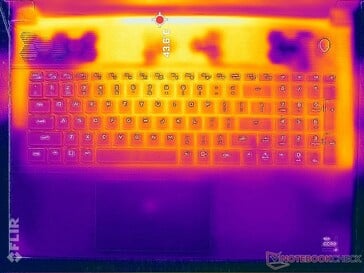
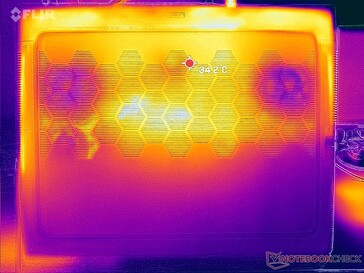
Нагрев корпуса в процессе работы ниже, чем у Asus ROG Strix G18. Больше всего нагревается задняя сторона корпуса, которая максимально удалена от пользователя.
(±) Макс. температура верха корпуса составила 41.2 град. Цельсия. Типичное значение для устройств этого же класса (Gaming) = 40.4 градуса (-ов) при минимуме в 21.2 град. и максимуме в 68.8 град.
(+) Макс. температура дна составила 34.6 град. Цельсия. Типичное значение для устройств этого же класса = 43.3 градуса (-ов).
(±) При отсутствии вычислительной нагрузки верх корпуса нагревается в среднем до 34.9 град. Типичное значение для устройств этого же класса = 33.9 градуса (-ов).
(±) При игре в Ведьмак 3 верх корпуса нагревается в среднем до 32 град. Типичное значение для устройств этого же класса = 33.9 градуса (-ов).
(+) Палуба на ощупь: Прохладно (28.2 град. Цельсия).
(±) Средняя температура палубы у похожих моделей составила 28.8 град. Цельсия, это +0.6 градуса (-ов) разницы.
| Alienware m18 R2 Intel Core i9-14900HX, NVIDIA GeForce RTX 4090 Laptop GPU | Alienware m18 R1 AMD AMD Ryzen 9 7945HX, AMD Radeon RX 7900M | Alienware m18 R1 Intel Core i9-13980HX, NVIDIA GeForce RTX 4090 Laptop GPU | MSI Titan 18 HX A14VIG Intel Core i9-14900HX, NVIDIA GeForce RTX 4090 Laptop GPU | Asus ROG Strix G18 G814JI Intel Core i7-13650HX, NVIDIA GeForce RTX 4070 Laptop GPU | Acer Predator Helios 18 N23Q2 Intel Core i9-13900HX, NVIDIA GeForce RTX 4080 Laptop GPU | |
|---|---|---|---|---|---|---|
| Нагрев | 13% | 17% | 9% | 5% | -4% | |
| Нагрузка, макс. сверху * (°C) | 41.2 | 40.2 2% | 39 5% | 37.8 8% | 45 -9% | 35 15% |
| Нагрузка, макс. на дне * (°C) | 34.6 | 37.4 -8% | 36.4 -5% | 37.6 -9% | 47 -36% | 56 -62% |
| В простое сверху * (°C) | 42.8 | 31.6 26% | 29.2 32% | 34.8 19% | 28 35% | 34 21% |
| В простое на дне * (°C) | 43.6 | 30.6 30% | 27.8 36% | 36 17% | 31 29% | 39 11% |
* ... меньше = лучше
Анализ АЧХ аудиосистемы Alienware m18 R2
(+) | отличный уровень макс. громкости (82.5 дБА)
Низкие частоты (100 Гц - 315 Гц)
(-) | баса почти нет (на 22.1% меньше медианы)
(±) | он умеренно сбалансирован
Средние частоты (400 Гц - 2000 Гц)
(+) | диапазон не провален и не выпячен (отклонение лишь 4.1% от медианы)
(+) | он ровный, без "горбов" или провалов
Высокие частоты (2 кГц - 16 кГц)
(+) | диапазон отлично сбалансирован (отклонение лишь 4% от медианы)
(+) | он ровный, без "горбов" или провалов
Весь диапазон (100 - 16000 Гц)
(±) | звук в целом не очень сбалансирован (17% отличия от медианы)
в сравнении с устройствами того же класса
» 44% прямо сравнимых устройств показал(и) себя лучше, 12% примерно так же, 43% значительно хуже
» Δ наилучшего устройства из прямо сравнимых: 6%, средняя Δ: 18%, худший результат: 132%
в сравнении со всеми тестированными устройствами
» 30% известных нам устройств показал(и) себя лучше, 8% примерно так же, 62% значительно хуже
» Δ наилучшего устройства среди известных нам: 4%, средняя Δ: 24%, худший результат: 134%
Анализ АЧХ аудиосистемы Apple MacBook Pro 16 2021 M1 Pro
(+) | отличный уровень макс. громкости (84.7 дБА)
Низкие частоты (100 Гц - 315 Гц)
(+) | бас отлично сбалансирован (отклонение лишь 3.8% от медианы)
(+) | он ровный, без "горбов" или провалов
Средние частоты (400 Гц - 2000 Гц)
(+) | диапазон не провален и не выпячен (отклонение лишь 1.3% от медианы)
(+) | он ровный, без "горбов" или провалов
Высокие частоты (2 кГц - 16 кГц)
(+) | диапазон отлично сбалансирован (отклонение лишь 1.9% от медианы)
(+) | он ровный, без "горбов" или провалов
Весь диапазон (100 - 16000 Гц)
(+) | звук в целом сбалансирован (4.6% отличия от медианы)
в сравнении с устройствами того же класса
» 0% прямо сравнимых устройств показал(и) себя лучше, 0% примерно так же, 100% значительно хуже
» Δ наилучшего устройства из прямо сравнимых: 5%, средняя Δ: 17%, худший результат: 45%
в сравнении со всеми тестированными устройствами
» 0% известных нам устройств показал(и) себя лучше, 0% примерно так же, 100% значительно хуже
» Δ наилучшего устройства среди известных нам: 4%, средняя Δ: 24%, худший результат: 134%
Энергопотребление и автономная работа
Энергопотребление
В Witcher 3 система потребляет около 328 Вт, что немного больше по сравнению с m18 R1 (Intel). Производительность на ватт у новой модели не изменилась.
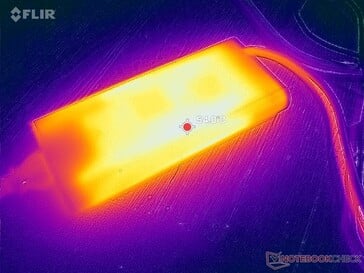
Новый ноутбук комплектуется адаптером питания на 360 Вт, тогда как у предшественника был блок на 330 Вт. Новый адаптер компактнее (~18.9 x 8.6 x 2.6 см против ~19.5 x 9.8 x 4 см) за счет перехода на GaN компоненты. Новый адаптер позволит быстрее заряжать ноутбук.
(Примечание: Наш мультиметр Metrahit Energy в ремонте, потому детальные замеры потребления будут добавлены позже.)
| Выкл. | |
| Ожидание | |
| Нагрузка |
|
Легенда:
min: | |
| Alienware m18 R2 i9-14900HX, GeForce RTX 4090 Laptop GPU, SK Hynix PC811 HFS002TEM9X152N, IPS, 2560x1600, 18" | Alienware m18 R1 AMD R9 7945HX, Radeon RX 7900M, Kioxia XG8 KXG80ZNV1T02, IPS, 1920x1200, 18" | Alienware m18 R1 i9-13980HX, GeForce RTX 4090 Laptop GPU, SK hynix PC801 HFS001TEJ9X101N, IPS, 1920x1200, 18" | MSI Titan 18 HX A14VIG i9-14900HX, GeForce RTX 4090 Laptop GPU, 2x Samsung PM9A1a MZVL22T0HDLB (RAID 0), Mini-LED, 3840x2400, 18" | Asus ROG Strix G18 G814JI i7-13650HX, GeForce RTX 4070 Laptop GPU, Micron 2400 MTFDKBA1T0QFM, IPS, 2560x1600, 18" | Acer Predator Helios 18 N23Q2 i9-13900HX, GeForce RTX 4080 Laptop GPU, Samsung PM9A1 MZVL22T0HBLB, IPS, 2560x1600, 18" | |
|---|---|---|---|---|---|---|
| Энергопотребление | -72% | -21% | -9% | 36% | 13% | |
| В простое, мин. * (Watt) | 10.6 | 30.3 -186% | 21.6 -104% | 13.2 -25% | 8 25% | 16 -51% |
| В простое, сред. * (Watt) | 20.9 | 55.6 -166% | 25.2 -21% | 25.4 -22% | 15 28% | 19 9% |
| В простое, макс. * (Watt) | 40 | 101.1 -153% | 56.7 -42% | 53.5 -34% | 26 35% | 21.3 47% |
| Нагрузка, сред. * (Watt) | 201.1 | 160.3 20% | 164.1 18% | 151.4 25% | 102 49% | 124 38% |
| Witcher 3 ultra * (Watt) | 358 | 216 40% | 311 13% | 336 6% | 178.6 50% | 289 19% |
| Нагрузка, макс. * (Watt) | 378.9 | 332.1 12% | 338.9 11% | 395.2 -4% | 267 30% | 319 16% |
* ... меньше = лучше
Энергопотребление: Witcher 3, Стресс-тест
Энергопотребление с внешним монитором
Автономность
Автономность примерно на пол часа больше, либо на прежнем уровне, в зависимости от теста. У версии на AMD были проблемы с автономной работой, которой нет у варианта на Intel.
Зарядка через USB Type-C не поддерживается.
| Alienware m18 R2 i9-14900HX, GeForce RTX 4090 Laptop GPU, 97 Вт⋅ч | Alienware m18 R1 AMD R9 7945HX, Radeon RX 7900M, 97 Вт⋅ч | Alienware m18 R1 i9-13980HX, GeForce RTX 4090 Laptop GPU, 97 Вт⋅ч | MSI Titan 18 HX A14VIG i9-14900HX, GeForce RTX 4090 Laptop GPU, 99.9 Вт⋅ч | Asus ROG Strix G18 G814JI i7-13650HX, GeForce RTX 4070 Laptop GPU, 90 Вт⋅ч | Acer Predator Helios 18 N23Q2 i9-13900HX, GeForce RTX 4080 Laptop GPU, 90 Вт⋅ч | |
|---|---|---|---|---|---|---|
| Время работы | -71% | -10% | -12% | 69% | -8% | |
| Чтение сайтов по Wi-Fi v.2 (h) | 4.8 | 1.4 -71% | 4.3 -10% | 4.2 -12% | 8.1 69% | 4.4 -8% |
| В простое (h) | 4.5 | 5.6 | 5.9 | 11.7 | ||
| Нагрузка и 100% яркости (h) | 0.7 | 0.7 | 1.2 | 1.2 | 1.7 | |
| Воспр. видео H.264 (h) | 4.8 |
За
Против
Вердикт — Честно будет назвать его Alienware m18 R1.1
Производители игровых ноутбуков в этом году оказались в затруднительном положении. Поколение Raptor Lake-HX Refresh не принесло улучшения производительности, а Nvidia еще не представила наследницу RTX 4090. В результате новые игровые модели, такие как Alienware m18 R2, по большей части идентичны своим прошлогодним версиям. Если вы собираетесь купить Alienware m18 R2, то следует хорошенько подумать, так как Alienware m18 R1 в некоторых случаях быстрее.
Alienware m18 R2 топчется на месте: это все еще один из самых быстрых игровых ноутбуков, однако отличия от предыдущего m18 R1 минимальные
Небольшие улучшения у новой модели все же есть: 5-гигабитный порт Ethernet, более компактный и мощный адаптер питания и более свежий SSD. Однако пользовательский опыт у модели будет ровно такой же, как в случае предшественника.
Alienware m18 R2
- 22 March 2024 v7 (old)
Allen Ngo
Декларация о непредвзятости
Отбор устройств для обзора осуществляется нашей редакцией. Тестовый образец был предоставлен автору производителем или продавцом для целей настоящего обзора. Кредитор не имел никакого влияния на этот обзор, и производитель не получил копию этого обзора до публикации. Обязанности публиковать этот обзор не было. Являясь независимой медиа-компанией, Notebookcheck не подчиняется власти производителей, розничных продавцов или издателей.
Вот как проводит тестирование Notebookcheck
Каждый год Notebookcheck независимо проверяет сотни ноутбуков и смартфонов, используя стандартизированные процедуры, чтобы гарантировать сопоставимость всех результатов. В течение примерно 20 лет мы постоянно совершенствовали наши методы испытаний и при этом установили отраслевые стандарты. В наших испытательных лабораториях опытные специалисты и редакторы используют высококачественное измерительное оборудование. Эти тесты включают в себя многоэтапный процесс проверки. Наша сложная рейтинговая система основана на сотнях обоснованных измерений и критериев, что обеспечивает объективность.


