Вердикт: Ryzen 7 9850X3D - это 9800X3D, который должен был быть
Ryzen 7 9800X3D завоевал культовый статус среди компьютерных геймеров, и компания AMD явно не собирается выжимать лимон перед выходом Zen 6 в начале следующего года.
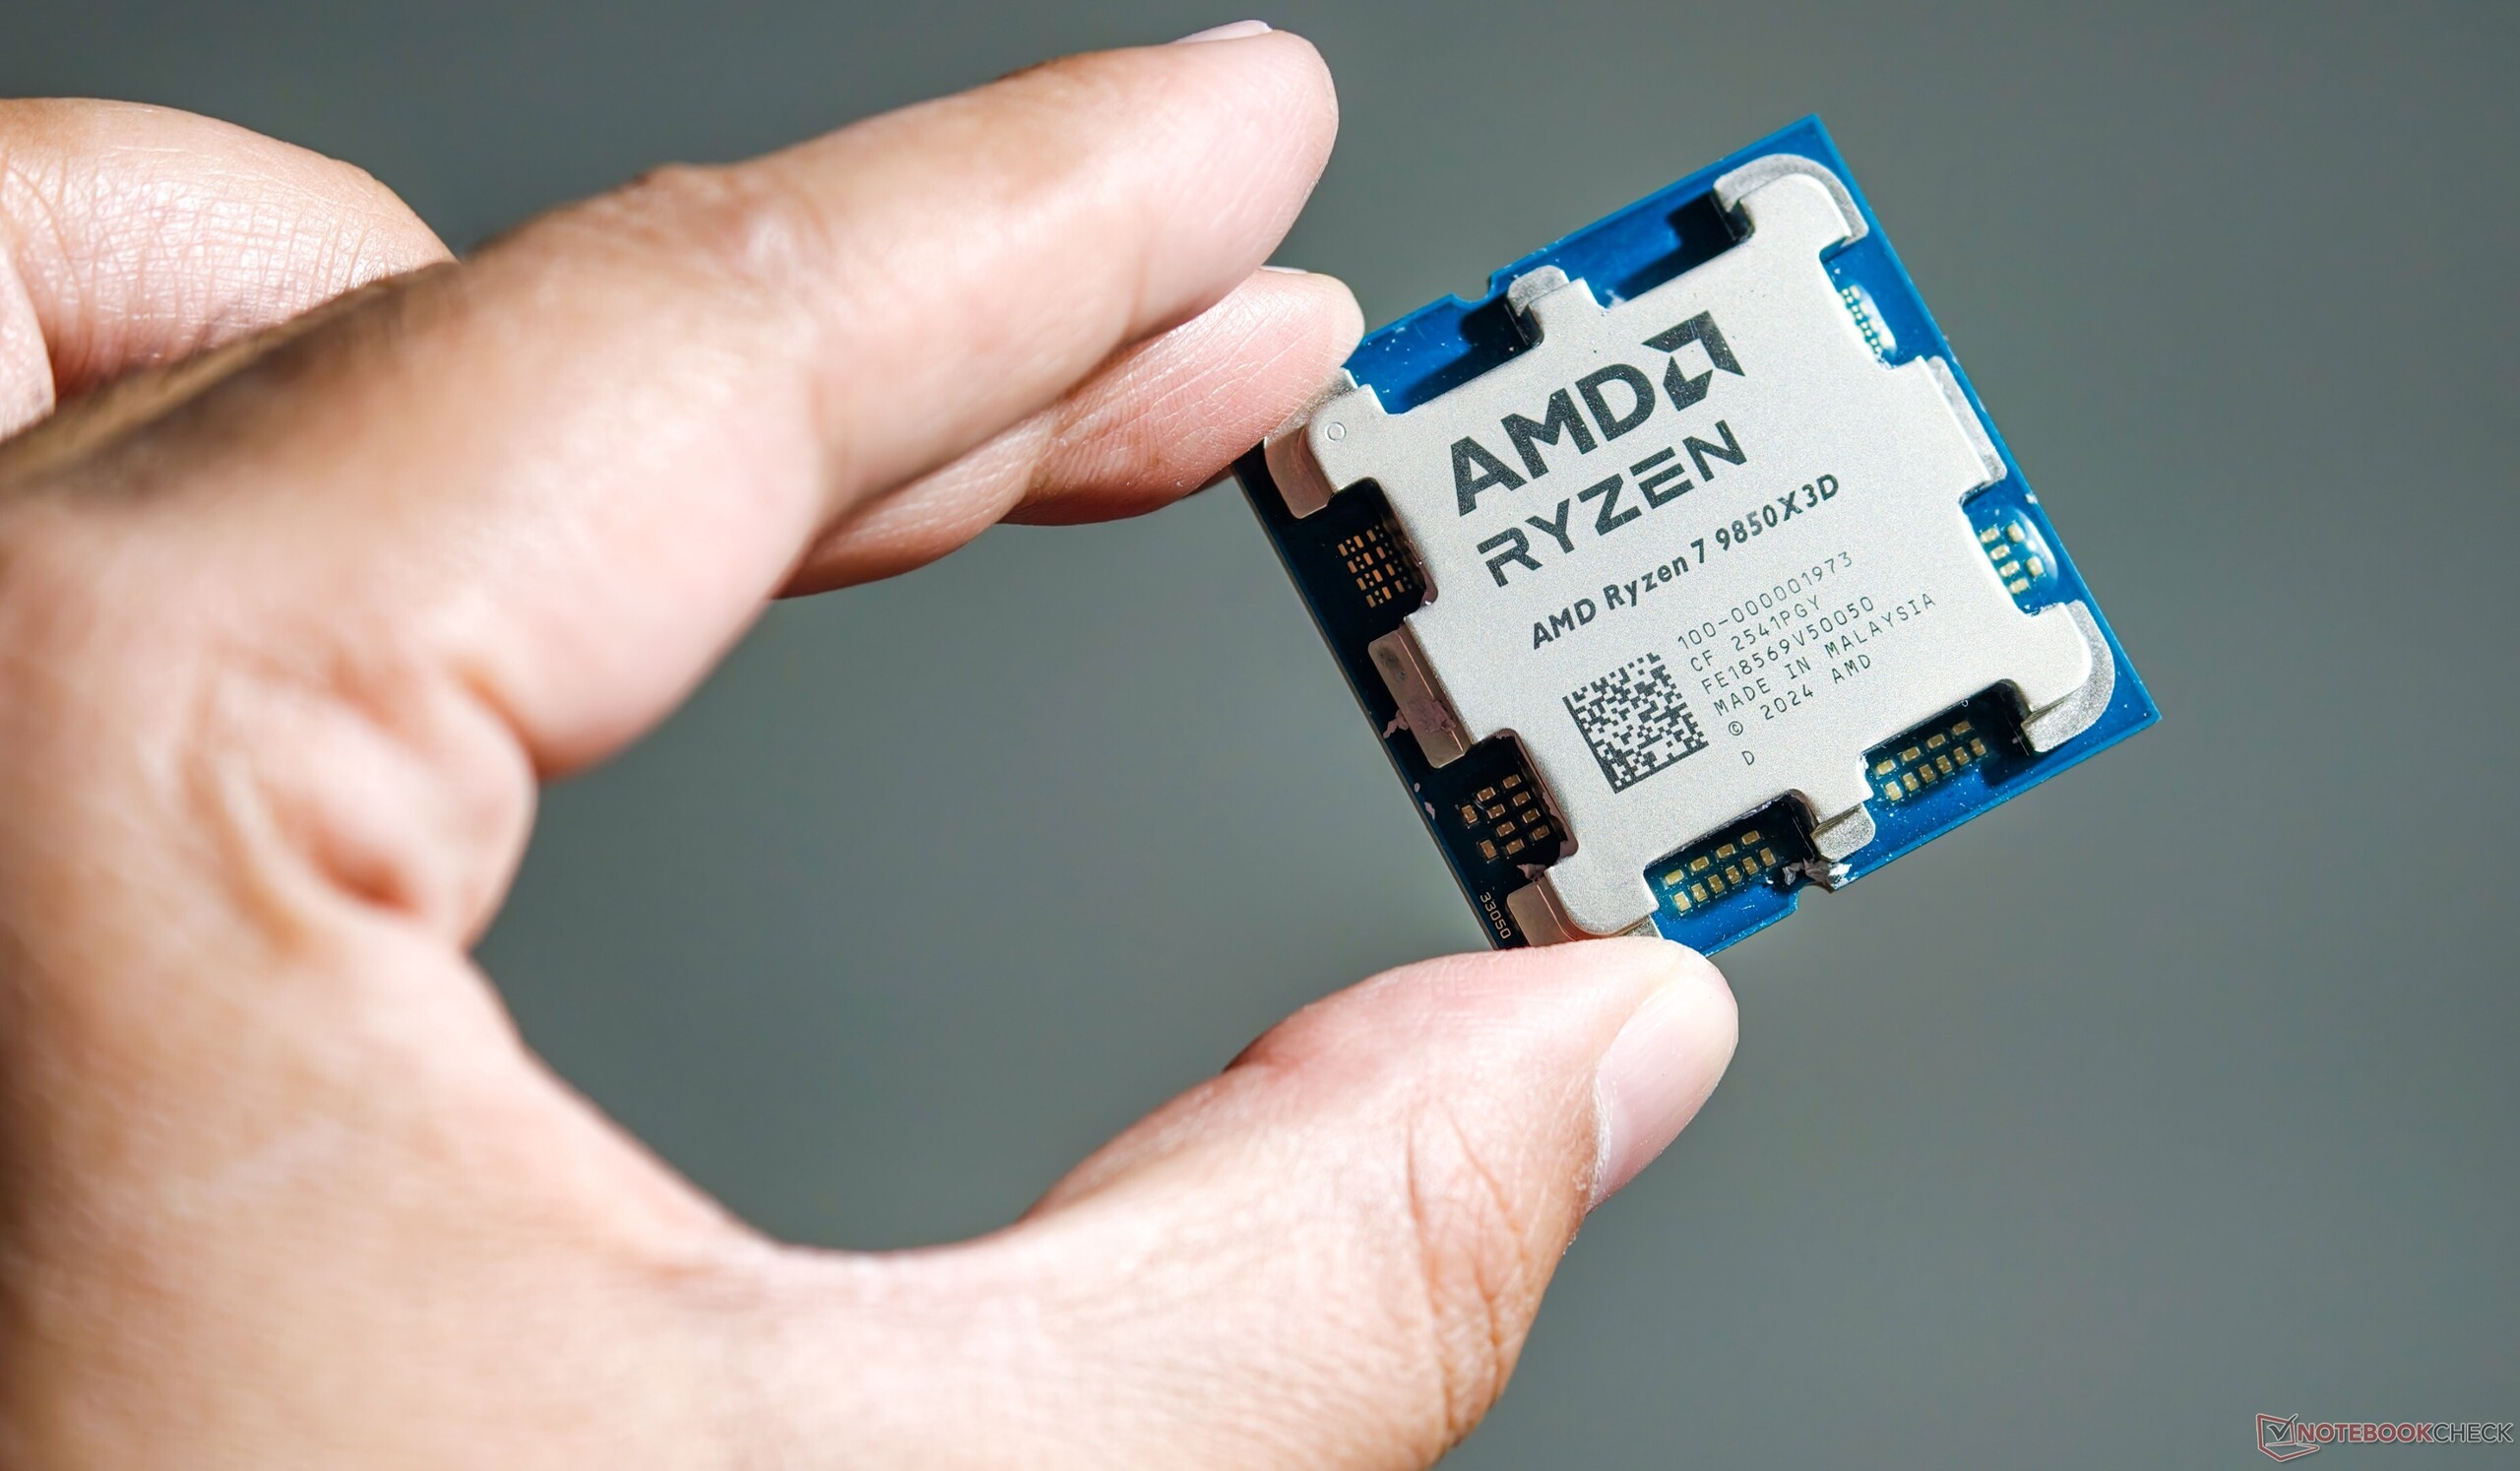
Таким образом, мы имеем новый AMD Ryzen 7 9850X3D, который, по сути, является просто улучшенным 9800X3D с немного более высокими тактовыми частотами.
Общий прирост производительности процессора по сравнению с Ryzen 7 9800X3D минимален, а энергопотребление немного выше. Одноядерные показатели в целом конкурентоспособны с другими частями Zen 5 и Arrow Lake-S, но новые процессоры Intel Core Ultra 200S Plus абсолютно уничтожают Ryzen 7 9850X3D в многоядерных рабочих нагрузках.
В чем Ryzen 7 9850X3D заслуживает признания, так это в играх, которые, в конце концов, и являются смыслом существования 3D V-Cache. В отличие от Ryzen 9 9950X3D, здесь имеется только один ПЗК 3D V-cache, поэтому геймерам не нужно крутить пальцами в надежде, что ОС назначит нужные ядра для игр.
Однако превосходство над Ryzen 7 9800X3D остается незначительным и не оправдывает обновления даже для требовательных игроков.
Энергопотребление в играх немного ниже, чем у 9800X3D, но последний немного эффективнее.
Высококлассные процессоры Zen 5 без X3D остаются отличным выбором для универсальной производительности и игр. По цене 200 и 300 долларов новые Core Ultra 200S Plus несомненно подойдут Вам, если Вы отдаете предпочтение многоядерной производительности и играете преимущественно в QHD или 4K на ультра настройках.
Однако если Вам нужен абсолютный зверь среди игровых процессоров, то AMD Ryzen 7 9850X3D должен стать Вашим первым выбором. Только не стоит менять свой Ryzen 7 9800X3D на этот процессор, так как Вы заплатите на 20 долларов больше за 2-3% прироста в лучшем случае.
Более разумным вариантом будет выбор старшей модели Ryzen 7 7800X3D, которая обеспечит почти такую же игровую производительность, как и Ryzen 7 9850X3D, и сэкономит при этом 115 долларов.
За
Против
Оглавление
- Вердикт: Ryzen 7 9850X3D - это 9800X3D, который должен был быть
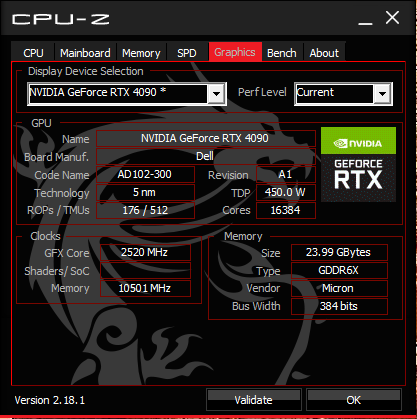
- Тестовый стенд: Ryzen 7 9850X3D отлично сочетается с GeForce RTX 4090
- Производительность процессора: Не сравнится с Core Ultra 200S Plus в многоядерном режиме
- Производительность системы: Прямо по пятам Ryzen 9 9950X3D
- 3D и игровая производительность: Незначительные преимущества над Ryzen 7 9800X3D
- Энергопотребление: На этот раз корона эффективности досталась Intel
- Впечатления Notebookcheck от AMD Ryzen 7 9850X3D
Компания AMD добилась хороших успехов со своей линейкой X3D со времен выхода первого Ryzen 7 5800X3D. В поколении Zen 5 компания уже представила Ryzen 7 9800X3D, Ryzen 9 9900X3D и Ryzen 9 9950X3D.
Теперь у нас есть новый Ryzen 7 9850X3D.
Анонсированный на CES 2026ryzen 7 9850X3D - это практически тот же самый процессор, но с улучшенной корзиной и увеличенной до 5,6 ГГц частотой за 20 долларов.
Обзор настольных процессоров AMD Zen 5 "Granite Ridge" Ryzen 9000
| SKU | Ядра / потоки | Базовый тактовый генератор | Турбо тактовый генератор | L2 Cache | L3 Cache | TDP | Мощность в гнезде по умолчанию (PPT) | Начальная цена (SEP) |
|---|---|---|---|---|---|---|---|---|
| Ryzen 9 9950X3D | 16 / 32 | 4,3 ГГц | 5,7 ГГц | 16x 1 МБ | 128 МБ | 170 Вт | 200 Вт | $699 |
| Ryzen 9 9950X | 16 / 32 | 4,3 ГГц | 5,7 ГГц | 16x 1 МБ | 64 МБ | 170 Вт | 200 Вт | $649 |
| Ryzen 9 9900X3D | 12 / 24 | 4,4 ГГц | 5,5 ГГц | 12x 1 МБ | 128 МБ | 120 Вт | 162 Вт | $599 |
| Ryzen 9 9900X | 12 / 24 | 4.4 ГГц | 5.6 ГГц | 12x 1 МБ | 64 МБ | 120 Вт | 162 Вт | $499 |
| Ryzen 7 9850X3D | 8/ 16 | 4,7 ГГц | 5,6 ГГц | 8x1 МБ | 96 МБ | 120 Вт | 162 Вт | $499 |
| Ryzen 7 9800X3D | 8 / 16 | 4,7 ГГц | 5,2 ГГц | 8x 1 МБ | 96 МБ | 120 Вт | 162 Вт | $479 |
| Ryzen 7 9700X | 8 / 16 | 3,8 ГГц | 5,5 ГГц | 8x 1 МБ | 32 МБ | 65 Вт | 88 Вт | $359 |
| Ryzen 5 9600X | 6 / 12 | 3,9 ГГц | 5,4 ГГц | 6x 1 МБ | 32 МБ | 65 Вт | 88 Вт | $279 |
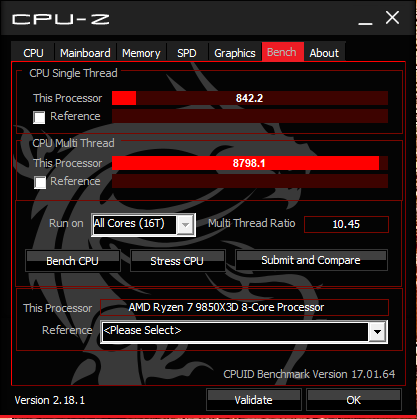
Тестовый стенд: Ryzen 7 9850X3D отлично сочетается с GeForce RTX 4090
Наш тестовый стенд AMD Ryzen 7 9850X3D состоит из следующих компонентов:
- Открытый тестовый стенд Cooler Master MasterFrame 700
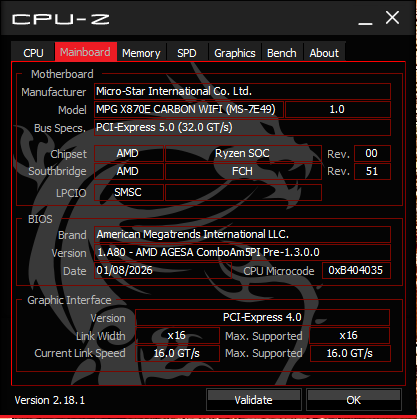
- Материнская плата MSI MAG X870E Carbon Wi-Fi с BIOS 1.A80 (AGESA ComboAM5PI Pre-1.3.0.0)
- Nvidia GeForce RTX 4090 Founders Edition GPU
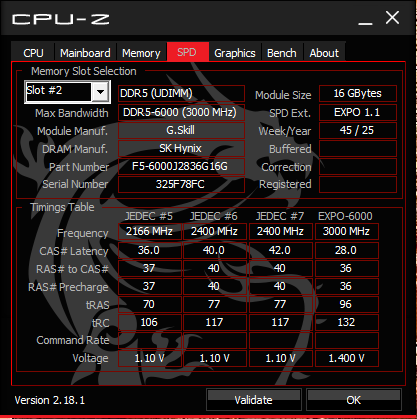
- 2x 16 ГБ оперативной памяти G.Skill Trident Z5 Neo RGB DDR5-6000, работающей в профиле EXPO-6000 с таймингами 28-36-36-96 при 1,40 В
- Твердотельный накопитель Samsung 990 Pro 1 ТБ PCIe Gen 4 NVMe для ОС, бенчмарков и игр
- Монитор Alienware AW3225QF 4K 240 Гц QD-OLED
- Кулер Cooler Master MasterLiquid ML360L V2 ARGB AiO
- Полностью модульный БП Cooler Master MVE Gold V2 1250 ATX 3.0

Мы хотели бы поблагодарить компанию AMD за предоставленный тестовый образец Ryzen 7 9850X3D, материнскую плату, SSD и память DDR5, компанию Nvidia за графический процессор RTX 4090 Founders Edition, компанию Dell за монитор AW3225QF, и, наконец, компанию Cooler Master за тестовый стенд, кулер AiO и блок питания.
Все тесты проводились на свежей установке Windows 11 25H2 (Build 26200.7920) вместе с драйверами чипсета AMD 8.02.18.557 и Nvidia Game Ready Driver 595.97.
Производительность процессора: Не сравнится с Core Ultra 200S Plus в многоядерном режиме
Как и ожидалось, Ryzen 7 9850X3D показывает лишь незначительный 3% прирост по сравнению с Ryzen 7 9800X3D в суммарной производительности процессора. Тем не менее, он выигрывает 13% у Core Ultra 7 270K Plus когда учитываются все тесты CPU.
Одноядерные тесты Cinebench ставят Ryzen 7 9850X3D на один уровень с другими процессорами Zen 5 и Arrow Lake/Refresh. Однако даже Core Ultra 5 250K Plus за 199 долларов может показать преимущество до 37% над Ryzen 7 9850X3D в многоядерных тестах Cinebench, благодаря большему количеству ядер/потоков.
В одноядерных тестах Geekbench разница между Ryzen 7 9850X3D и Core Ultra 7 270K Plus еще больше сокращается. Несмотря на это, новейший X3D-компьютер AMD среднего уровня все еще не может сравниться с чипами Arrow Lake/Refresh от Intel в многоядерном компоненте бенчмарка.
| CPU Performance rating - Percent | |
| AMD Ryzen 9 7950X -4! | |
| AMD Ryzen 9 9950X3D | |
| Intel Core Ultra 7 270K Plus | |
| AMD Ryzen 9 7950X3D -2! | |
| Intel Core i9-13900K -2! | |
| AMD Ryzen 9 9950X | |
| Intel Core Ultra 9 285K | |
| Intel Core i9-14900K -1! | |
| AMD Ryzen 9 9900X -1! | |
| AMD Ryzen 9 7900X -4! | |
| Intel Core i7-14700K | |
| AMD Ryzen 7 9850X3D | |
| Intel Core Ultra 5 250K Plus | |
| AMD Ryzen 7 9800X3D | |
| Intel Core i9-12900K -3! | |
| AMD Ryzen 7 7800X3D -5! | |
| AMD Ryzen 7 9700X | |
| Intel Core i5-13600K -2! | |
| Intel Core Ultra 5 245K | |
| Intel Core i5-14600K | |
| AMD Ryzen 5 9600X -2! | |
| Intel Core i5-12600K -5! | |
| Cinebench R15 | |
| CPU Single 64Bit | |
| Intel Core Ultra 9 285K | |
| Intel Core Ultra 7 270K Plus | |
| AMD Ryzen 9 9900X | |
| AMD Ryzen 9 9950X3D | |
| AMD Ryzen 7 9700X | |
| AMD Ryzen 9 9950X | |
| AMD Ryzen 7 9850X3D | |
| AMD Ryzen 5 9600X | |
| Intel Core i9-14900K | |
| AMD Ryzen 9 7950X | |
| AMD Ryzen 7 9800X3D | |
| Intel Core Ultra 5 250K Plus | |
| Intel Core i9-13900K | |
| AMD Ryzen 9 7950X3D | |
| AMD Ryzen 9 7900X | |
| Intel Core Ultra 5 245K | |
| Intel Core i7-14700K | |
| Intel Core i5-14600K | |
| AMD Ryzen 7 7800X3D | |
| Intel Core i5-13600K | |
| Intel Core i9-12900K | |
| Intel Core i5-12600K | |
| CPU Multi 64Bit | |
| Intel Core Ultra 7 270K Plus | |
| Intel Core Ultra 9 285K | |
| AMD Ryzen 9 9950X3D | |
| AMD Ryzen 9 9950X | |
| Intel Core i9-14900K | |
| AMD Ryzen 9 7950X | |
| Intel Core i9-13900K | |
| AMD Ryzen 9 7950X3D | |
| Intel Core i7-14700K | |
| AMD Ryzen 9 9900X | |
| AMD Ryzen 9 7900X | |
| Intel Core Ultra 5 250K Plus | |
| Intel Core i9-12900K | |
| Intel Core Ultra 5 245K | |
| AMD Ryzen 7 9800X3D | |
| Intel Core i5-13600K | |
| Intel Core i5-14600K | |
| AMD Ryzen 7 9850X3D | |
| AMD Ryzen 7 9700X | |
| AMD Ryzen 7 7800X3D | |
| AMD Ryzen 5 9600X | |
| Intel Core i5-12600K | |
| Cinebench R20 | |
| CPU (Single Core) | |
| Intel Core Ultra 7 270K Plus | |
| Intel Core Ultra 9 285K | |
| Intel Core i9-14900K | |
| AMD Ryzen 9 9950X3D | |
| AMD Ryzen 9 9900X | |
| AMD Ryzen 7 9850X3D | |
| AMD Ryzen 9 9950X | |
| AMD Ryzen 7 9700X | |
| AMD Ryzen 5 9600X | |
| Intel Core Ultra 5 250K Plus | |
| Intel Core i7-14700K | |
| Intel Core i9-13900K | |
| Intel Core Ultra 5 245K | |
| AMD Ryzen 7 9800X3D | |
| AMD Ryzen 9 7950X | |
| AMD Ryzen 9 7950X3D | |
| Intel Core i5-14600K | |
| AMD Ryzen 9 7900X | |
| Intel Core i5-13600K | |
| Intel Core i9-12900K | |
| Intel Core i5-12600K | |
| AMD Ryzen 7 7800X3D | |
| CPU (Multi Core) | |
| Intel Core Ultra 7 270K Plus | |
| Intel Core Ultra 9 285K | |
| AMD Ryzen 9 9950X3D | |
| AMD Ryzen 9 9950X | |
| Intel Core i9-14900K | |
| Intel Core i9-13900K | |
| AMD Ryzen 9 7950X | |
| AMD Ryzen 9 7950X3D | |
| Intel Core i7-14700K | |
| AMD Ryzen 9 9900X | |
| Intel Core Ultra 5 250K Plus | |
| AMD Ryzen 9 7900X | |
| Intel Core i9-12900K | |
| Intel Core Ultra 5 245K | |
| Intel Core i5-14600K | |
| Intel Core i5-13600K | |
| AMD Ryzen 7 9800X3D | |
| AMD Ryzen 7 9850X3D | |
| AMD Ryzen 7 9700X | |
| AMD Ryzen 7 7800X3D | |
| AMD Ryzen 5 9600X | |
| Intel Core i5-12600K | |
| Cinebench R23 | |
| Single Core | |
| Intel Core Ultra 7 270K Plus | |
| Intel Core Ultra 9 285K | |
| Intel Core i9-14900K | |
| Intel Core i9-13900K | |
| Intel Core Ultra 5 250K Plus | |
| AMD Ryzen 9 9950X3D | |
| AMD Ryzen 9 9900X | |
| AMD Ryzen 7 9850X3D | |
| AMD Ryzen 7 9700X | |
| AMD Ryzen 9 9950X | |
| AMD Ryzen 5 9600X | |
| Intel Core i7-14700K | |
| Intel Core Ultra 5 245K | |
| AMD Ryzen 7 9800X3D | |
| Intel Core i5-14600K | |
| AMD Ryzen 9 7950X3D | |
| AMD Ryzen 9 7950X | |
| AMD Ryzen 9 7900X | |
| Intel Core i5-13600K | |
| Intel Core i9-12900K | |
| Intel Core i5-12600K | |
| AMD Ryzen 7 7800X3D | |
| Multi Core | |
| Intel Core Ultra 7 270K Plus | |
| Intel Core Ultra 9 285K | |
| AMD Ryzen 9 9950X3D | |
| Intel Core i9-14900K | |
| AMD Ryzen 9 9950X | |
| Intel Core i9-13900K | |
| AMD Ryzen 9 7950X | |
| AMD Ryzen 9 7950X3D | |
| Intel Core i7-14700K | |
| AMD Ryzen 9 9900X | |
| Intel Core Ultra 5 250K Plus | |
| AMD Ryzen 9 7900X | |
| Intel Core i9-12900K | |
| Intel Core Ultra 5 245K | |
| Intel Core i5-14600K | |
| Intel Core i5-13600K | |
| AMD Ryzen 7 9800X3D | |
| AMD Ryzen 7 9850X3D | |
| AMD Ryzen 7 9700X | |
| AMD Ryzen 7 7800X3D | |
| Intel Core i5-12600K | |
| AMD Ryzen 5 9600X | |
| Cinebench 2024 | |
| CPU Single Core | |
| Intel Core Ultra 7 270K Plus | |
| Intel Core Ultra 9 285K | |
| AMD Ryzen 7 9850X3D | |
| AMD Ryzen 9 9950X3D | |
| AMD Ryzen 9 9900X | |
| Intel Core i9-14900K | |
| AMD Ryzen 7 9700X | |
| AMD Ryzen 9 9950X | |
| Intel Core Ultra 5 250K Plus | |
| AMD Ryzen 5 9600X | |
| Intel Core Ultra 5 245K | |
| AMD Ryzen 7 9800X3D | |
| Intel Core i7-14700K | |
| Intel Core i5-14600K | |
| CPU Multi Core | |
| Intel Core Ultra 7 270K Plus | |
| Intel Core Ultra 9 285K | |
| AMD Ryzen 9 9950X3D | |
| Intel Core i9-14900K | |
| AMD Ryzen 9 9950X | |
| Intel Core i7-14700K | |
| Intel Core Ultra 5 250K Plus | |
| AMD Ryzen 9 9900X | |
| Intel Core Ultra 5 245K | |
| Intel Core i5-14600K | |
| AMD Ryzen 7 9800X3D | |
| AMD Ryzen 7 9850X3D | |
| AMD Ryzen 7 9700X | |
| AMD Ryzen 5 9600X | |
| Blender - v2.79 BMW27 CPU | |
| Intel Core i5-12600K | |
| AMD Ryzen 5 9600X | |
| AMD Ryzen 7 7800X3D | |
| AMD Ryzen 7 9700X | |
| AMD Ryzen 7 9850X3D | |
| AMD Ryzen 7 9800X3D | |
| Intel Core Ultra 5 245K | |
| Intel Core i5-13600K | |
| Intel Core i5-14600K | |
| Intel Core i9-12900K | |
| AMD Ryzen 9 7900X | |
| Intel Core Ultra 5 250K Plus | |
| AMD Ryzen 9 9900X | |
| Intel Core i7-14700K | |
| AMD Ryzen 9 7950X3D | |
| AMD Ryzen 9 7950X | |
| Intel Core i9-13900K | |
| Intel Core i9-14900K | |
| Intel Core Ultra 9 285K | |
| AMD Ryzen 9 9950X | |
| Intel Core Ultra 7 270K Plus | |
| AMD Ryzen 9 9950X3D | |
| HWBOT x265 Benchmark v2.2 - 4k Preset | |
| AMD Ryzen 9 9950X3D | |
| Intel Core Ultra 7 270K Plus | |
| Intel Core Ultra 9 285K | |
| AMD Ryzen 9 9950X | |
| AMD Ryzen 9 7950X | |
| Intel Core i9-14900K | |
| Intel Core i9-13900K | |
| AMD Ryzen 9 7950X3D | |
| AMD Ryzen 9 9900X | |
| Intel Core i7-14700K | |
| AMD Ryzen 9 7900X | |
| Intel Core Ultra 5 250K Plus | |
| AMD Ryzen 7 9800X3D | |
| Intel Core i5-12600K | |
| Intel Core i9-12900K | |
| AMD Ryzen 7 9850X3D | |
| Intel Core Ultra 5 245K | |
| Intel Core i5-14600K | |
| Intel Core i5-13600K | |
| AMD Ryzen 7 9700X | |
| AMD Ryzen 7 7800X3D | |
| AMD Ryzen 5 9600X | |
| Geekbench 5.5 | |
| Single-Core | |
| AMD Ryzen 7 9850X3D | |
| AMD Ryzen 9 9950X | |
| AMD Ryzen 9 9950X3D | |
| AMD Ryzen 9 9900X | |
| AMD Ryzen 5 9600X | |
| AMD Ryzen 7 9700X | |
| AMD Ryzen 7 9800X3D | |
| Intel Core Ultra 7 270K Plus | |
| Intel Core Ultra 9 285K | |
| Intel Core Ultra 5 250K Plus | |
| AMD Ryzen 9 7950X | |
| AMD Ryzen 9 7950X3D | |
| Intel Core i9-13900K | |
| AMD Ryzen 9 7900X | |
| Intel Core i9-14900K | |
| Intel Core Ultra 5 245K | |
| Intel Core i7-14700K | |
| Intel Core i9-12900K | |
| AMD Ryzen 7 7800X3D | |
| Intel Core i5-14600K | |
| Intel Core i5-13600K | |
| Intel Core i5-12600K | |
| Multi-Core | |
| Intel Core Ultra 7 270K Plus | |
| Intel Core Ultra 9 285K | |
| Intel Core i9-14900K | |
| AMD Ryzen 9 9950X3D | |
| AMD Ryzen 9 7950X | |
| AMD Ryzen 9 7950X3D | |
| Intel Core i9-13900K | |
| AMD Ryzen 9 9950X | |
| Intel Core i7-14700K | |
| Intel Core Ultra 5 250K Plus | |
| AMD Ryzen 9 9900X | |
| AMD Ryzen 9 7900X | |
| Intel Core i9-12900K | |
| Intel Core Ultra 5 245K | |
| Intel Core i5-14600K | |
| AMD Ryzen 7 9850X3D | |
| Intel Core i5-13600K | |
| AMD Ryzen 7 9800X3D | |
| AMD Ryzen 7 9700X | |
| AMD Ryzen 7 7800X3D | |
| Intel Core i5-12600K | |
| AMD Ryzen 5 9600X | |
| Geekbench 6.7 | |
| Single-Core | |
| Intel Core Ultra 7 270K Plus | |
| AMD Ryzen 7 9850X3D | |
| AMD Ryzen 9 9950X3D | |
| AMD Ryzen 9 9900X | |
| AMD Ryzen 9 9950X | |
| AMD Ryzen 7 9700X | |
| Intel Core Ultra 9 285K | |
| AMD Ryzen 7 9800X3D | |
| Intel Core i9-14900K | |
| Intel Core Ultra 5 250K Plus | |
| Intel Core i9-13900K | |
| Intel Core Ultra 5 245K | |
| AMD Ryzen 9 7950X3D | |
| Intel Core i7-14700K | |
| Intel Core i5-14600K | |
| Intel Core i5-13600K | |
| Intel Core i9-12900K | |
| Multi-Core | |
| Intel Core Ultra 7 270K Plus | |
| AMD Ryzen 9 9950X3D | |
| Intel Core Ultra 9 285K | |
| Intel Core i9-14900K | |
| AMD Ryzen 9 9950X | |
| Intel Core Ultra 5 250K Plus | |
| Intel Core i9-13900K | |
| AMD Ryzen 9 9900X | |
| AMD Ryzen 9 7950X3D | |
| Intel Core i7-14700K | |
| AMD Ryzen 7 9850X3D | |
| AMD Ryzen 7 9800X3D | |
| Intel Core Ultra 5 245K | |
| Intel Core i9-12900K | |
| Intel Core i5-14600K | |
| AMD Ryzen 7 9700X | |
| Intel Core i5-13600K | |
| 7-Zip 18.03 | |
| 7z b 4 | |
| AMD Ryzen 9 9950X3D | |
| AMD Ryzen 9 7950X | |
| AMD Ryzen 9 9950X | |
| AMD Ryzen 9 7950X3D | |
| Intel Core i9-14900K | |
| Intel Core i9-13900K | |
| Intel Core Ultra 7 270K Plus | |
| Intel Core i7-14700K | |
| Intel Core Ultra 9 285K | |
| AMD Ryzen 9 7900X | |
| AMD Ryzen 9 9900X | |
| Intel Core i9-12900K | |
| Intel Core i5-14600K | |
| AMD Ryzen 7 9850X3D | |
| AMD Ryzen 7 9800X3D | |
| Intel Core i5-13600K | |
| AMD Ryzen 7 7800X3D | |
| AMD Ryzen 7 9700X | |
| Intel Core Ultra 5 245K | |
| AMD Ryzen 5 9600X | |
| Intel Core i5-12600K | |
| Intel Core Ultra 5 250K Plus | |
| 7z b 4 -mmt1 | |
| AMD Ryzen 7 9850X3D | |
| AMD Ryzen 7 9800X3D | |
| AMD Ryzen 9 7950X | |
| AMD Ryzen 9 7950X3D | |
| AMD Ryzen 9 7900X | |
| AMD Ryzen 7 7800X3D | |
| AMD Ryzen 9 9900X | |
| AMD Ryzen 7 9700X | |
| AMD Ryzen 9 9950X | |
| AMD Ryzen 5 9600X | |
| AMD Ryzen 9 9950X3D | |
| Intel Core i9-14900K | |
| Intel Core Ultra 7 270K Plus | |
| Intel Core Ultra 9 285K | |
| Intel Core i7-14700K | |
| Intel Core i9-13900K | |
| Intel Core Ultra 5 250K Plus | |
| Intel Core i5-14600K | |
| Intel Core i9-12900K | |
| Intel Core i5-13600K | |
| Intel Core Ultra 5 245K | |
| Intel Core i5-12600K | |
| R Benchmark 2.5 - Overall mean | |
| Intel Core i5-12600K | |
| Intel Core i9-12900K | |
| AMD Ryzen 7 7800X3D | |
| Intel Core Ultra 5 245K | |
| Intel Core Ultra 5 245K | |
| Intel Core i5-13600K | |
| Intel Core i5-14600K | |
| Intel Core i7-14700K | |
| Intel Core Ultra 5 250K Plus | |
| Intel Core Ultra 9 285K | |
| AMD Ryzen 9 7900X | |
| AMD Ryzen 9 7950X3D | |
| AMD Ryzen 9 7950X | |
| Intel Core Ultra 7 270K Plus | |
| Intel Core i9-13900K | |
| AMD Ryzen 7 9800X3D | |
| Intel Core i9-14900K | |
| AMD Ryzen 7 9700X | |
| AMD Ryzen 5 9600X | |
| AMD Ryzen 9 9900X | |
| AMD Ryzen 9 9950X3D | |
| AMD Ryzen 9 9950X | |
| AMD Ryzen 7 9850X3D | |
| LibreOffice - 20 Documents To PDF | |
| Intel Core i5-12600K | |
| AMD Ryzen 7 9850X3D | |
| AMD Ryzen 7 9800X3D | |
| AMD Ryzen 5 9600X | |
| AMD Ryzen 9 9950X3D | |
| AMD Ryzen 9 9950X | |
| Intel Core Ultra 7 270K Plus | |
| AMD Ryzen 9 9900X | |
| AMD Ryzen 7 9700X | |
| Intel Core Ultra 5 245K | |
| Intel Core Ultra 5 245K | |
| AMD Ryzen 7 7800X3D | |
| Intel Core i9-12900K | |
| Intel Core Ultra 5 250K Plus | |
| Intel Core i7-14700K | |
| AMD Ryzen 9 7950X3D | |
| Intel Core Ultra 9 285K | |
| Intel Core i9-13900K | |
| AMD Ryzen 9 7950X | |
| Intel Core i5-13600K | |
| AMD Ryzen 9 7900X | |
| Intel Core i9-14900K | |
| Intel Core i5-14600K | |
| WebXPRT 3 - Overall | |
| AMD Ryzen 9 9950X | |
| AMD Ryzen 7 9850X3D | |
| AMD Ryzen 7 9700X | |
| AMD Ryzen 9 9900X | |
| Intel Core Ultra 9 285K | |
| AMD Ryzen 9 9950X3D | |
| AMD Ryzen 9 7950X3D | |
| Intel Core i9-14900K | |
| AMD Ryzen 9 7900X | |
| AMD Ryzen 9 7950X | |
| AMD Ryzen 5 9600X | |
| Intel Core i9-13900K | |
| Intel Core Ultra 5 250K Plus | |
| Intel Core Ultra 7 270K Plus | |
| Intel Core i5-14600K | |
| AMD Ryzen 7 7800X3D | |
| AMD Ryzen 7 9800X3D | |
| Intel Core Ultra 5 245K | |
| Intel Core i7-14700K | |
| Intel Core i5-13600K | |
| Intel Core i9-12900K | |
| Intel Core i5-12600K | |
| WebXPRT 4 - Overall | |
| AMD Ryzen 7 9850X3D | |
| AMD Ryzen 9 9950X | |
| Intel Core Ultra 9 285K | |
| Intel Core Ultra 7 270K Plus | |
| AMD Ryzen 9 9900X | |
| AMD Ryzen 7 9700X | |
| AMD Ryzen 9 9950X3D | |
| AMD Ryzen 5 9600X | |
| Intel Core Ultra 5 250K Plus | |
| AMD Ryzen 7 9800X3D | |
| Intel Core Ultra 5 245K | |
| Intel Core i9-13900K | |
| AMD Ryzen 9 7900X | |
| Intel Core i7-14700K | |
| AMD Ryzen 9 7950X3D | |
| AMD Ryzen 9 7950X | |
| Intel Core i5-14600K | |
| Intel Core i5-13600K | |
| AMD Ryzen 7 7800X3D | |
| Mozilla Kraken 1.1 - Total | |
| Intel Core i5-12600K | |
| AMD Ryzen 7 7800X3D | |
| Intel Core i9-12900K | |
| Intel Core i5-13600K | |
| Intel Core i5-14600K | |
| Intel Core i7-14700K | |
| AMD Ryzen 9 7950X3D | |
| AMD Ryzen 9 7950X | |
| Intel Core i9-13900K | |
| AMD Ryzen 9 7900X | |
| Intel Core Ultra 5 245K | |
| Intel Core i9-14900K | |
| Intel Core Ultra 5 250K Plus | |
| AMD Ryzen 7 9800X3D | |
| Intel Core Ultra 9 285K | |
| AMD Ryzen 5 9600X | |
| Intel Core Ultra 7 270K Plus | |
| AMD Ryzen 7 9850X3D | |
| AMD Ryzen 7 9700X | |
| AMD Ryzen 9 9900X | |
| AMD Ryzen 9 9950X3D | |
| AMD Ryzen 9 9950X | |
| V-Ray Benchmark Next 4.10 - CPU | |
| AMD Ryzen 9 9950X3D | |
| Intel Core Ultra 7 270K Plus | |
| AMD Ryzen 9 9950X | |
| Intel Core Ultra 9 285K | |
| AMD Ryzen 9 7950X | |
| AMD Ryzen 9 7950X3D | |
| Intel Core i9-14900K | |
| Intel Core i9-13900K | |
| AMD Ryzen 9 9900X | |
| Intel Core i7-14700K | |
| Intel Core Ultra 5 250K Plus | |
| AMD Ryzen 9 7900X | |
| AMD Ryzen 7 9800X3D | |
| AMD Ryzen 7 9850X3D | |
| Intel Core i9-12900K | |
| Intel Core Ultra 5 245K | |
| Intel Core i5-14600K | |
| Intel Core i5-13600K | |
| AMD Ryzen 7 9700X | |
| AMD Ryzen 5 9600X | |
| Intel Core i5-12600K | |
| V-Ray 5 Benchmark - CPU | |
| AMD Ryzen 9 9950X3D | |
| AMD Ryzen 9 9950X | |
| Intel Core Ultra 7 270K Plus | |
| Intel Core Ultra 9 285K | |
| AMD Ryzen 9 7950X | |
| AMD Ryzen 9 7950X3D | |
| Intel Core i9-13900K | |
| Intel Core i9-14900K | |
| Intel Core i7-14700K | |
| Intel Core Ultra 5 250K Plus | |
| AMD Ryzen 9 7900X | |
| AMD Ryzen 7 9800X3D | |
| AMD Ryzen 7 9850X3D | |
| Intel Core i9-12900K | |
| Intel Core Ultra 5 245K | |
| Intel Core i5-14600K | |
| Intel Core i5-13600K | |
| AMD Ryzen 7 9700X | |
| AMD Ryzen 7 7800X3D | |
| AMD Ryzen 5 9600X | |
| Intel Core i5-12600K | |
* ... меньше = лучше
Многопоточный тест Cinebench R15
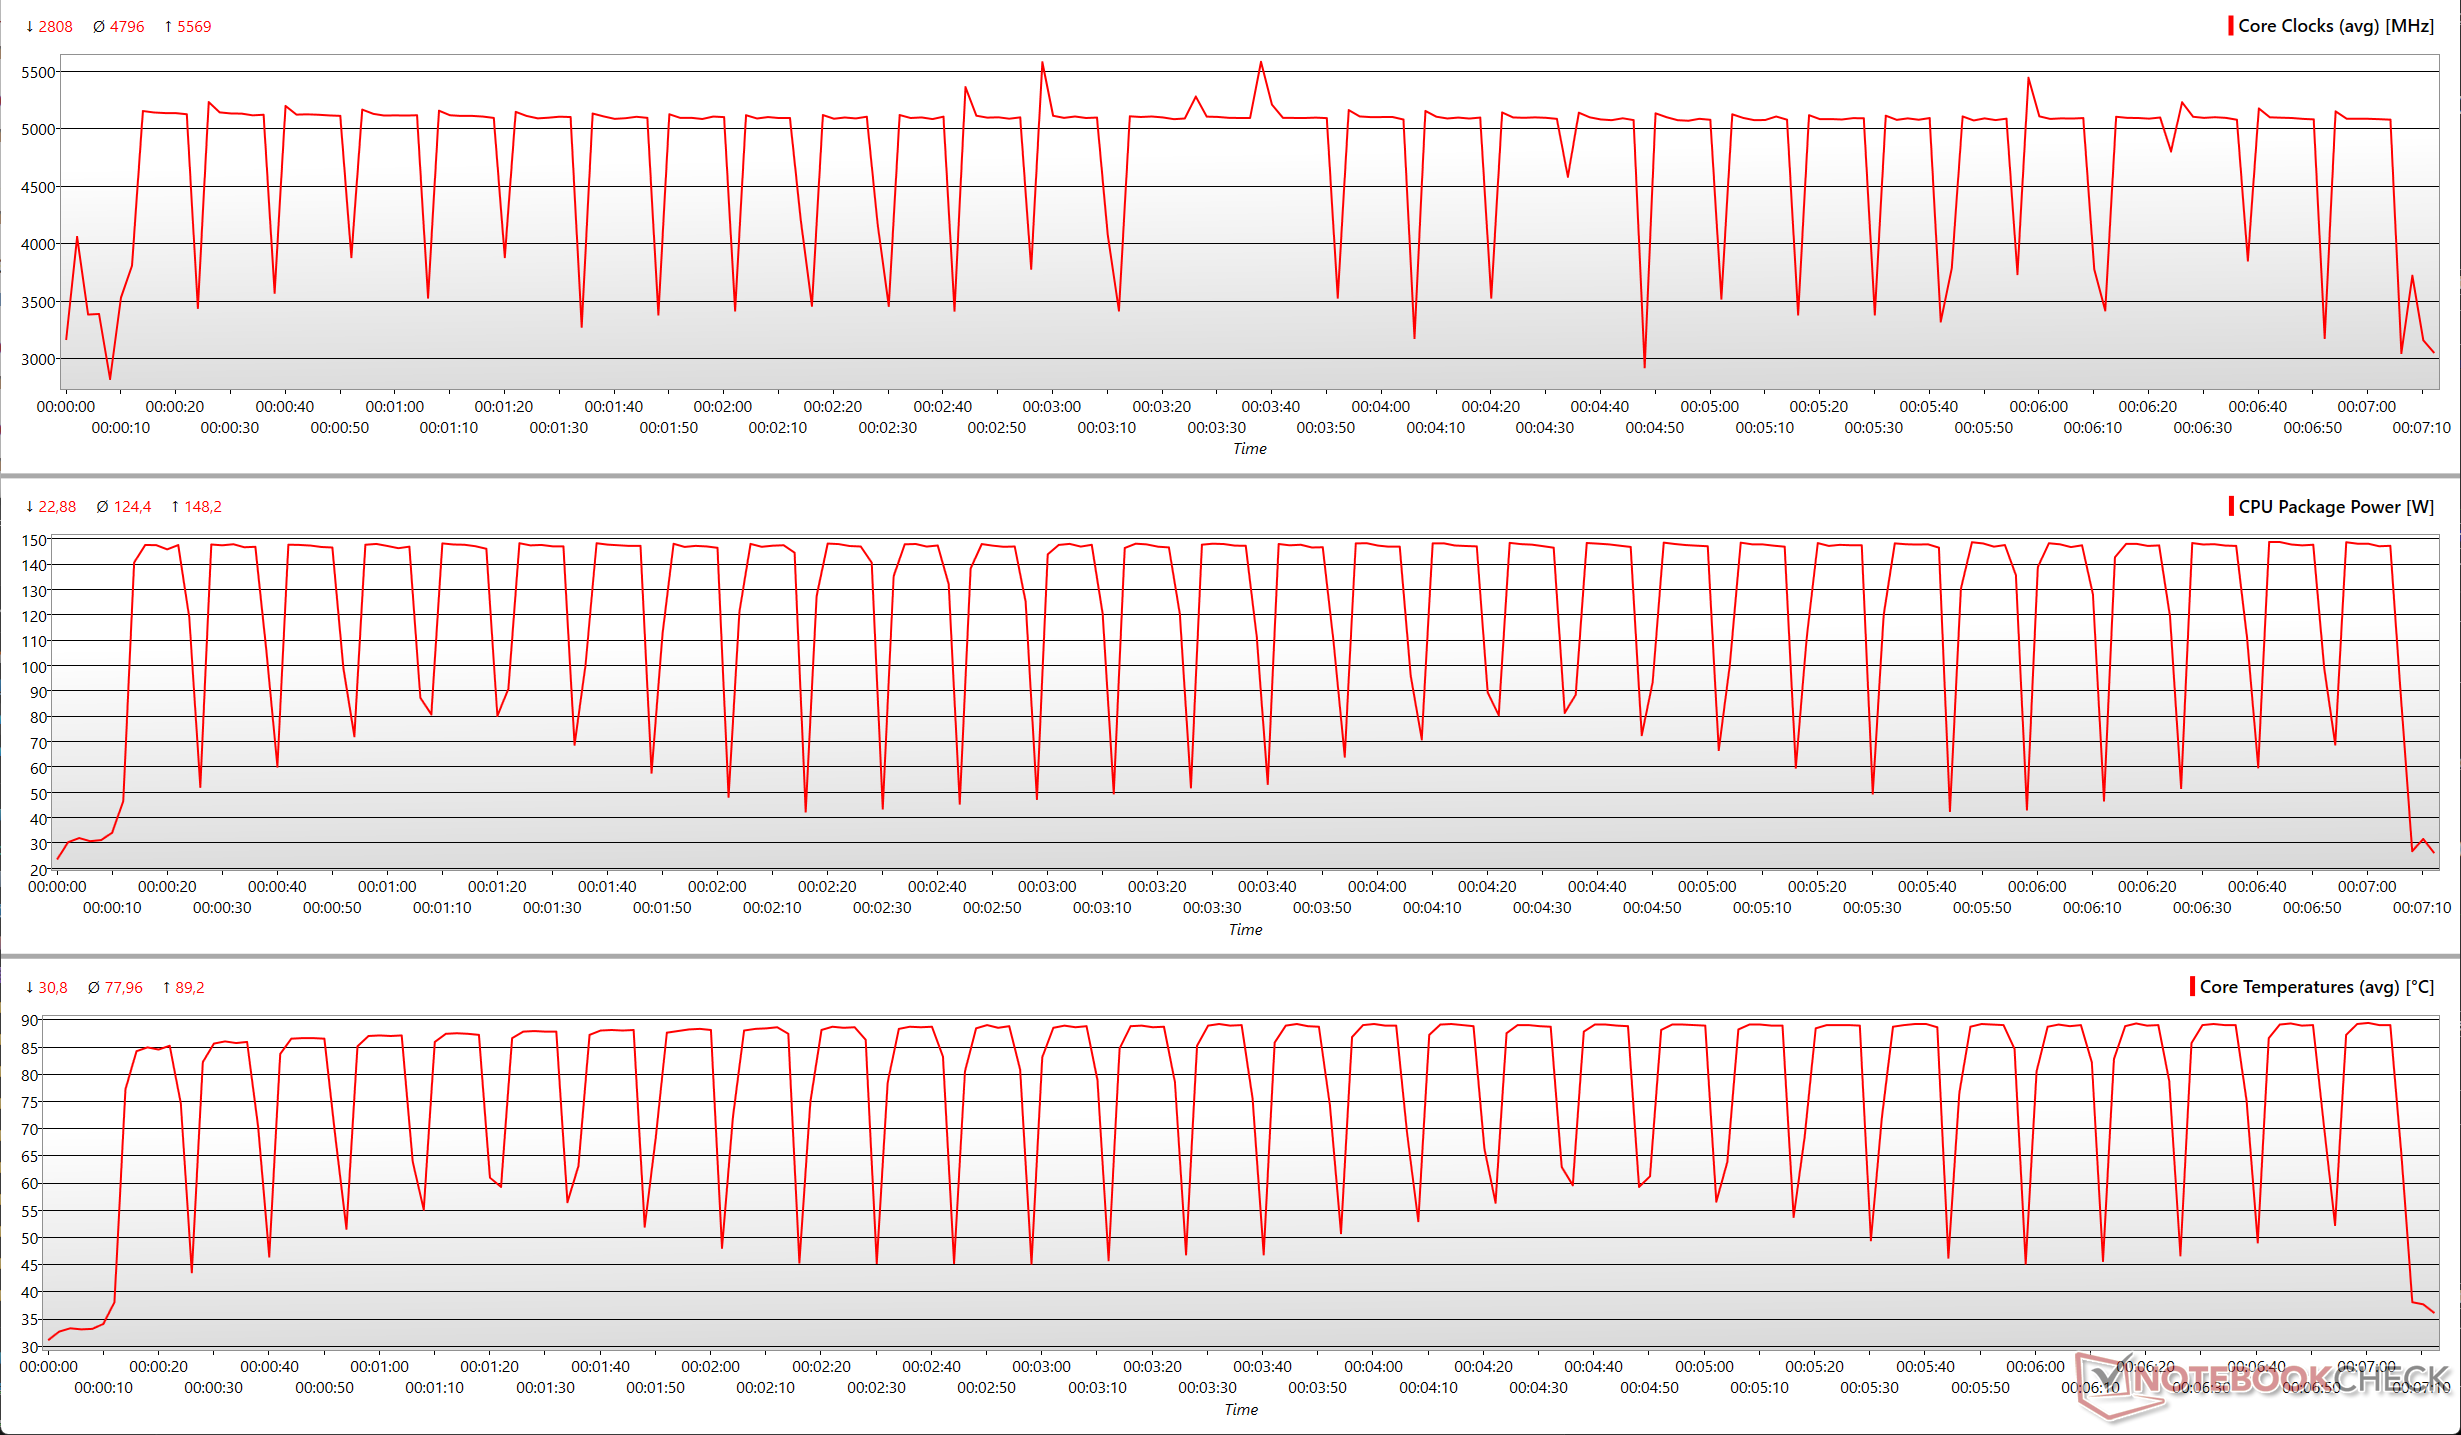
AMD не поставляет кулер в комплекте с Ryzen 7 9850X3D. Тем не менее, процессор показал хорошую устойчивую производительность без дросселирования во время многоядерного цикла Cinebench R15 в сочетании с нашим кулером Cooler Master MasterLiquid ML360L V2 ARGB AiO.
Многопоточный тест Cinebench R15
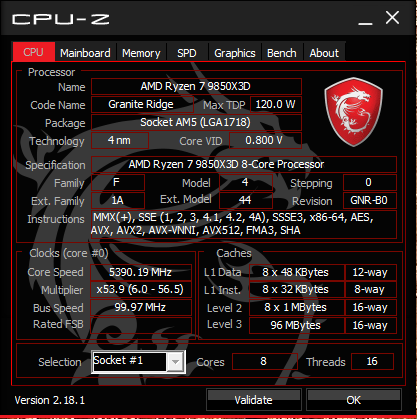
Во время выполнения 30 циклов многоядерного теста Cinebench R15 Ryzen 7 9850X3D разгоняется до 5,57 ГГц, достигая пиковой мощности пакета 148 Вт и максимальной температуры ядра 89 °C.
При среднем TDP 124 Вт средние тактовые частоты ядра колеблются в районе 4,8 ГГц, а средняя температура ядра остается на уровне 78 °C.
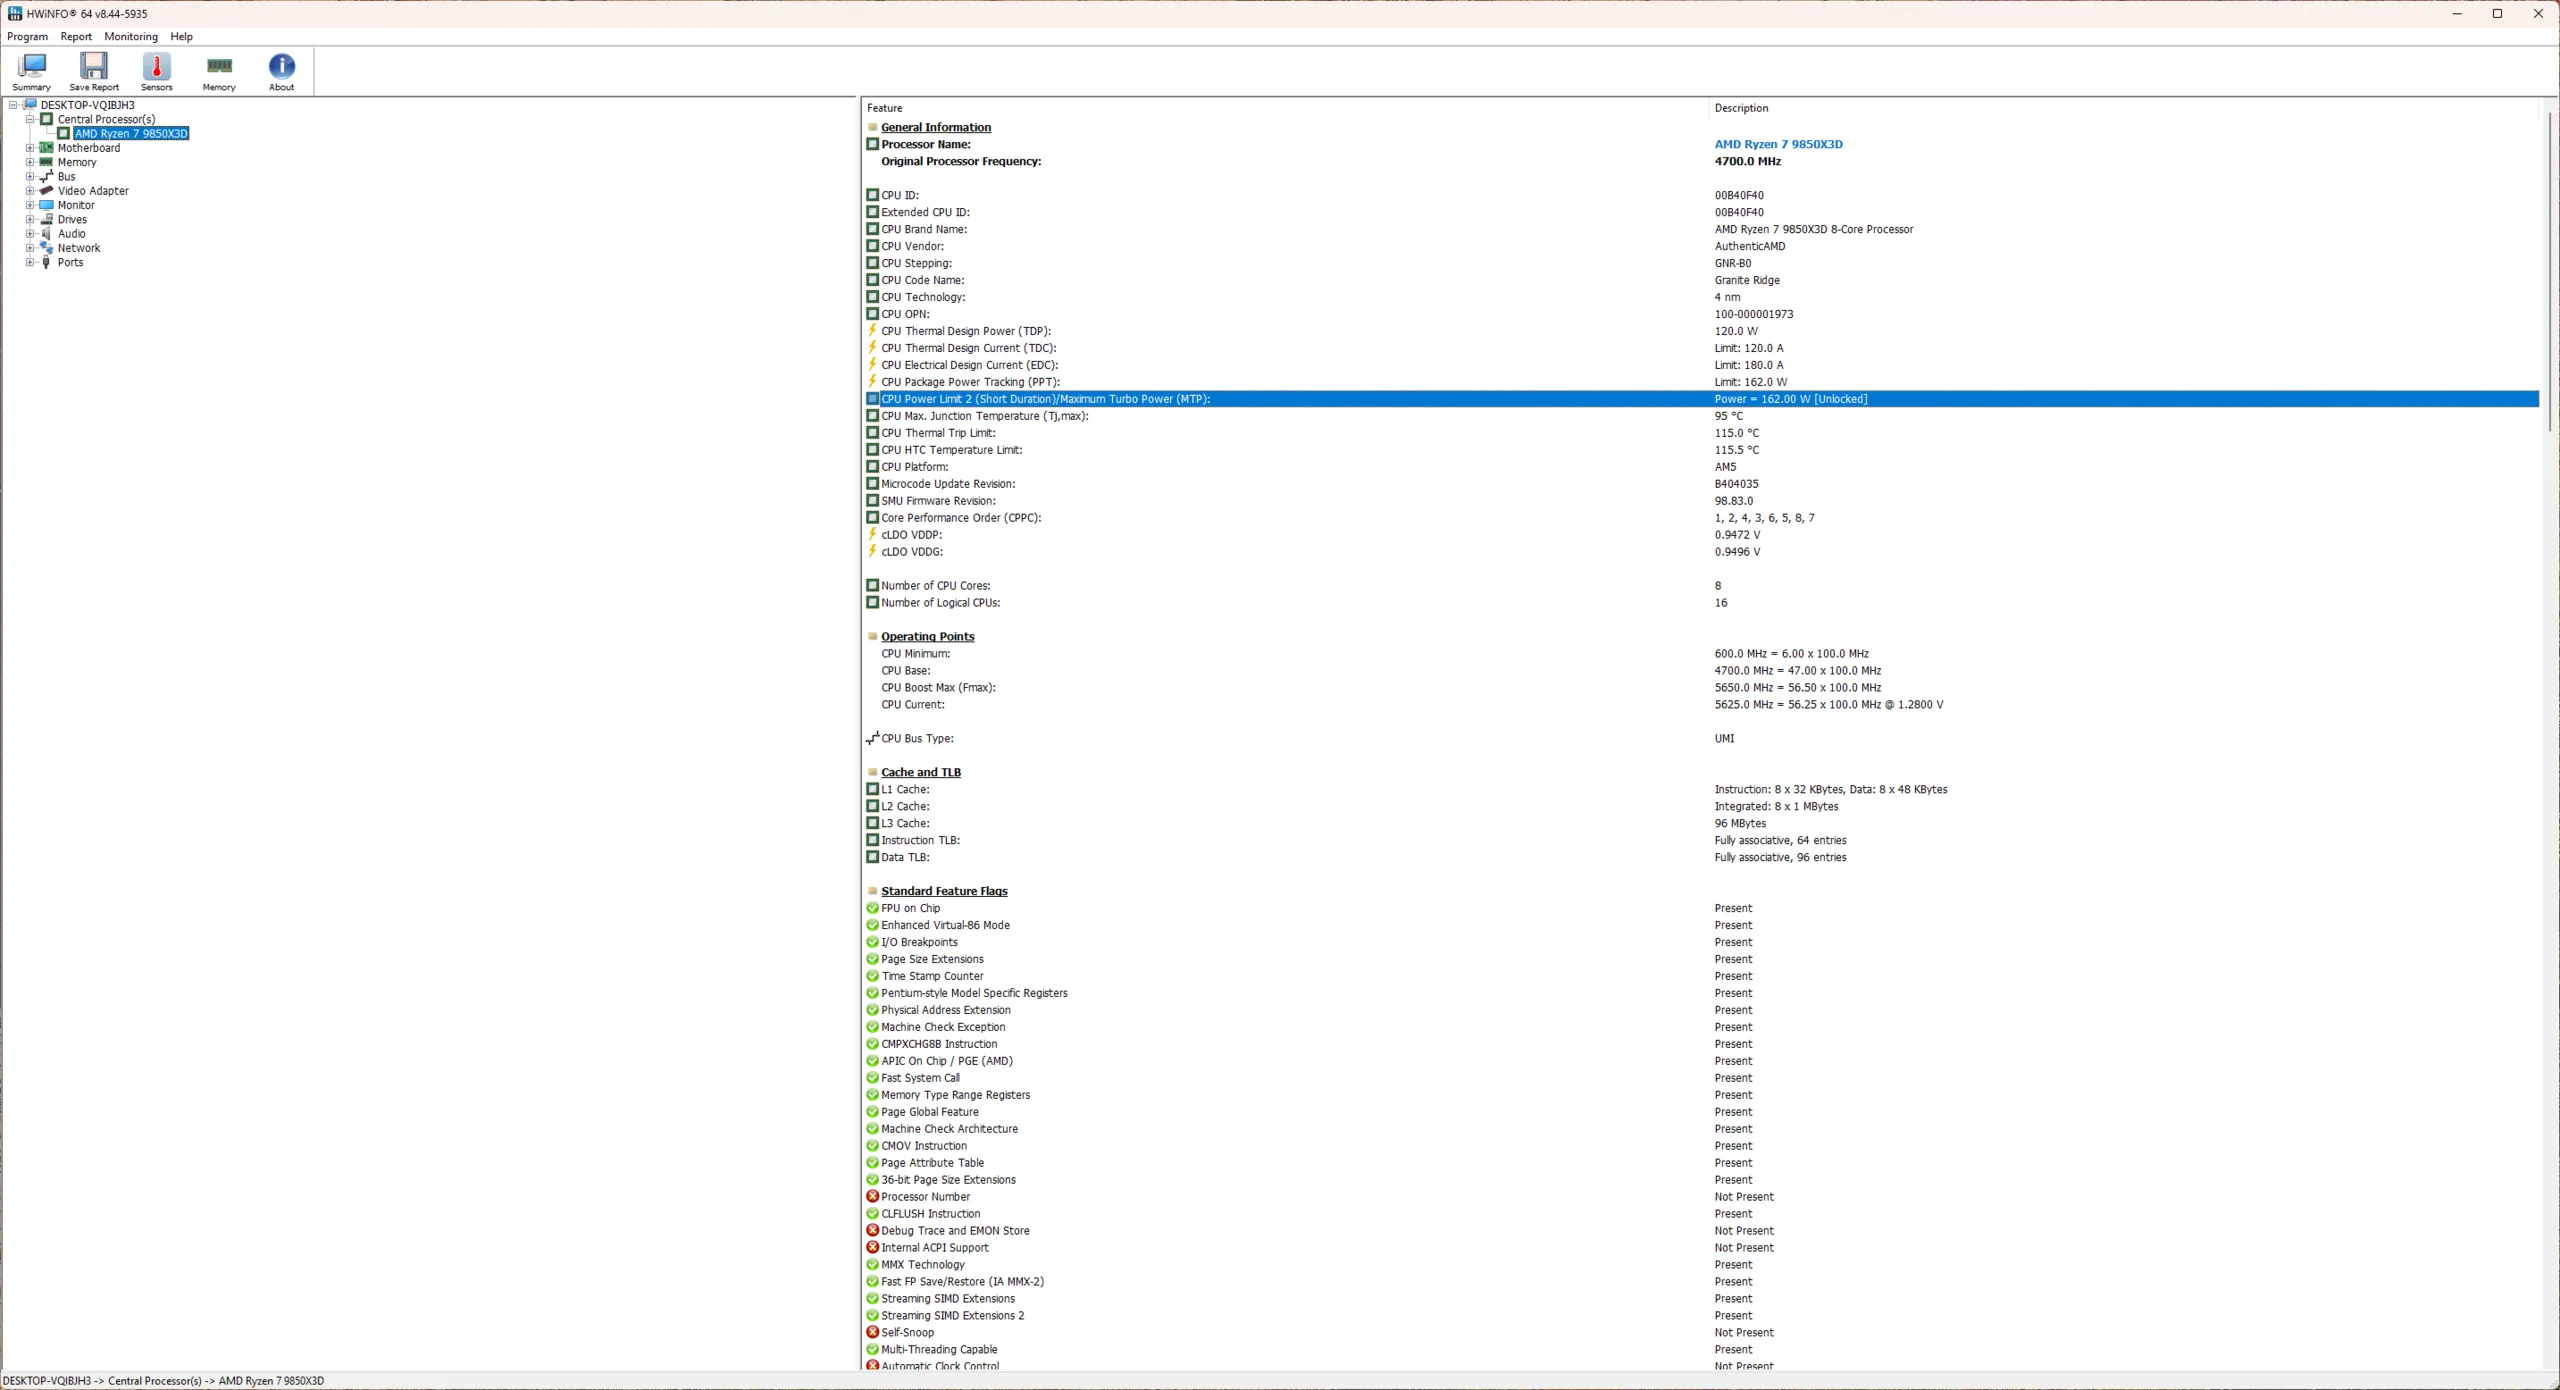
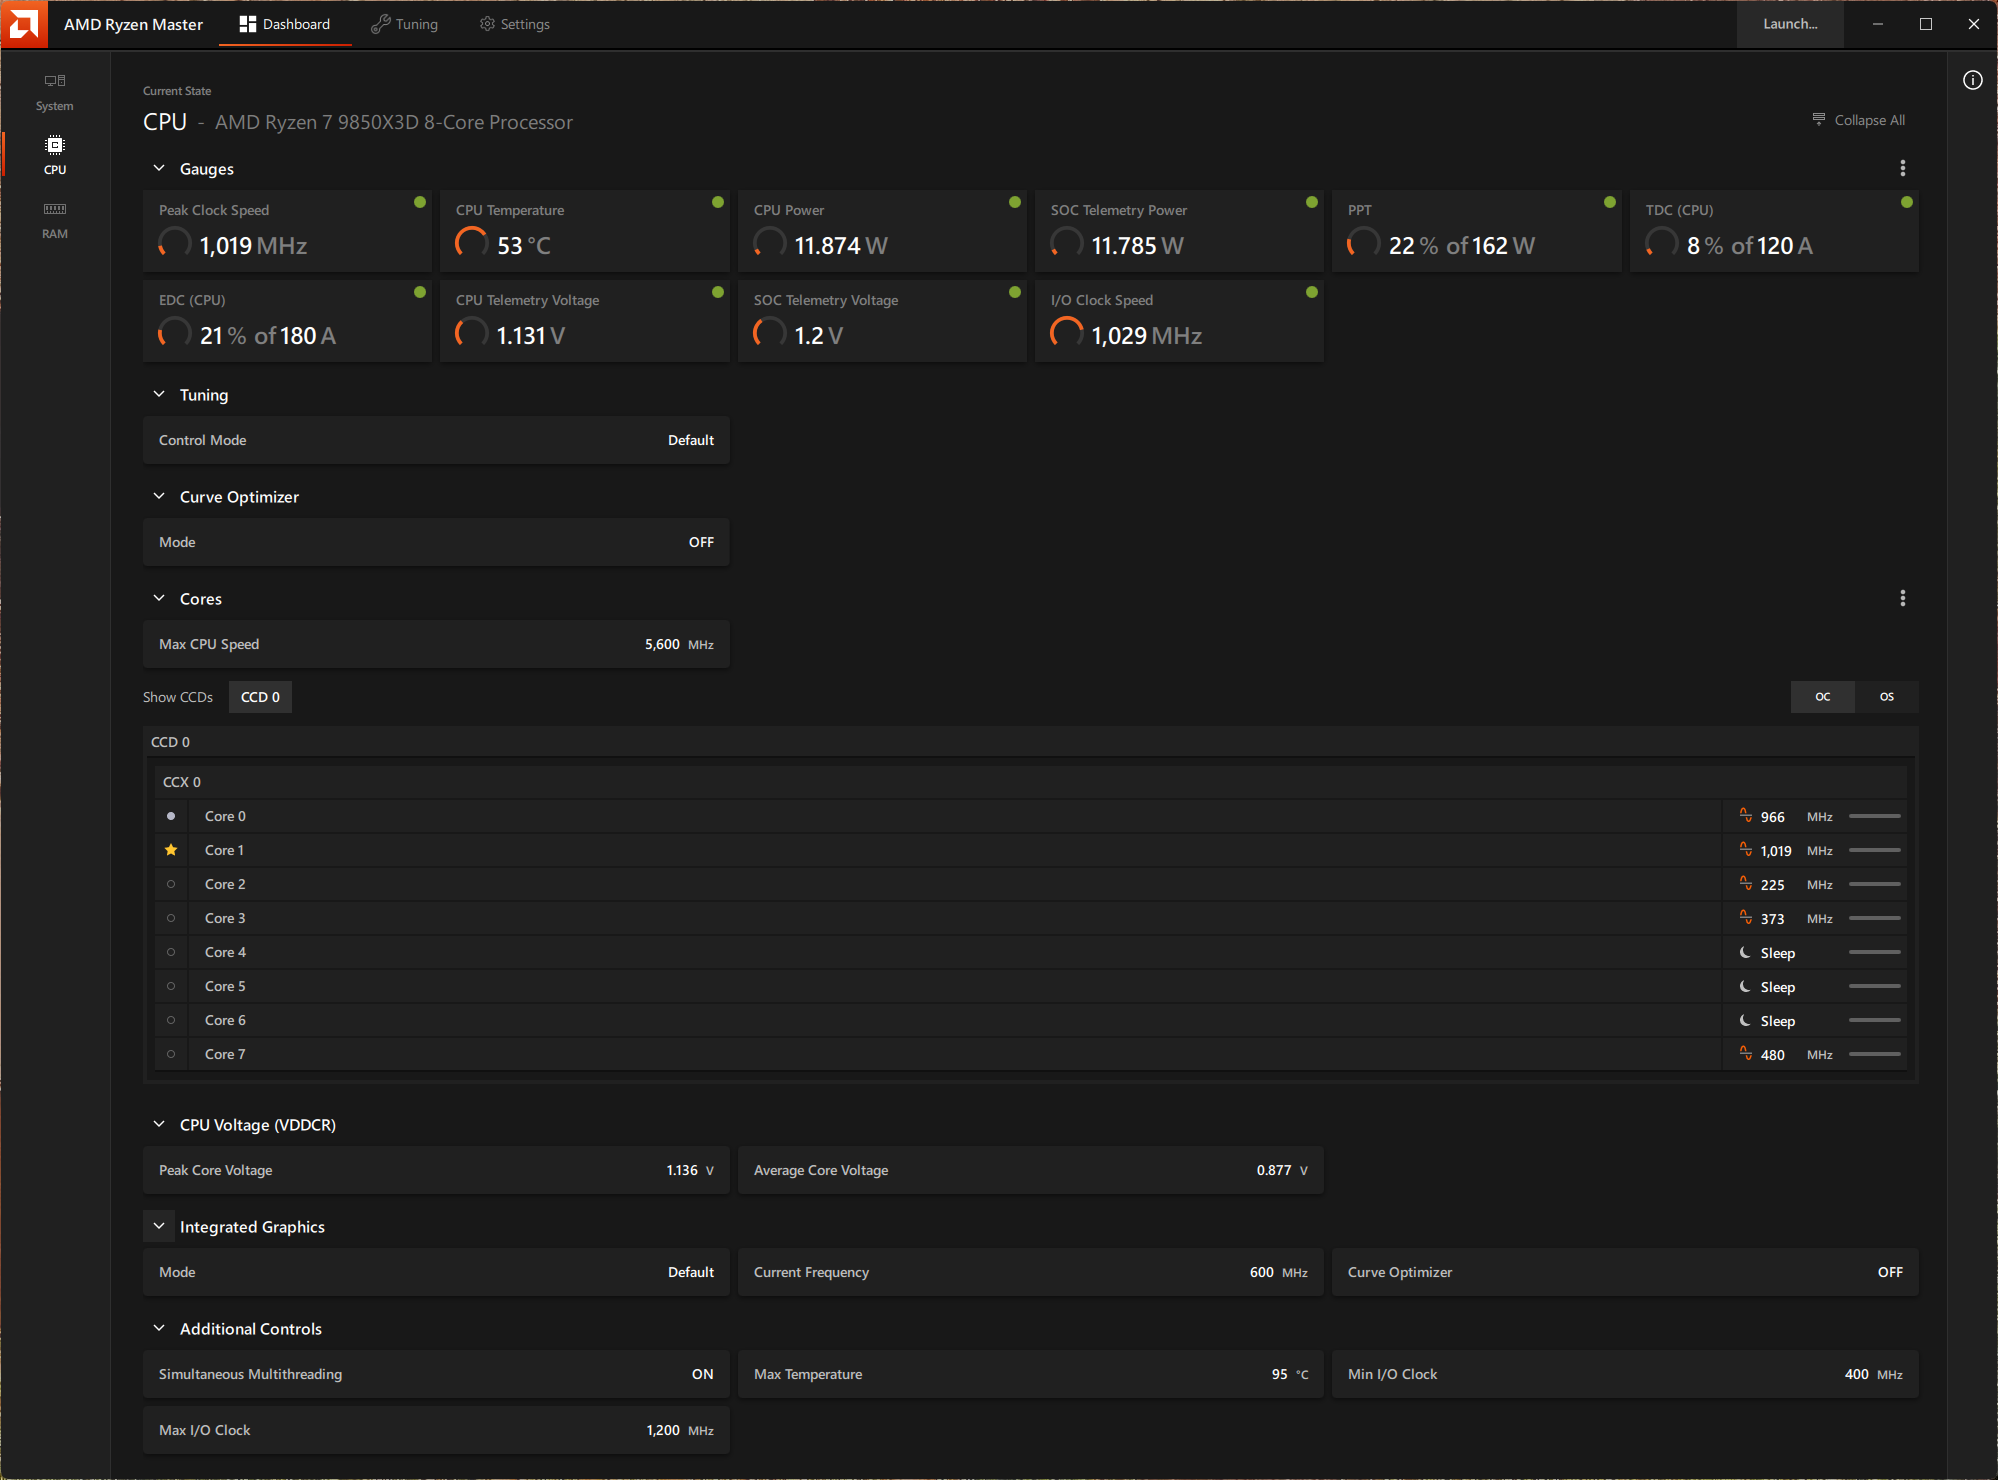
Несмотря на номинальное TDP в 120 Вт, Ryzen 7 9850X3D может потреблять до 162 Вт от сокета AM5.
Производительность системы: Прямо по пятам Ryzen 9 9950X3D
Ryzen 7 9850X3D справляется с повседневной производительностью без заминок. Он уступает Ryzen 9 9950X3D всего на 9% в совокупных системных бенчмарках.
Мы видим ощутимый прирост в PCMark 10 по сравнению с Ryzen 7 9800X3D, а общая производительность в CrossMark находится на одном уровне с процессорами Core Ultra 200S Plus.
И снова мы видим процессоры AMD в большинстве тестов AIDA64, за исключением бенчмарка CPU PhotoWorxx.
3DMark 11: 1280x720 Performance Physics
3DMark: 1920x1080 Fire Strike Physics | 2560x1440 Time Spy CPU
CrossMark: Overall | Responsiveness | Creativity | Productivity
PCMark 10: Score | Essentials | Productivity | Digital Content Creation
AIDA64: FP32 Ray-Trace | FPU Julia | CPU SHA3 | CPU Queen | FPU SinJulia | FPU Mandel | CPU AES | CPU ZLib | FP64 Ray-Trace | CPU PhotoWorxx
| System Performance rating | |
| AMD Ryzen 9 9950X3D | |
| AMD Ryzen 9 9950X | |
| Intel Core Ultra 7 270K Plus | |
| Intel Core i9-14900K | |
| Intel Core Ultra 9 285K | |
| AMD Ryzen 9 7950X | |
| Intel Core i9-13900K | |
| AMD Ryzen 9 9900X | |
| AMD Ryzen 7 9850X3D | |
| AMD Ryzen 9 7950X3D -2! | |
| Intel Core i7-14700K | |
| AMD Ryzen 9 7900X | |
| AMD Ryzen 7 9800X3D | |
| Intel Core Ultra 5 250K Plus | |
| AMD Ryzen 7 9700X | |
| Intel Core i5-14600K | |
| AMD Ryzen 7 7800X3D | |
| Intel Core i5-13600K | |
| AMD Ryzen 5 9600X | |
| Intel Core Ultra 5 245K | |
| Intel Core i9-12900K -4! | |
| Intel Core i5-12600K -4! | |
| 3DMark 11 / Performance Physics | |
| AMD Ryzen 9 9950X3D | |
| AMD Ryzen 7 9800X3D | |
| AMD Ryzen 9 9950X | |
| AMD Ryzen 7 9850X3D | |
| AMD Ryzen 9 7950X3D | |
| AMD Ryzen 7 7800X3D | |
| Intel Core i7-14700K | |
| Intel Core i9-13900K | |
| Intel Core i9-14900K | |
| Intel Core i5-14600K | |
| Intel Core Ultra 7 270K Plus | |
| Intel Core Ultra 9 285K | |
| AMD Ryzen 7 9700X | |
| Intel Core i5-13600K | |
| AMD Ryzen 9 9900X | |
| AMD Ryzen 9 7900X | |
| AMD Ryzen 9 7950X | |
| Intel Core i9-12900K | |
| Intel Core Ultra 5 250K Plus | |
| Intel Core Ultra 5 245K | |
| AMD Ryzen 5 9600X | |
| Intel Core i5-12600K | |
| 3DMark / Fire Strike Physics | |
| Intel Core i9-14900K | |
| Intel Core Ultra 7 270K Plus | |
| Intel Core i9-13900K | |
| Intel Core Ultra 9 285K | |
| AMD Ryzen 9 9950X | |
| AMD Ryzen 9 9950X3D | |
| Intel Core i7-14700K | |
| Intel Core Ultra 5 250K Plus | |
| AMD Ryzen 9 7950X3D | |
| AMD Ryzen 9 9900X | |
| AMD Ryzen 9 7900X | |
| AMD Ryzen 9 7950X | |
| Intel Core i5-14600K | |
| AMD Ryzen 7 9800X3D | |
| AMD Ryzen 7 9850X3D | |
| Intel Core i9-12900K | |
| Intel Core Ultra 5 245K | |
| AMD Ryzen 7 9700X | |
| Intel Core i5-13600K | |
| AMD Ryzen 5 9600X | |
| AMD Ryzen 7 7800X3D | |
| Intel Core i5-12600K | |
| 3DMark / Time Spy CPU | |
| Intel Core i9-14900K | |
| Intel Core i7-14700K | |
| Intel Core Ultra 7 270K Plus | |
| Intel Core Ultra 5 250K Plus | |
| Intel Core i9-13900K | |
| Intel Core i5-14600K | |
| Intel Core i9-12900K | |
| Intel Core Ultra 9 285K | |
| AMD Ryzen 9 7950X3D | |
| Intel Core i5-13600K | |
| AMD Ryzen 9 9950X3D | |
| AMD Ryzen 9 7900X | |
| AMD Ryzen 9 7950X | |
| AMD Ryzen 7 9800X3D | |
| AMD Ryzen 9 9950X | |
| AMD Ryzen 9 9900X | |
| AMD Ryzen 7 9850X3D | |
| Intel Core Ultra 5 245K | |
| AMD Ryzen 7 9700X | |
| AMD Ryzen 7 7800X3D | |
| Intel Core i5-12600K | |
| AMD Ryzen 5 9600X | |
| CrossMark / Overall | |
| Intel Core i9-14900K | |
| Intel Core i9-13900K | |
| Intel Core Ultra 7 270K Plus | |
| Intel Core Ultra 9 285K | |
| AMD Ryzen 9 7950X | |
| AMD Ryzen 9 9950X | |
| Intel Core Ultra 5 250K Plus | |
| AMD Ryzen 7 9850X3D | |
| AMD Ryzen 9 7900X | |
| AMD Ryzen 9 9950X3D | |
| AMD Ryzen 7 9800X3D | |
| Intel Core i5-14600K | |
| AMD Ryzen 9 9900X | |
| Intel Core i7-14700K | |
| Intel Core i5-13600K | |
| Intel Core Ultra 5 245K | |
| AMD Ryzen 7 7800X3D | |
| AMD Ryzen 9 7950X3D | |
| AMD Ryzen 7 9700X | |
| AMD Ryzen 5 9600X | |
| CrossMark / Responsiveness | |
| Intel Core i9-13900K | |
| Intel Core i9-14900K | |
| Intel Core Ultra 7 270K Plus | |
| Intel Core Ultra 9 285K | |
| Intel Core i5-13600K | |
| AMD Ryzen 9 7950X | |
| AMD Ryzen 9 7900X | |
| Intel Core Ultra 5 250K Plus | |
| Intel Core Ultra 5 245K | |
| Intel Core i5-14600K | |
| AMD Ryzen 7 7800X3D | |
| Intel Core i7-14700K | |
| AMD Ryzen 7 9850X3D | |
| AMD Ryzen 9 9950X | |
| AMD Ryzen 7 9800X3D | |
| AMD Ryzen 9 7950X3D | |
| AMD Ryzen 9 9900X | |
| AMD Ryzen 9 9950X3D | |
| AMD Ryzen 7 9700X | |
| AMD Ryzen 5 9600X | |
| CrossMark / Creativity | |
| AMD Ryzen 9 9950X3D | |
| AMD Ryzen 9 9950X | |
| Intel Core i9-14900K | |
| AMD Ryzen 7 9850X3D | |
| Intel Core Ultra 7 270K Plus | |
| AMD Ryzen 9 7950X | |
| Intel Core i9-13900K | |
| AMD Ryzen 7 9800X3D | |
| Intel Core Ultra 9 285K | |
| AMD Ryzen 9 9900X | |
| Intel Core Ultra 5 250K Plus | |
| AMD Ryzen 9 7900X | |
| Intel Core i7-14700K | |
| AMD Ryzen 7 9700X | |
| Intel Core i5-14600K | |
| AMD Ryzen 9 7950X3D | |
| AMD Ryzen 5 9600X | |
| AMD Ryzen 7 7800X3D | |
| Intel Core i5-13600K | |
| Intel Core Ultra 5 245K | |
| CrossMark / Productivity | |
| Intel Core i9-14900K | |
| Intel Core i9-13900K | |
| Intel Core Ultra 9 285K | |
| AMD Ryzen 9 7950X | |
| Intel Core Ultra 7 270K Plus | |
| Intel Core Ultra 5 250K Plus | |
| AMD Ryzen 9 7900X | |
| AMD Ryzen 7 9850X3D | |
| AMD Ryzen 9 9950X | |
| Intel Core Ultra 5 245K | |
| Intel Core i5-14600K | |
| AMD Ryzen 7 9800X3D | |
| Intel Core i5-13600K | |
| Intel Core i7-14700K | |
| AMD Ryzen 9 9950X3D | |
| AMD Ryzen 7 7800X3D | |
| AMD Ryzen 9 9900X | |
| AMD Ryzen 7 9700X | |
| AMD Ryzen 9 7950X3D | |
| AMD Ryzen 5 9600X | |
| PCMark 10 / Score | |
| AMD Ryzen 7 9850X3D | |
| Intel Core Ultra 5 250K Plus | |
| AMD Ryzen 9 9950X3D | |
| AMD Ryzen 7 9700X | |
| AMD Ryzen 9 9950X | |
| AMD Ryzen 9 9900X | |
| Intel Core Ultra 7 270K Plus | |
| Intel Core Ultra 9 285K | |
| Intel Core i9-14900K | |
| AMD Ryzen 5 9600X | |
| AMD Ryzen 7 9800X3D | |
| AMD Ryzen 9 7900X | |
| AMD Ryzen 9 7950X | |
| Intel Core i9-13900K | |
| Intel Core i7-14700K | |
| Intel Core i5-14600K | |
| AMD Ryzen 7 7800X3D | |
| Intel Core Ultra 5 245K | |
| Intel Core i5-13600K | |
| Intel Core i9-12900K | |
| Intel Core i5-12600K | |
| PCMark 10 / Essentials | |
| AMD Ryzen 7 9850X3D | |
| Intel Core i9-13900K | |
| AMD Ryzen 9 7900X | |
| AMD Ryzen 9 7950X | |
| AMD Ryzen 7 9700X | |
| AMD Ryzen 9 9950X3D | |
| Intel Core i9-14900K | |
| Intel Core i5-13600K | |
| AMD Ryzen 9 9900X | |
| AMD Ryzen 9 7950X3D | |
| AMD Ryzen 5 9600X | |
| AMD Ryzen 9 9950X | |
| AMD Ryzen 7 9800X3D | |
| Intel Core i7-14700K | |
| Intel Core Ultra 7 270K Plus | |
| Intel Core Ultra 9 285K | |
| Intel Core i5-14600K | |
| AMD Ryzen 7 7800X3D | |
| Intel Core Ultra 5 245K | |
| Intel Core Ultra 5 250K Plus | |
| Intel Core i9-12900K | |
| Intel Core i5-12600K | |
| PCMark 10 / Productivity | |
| AMD Ryzen 7 9850X3D | |
| Intel Core Ultra 5 250K Plus | |
| Intel Core Ultra 7 270K Plus | |
| AMD Ryzen 9 9900X | |
| AMD Ryzen 5 9600X | |
| AMD Ryzen 9 9950X | |
| AMD Ryzen 7 9700X | |
| AMD Ryzen 9 9950X3D | |
| AMD Ryzen 9 7950X3D | |
| Intel Core Ultra 9 285K | |
| AMD Ryzen 7 9800X3D | |
| AMD Ryzen 7 7800X3D | |
| Intel Core i5-14600K | |
| Intel Core i7-14700K | |
| AMD Ryzen 9 7900X | |
| AMD Ryzen 9 7950X | |
| Intel Core i9-14900K | |
| Intel Core i5-13600K | |
| Intel Core i9-13900K | |
| Intel Core Ultra 5 245K | |
| Intel Core i5-12600K | |
| Intel Core i9-12900K | |
| PCMark 10 / Digital Content Creation | |
| AMD Ryzen 9 9950X3D | |
| Intel Core Ultra 9 285K | |
| AMD Ryzen 9 9950X | |
| AMD Ryzen 9 9900X | |
| AMD Ryzen 7 9700X | |
| AMD Ryzen 7 9850X3D | |
| Intel Core Ultra 7 270K Plus | |
| Intel Core i9-14900K | |
| Intel Core Ultra 5 250K Plus | |
| AMD Ryzen 7 9800X3D | |
| Intel Core Ultra 5 245K | |
| AMD Ryzen 5 9600X | |
| Intel Core i7-14700K | |
| AMD Ryzen 9 7900X | |
| AMD Ryzen 9 7950X | |
| Intel Core i9-13900K | |
| Intel Core i5-14600K | |
| AMD Ryzen 7 7800X3D | |
| Intel Core i5-13600K | |
| Intel Core i9-12900K | |
| Intel Core i5-12600K | |
| AIDA64 / FP32 Ray-Trace | |
| AMD Ryzen 9 9950X3D (v6.92.6600) | |
| AMD Ryzen 9 9950X (v6.92.6600) | |
| AMD Ryzen 9 9900X (v6.92.6600) | |
| AMD Ryzen 9 7950X (v6.75.6100) | |
| AMD Ryzen 9 7950X3D (v6.85.6300) | |
| AMD Ryzen 7 9800X3D (v6.92.6600) | |
| AMD Ryzen 7 9850X3D (v8.20.8100) | |
| AMD Ryzen 7 9850X3D (v6.92.6600) | |
| Intel Core Ultra 7 270K Plus (v8.20.8100) | |
| Intel Core Ultra 7 270K Plus (v6.92.6600) | |
| Intel Core Ultra 9 285K (v6.92.6600) | |
| AMD Ryzen 7 9700X (v6.92.6600) | |
| Intel Core i9-14900K (v6.85.6300) | |
| Intel Core i9-14900K (v8.20.8100) | |
| Intel Core i9-13900K (v6.75.6100) | |
| AMD Ryzen 5 9600X (v6.92.6600) | |
| AMD Ryzen 9 7900X (v6.70.6000) | |
| Intel Core i7-14700K (v6.92.6600) | |
| AMD Ryzen 7 7800X3D (v6.85.6300) | |
| Intel Core i5-14600K (v6.85.6300) | |
| Intel Core Ultra 5 250K Plus (v6.92.6600) | |
| Intel Core Ultra 5 250K Plus (v8.20.8100) | |
| Intel Core i5-13600K (v6.75.6100) | |
| Intel Core Ultra 5 245K (v6.92.6600) | |
| Intel Core i9-12900K (v6.50.5800) | |
| Intel Core i5-12600K (v6.50.5800) | |
| AIDA64 / FPU Julia | |
| AMD Ryzen 9 9950X3D (v6.92.6600) | |
| AMD Ryzen 9 7950X3D (v6.85.6300) | |
| AMD Ryzen 9 9950X (v6.92.6600) | |
| AMD Ryzen 9 7950X (v6.75.6100) | |
| Intel Core Ultra 7 270K Plus (v8.20.8100) | |
| Intel Core Ultra 7 270K Plus (v6.92.6600) | |
| Intel Core Ultra 9 285K (v6.92.6600) | |
| AMD Ryzen 7 9850X3D (v8.20.8100) | |
| AMD Ryzen 7 9850X3D (v6.92.6600) | |
| AMD Ryzen 9 7900X (v6.70.6000) | |
| AMD Ryzen 9 9900X (v6.92.6600) | |
| Intel Core i9-14900K (v6.85.6300) | |
| Intel Core i9-14900K (v8.20.8100) | |
| Intel Core i9-13900K (v6.75.6100) | |
| Intel Core i7-14700K (v6.92.6600) | |
| AMD Ryzen 7 9800X3D (v6.92.6600) | |
| AMD Ryzen 7 7800X3D (v6.85.6300) | |
| Intel Core Ultra 5 250K Plus (v6.92.6600) | |
| Intel Core Ultra 5 250K Plus (v8.20.8100) | |
| AMD Ryzen 7 9700X (v6.92.6600) | |
| Intel Core i5-14600K (v6.85.6300) | |
| Intel Core i5-13600K (v6.75.6100) | |
| AMD Ryzen 5 9600X (v6.92.6600) | |
| Intel Core Ultra 5 245K (v6.92.6600) | |
| Intel Core i9-12900K (v6.50.5800) | |
| Intel Core i5-12600K (v6.50.5800) | |
| AIDA64 / CPU SHA3 | |
| AMD Ryzen 9 7950X3D (v6.85.6300) | |
| Intel Core Ultra 9 285K (v6.92.6600) | |
| Intel Core Ultra 7 270K Plus (v8.20.8100) | |
| Intel Core Ultra 7 270K Plus (v6.92.6600) | |
| AMD Ryzen 9 9950X (v6.92.6600) | |
| AMD Ryzen 9 9950X3D (v6.92.6600) | |
| AMD Ryzen 9 7950X (v6.75.6100) | |
| Intel Core i9-13900K (v6.75.6100) | |
| Intel Core i9-14900K (v6.85.6300) | |
| Intel Core i9-14900K (v8.20.8100) | |
| AMD Ryzen 9 9900X (v6.92.6600) | |
| Intel Core i7-14700K (v6.92.6600) | |
| AMD Ryzen 9 7900X (v6.70.6000) | |
| AMD Ryzen 7 9850X3D (v8.20.8100) | |
| AMD Ryzen 7 9850X3D (v6.92.6600) | |
| Intel Core Ultra 5 250K Plus (v6.92.6600) | |
| Intel Core Ultra 5 250K Plus (v8.20.8100) | |
| AMD Ryzen 7 9800X3D (v6.92.6600) | |
| Intel Core i5-14600K (v6.85.6300) | |
| AMD Ryzen 7 9700X (v6.92.6600) | |
| AMD Ryzen 7 7800X3D (v6.85.6300) | |
| Intel Core i5-13600K (v6.75.6100) | |
| Intel Core i9-12900K (v6.50.5800) | |
| Intel Core Ultra 5 245K (v6.92.6600) | |
| AMD Ryzen 5 9600X (v6.92.6600) | |
| Intel Core i5-12600K (v6.50.5800) | |
| AIDA64 / CPU Queen | |
| AMD Ryzen 9 7950X (v6.75.6100) | |
| AMD Ryzen 9 7950X3D (v6.85.6300) | |
| AMD Ryzen 9 9950X (v6.92.6600) | |
| AMD Ryzen 9 9950X3D (v6.92.6600) | |
| AMD Ryzen 9 7900X (v6.70.6000) | |
| Intel Core i7-14700K (v6.92.6600) | |
| Intel Core i9-14900K (v6.85.6300) | |
| Intel Core i9-13900K (v6.75.6100) | |
| AMD Ryzen 9 9900X (v6.92.6600) | |
| Intel Core Ultra 7 270K Plus (v6.92.6600) | |
| Intel Core Ultra 9 285K (v6.92.6600) | |
| AMD Ryzen 7 9850X3D (v6.92.6600) | |
| Intel Core i5-14600K (v6.85.6300) | |
| AMD Ryzen 7 7800X3D (v6.85.6300) | |
| Intel Core i5-13600K (v6.75.6100) | |
| AMD Ryzen 7 9700X (v6.92.6600) | |
| AMD Ryzen 7 9800X3D (v6.92.6600) | |
| Intel Core i9-12900K (v6.50.5800) | |
| AMD Ryzen 5 9600X (v6.92.6600) | |
| Intel Core Ultra 5 250K Plus (v6.92.6600) | |
| Intel Core i5-12600K (v6.50.5800) | |
| Intel Core Ultra 5 245K (v6.92.6600) | |
| AIDA64 / FPU SinJulia | |
| AMD Ryzen 9 9950X (v6.92.6600) | |
| AMD Ryzen 9 9950X3D (v6.92.6600) | |
| AMD Ryzen 9 7950X (v6.75.6100) | |
| AMD Ryzen 9 7950X3D (v6.85.6300) | |
| AMD Ryzen 9 9900X (v6.92.6600) | |
| AMD Ryzen 9 7900X (v6.70.6000) | |
| Intel Core i9-14900K (v6.85.6300) | |
| Intel Core i9-14900K (v8.20.8100) | |
| Intel Core i9-13900K (v6.75.6100) | |
| Intel Core i7-14700K (v6.92.6600) | |
| AMD Ryzen 7 9850X3D (v8.20.8100) | |
| AMD Ryzen 7 9850X3D (v6.92.6600) | |
| AMD Ryzen 7 9700X (v6.92.6600) | |
| AMD Ryzen 7 9800X3D (v6.92.6600) | |
| AMD Ryzen 7 7800X3D (v6.85.6300) | |
| Intel Core Ultra 7 270K Plus (v8.20.8100) | |
| Intel Core Ultra 7 270K Plus (v6.92.6600) | |
| Intel Core Ultra 9 285K (v6.92.6600) | |
| Intel Core i9-12900K (v6.50.5800) | |
| AMD Ryzen 5 9600X (v6.92.6600) | |
| Intel Core i5-14600K (v6.85.6300) | |
| Intel Core i5-13600K (v6.75.6100) | |
| Intel Core i5-12600K (v6.50.5800) | |
| Intel Core Ultra 5 250K Plus (v6.92.6600) | |
| Intel Core Ultra 5 250K Plus (v8.20.8100) | |
| Intel Core Ultra 5 245K (v6.92.6600) | |
| AIDA64 / FPU Mandel | |
| AMD Ryzen 9 7950X3D (v6.85.6300) | |
| AMD Ryzen 9 9950X3D (v6.92.6600) | |
| AMD Ryzen 9 9950X (v6.92.6600) | |
| Intel Core Ultra 7 270K Plus (v8.20.8100) | |
| Intel Core Ultra 7 270K Plus (v6.92.6600) | |
| AMD Ryzen 9 7950X (v6.75.6100) | |
| AMD Ryzen 7 9850X3D (v8.20.8100) | |
| AMD Ryzen 7 9850X3D (v6.92.6600) | |
| Intel Core Ultra 9 285K (v6.92.6600) | |
| AMD Ryzen 9 7900X (v6.70.6000) | |
| AMD Ryzen 9 9900X (v6.92.6600) | |
| Intel Core i9-14900K (v6.85.6300) | |
| Intel Core i9-14900K (v8.20.8100) | |
| Intel Core i9-13900K (v6.75.6100) | |
| AMD Ryzen 7 9800X3D (v6.92.6600) | |
| Intel Core i7-14700K (v6.92.6600) | |
| AMD Ryzen 7 7800X3D (v6.85.6300) | |
| Intel Core Ultra 5 250K Plus (v6.92.6600) | |
| Intel Core Ultra 5 250K Plus (v8.20.8100) | |
| AMD Ryzen 7 9700X (v6.92.6600) | |
| Intel Core i5-14600K (v6.85.6300) | |
| Intel Core i5-13600K (v6.75.6100) | |
| AMD Ryzen 5 9600X (v6.92.6600) | |
| Intel Core Ultra 5 245K (v6.92.6600) | |
| Intel Core i9-12900K (v6.50.5800) | |
| Intel Core i5-12600K (v6.50.5800) | |
| AIDA64 / CPU AES | |
| AMD Ryzen 9 9900X (v6.92.6600) | |
| AMD Ryzen 9 7950X (v6.75.6100) | |
| AMD Ryzen 9 7950X3D (v6.85.6300) | |
| AMD Ryzen 7 9700X (v6.92.6600) | |
| Intel Core i9-14900K (v6.85.6300) | |
| Intel Core i9-14900K (v8.20.8100) | |
| Intel Core i9-13900K (v6.75.6100) | |
| AMD Ryzen 9 7900X (v6.70.6000) | |
| AMD Ryzen 5 9600X (v6.92.6600) | |
| Intel Core Ultra 9 285K (v6.92.6600) | |
| Intel Core i5-14600K (v6.85.6300) | |
| AMD Ryzen 7 7800X3D (v6.85.6300) | |
| Intel Core i5-13600K (v6.75.6100) | |
| AMD Ryzen 9 9950X (v6.92.6600) | |
| AMD Ryzen 9 9950X3D (v6.92.6600) | |
| Intel Core i7-14700K (v6.92.6600) | |
| Intel Core Ultra 7 270K Plus (v6.92.6600) | |
| Intel Core Ultra 7 270K Plus (v8.20.8100) | |
| Intel Core i9-12900K (v6.50.5800) | |
| AMD Ryzen 7 9850X3D (v8.20.8100) | |
| AMD Ryzen 7 9850X3D (v6.92.6600) | |
| AMD Ryzen 7 9800X3D (v6.92.6600) | |
| Intel Core Ultra 5 250K Plus (v6.92.6600) | |
| Intel Core Ultra 5 250K Plus (v8.20.8100) | |
| Intel Core Ultra 5 245K (v6.92.6600) | |
| Intel Core i5-12600K (v6.50.5800) | |
| AIDA64 / CPU ZLib | |
| AMD Ryzen 9 9950X3D (v6.92.6600) | |
| AMD Ryzen 9 9950X (v6.92.6600) | |
| Intel Core i9-14900K (v6.85.6300) | |
| Intel Core i9-14900K (v8.20.8100) | |
| Intel Core i9-13900K (v6.75.6100) | |
| Intel Core Ultra 7 270K Plus (v6.92.6600) | |
| Intel Core Ultra 7 270K Plus (v8.20.8100) | |
| AMD Ryzen 9 7950X (v6.75.6100) | |
| Intel Core Ultra 9 285K (v6.92.6600) | |
| AMD Ryzen 9 7950X3D (v6.85.6300) | |
| Intel Core i7-14700K (v6.92.6600) | |
| AMD Ryzen 9 9900X (v6.92.6600) | |
| AMD Ryzen 9 7900X (v6.70.6000) | |
| Intel Core i9-12900K (v6.50.5800) | |
| Intel Core i5-14600K (v6.85.6300) | |
| Intel Core i5-13600K (v6.75.6100) | |
| AMD Ryzen 7 9800X3D (v6.92.6600) | |
| AMD Ryzen 7 9850X3D (v6.92.6600) | |
| AMD Ryzen 7 9850X3D (v8.20.8100) | |
| Intel Core Ultra 5 250K Plus (v6.92.6600) | |
| Intel Core Ultra 5 250K Plus (v8.20.8100) | |
| AMD Ryzen 7 9700X (v6.92.6600) | |
| AMD Ryzen 7 7800X3D (v6.85.6300) | |
| AMD Ryzen 5 9600X (v6.92.6600) | |
| Intel Core i5-12600K (v6.50.5800) | |
| Intel Core Ultra 5 245K (v6.92.6600) | |
| AIDA64 / FP64 Ray-Trace | |
| AMD Ryzen 9 9950X (v6.92.6600) | |
| AMD Ryzen 9 9950X3D (v6.92.6600) | |
| AMD Ryzen 9 9900X (v6.92.6600) | |
| AMD Ryzen 9 7950X (v6.75.6100) | |
| AMD Ryzen 9 7950X3D (v6.85.6300) | |
| AMD Ryzen 7 9800X3D (v6.92.6600) | |
| AMD Ryzen 7 9850X3D (v8.20.8100) | |
| AMD Ryzen 7 9850X3D (v6.92.6600) | |
| Intel Core Ultra 7 270K Plus (v6.92.6600) | |
| Intel Core Ultra 7 270K Plus (v8.20.8100) | |
| Intel Core Ultra 9 285K (v6.92.6600) | |
| AMD Ryzen 7 9700X (v6.92.6600) | |
| Intel Core i9-14900K (v6.85.6300) | |
| Intel Core i9-14900K (v8.20.8100) | |
| Intel Core i9-13900K (v6.75.6100) | |
| AMD Ryzen 5 9600X (v6.92.6600) | |
| AMD Ryzen 9 7900X (v6.70.6000) | |
| Intel Core i7-14700K (v6.92.6600) | |
| AMD Ryzen 7 7800X3D (v6.85.6300) | |
| Intel Core i5-14600K (v6.85.6300) | |
| Intel Core Ultra 5 250K Plus (v6.92.6600) | |
| Intel Core Ultra 5 250K Plus (v8.20.8100) | |
| Intel Core i5-13600K (v6.75.6100) | |
| Intel Core Ultra 5 245K (v6.92.6600) | |
| Intel Core i9-12900K (v6.50.5800) | |
| Intel Core i5-12600K (v6.50.5800) | |
| AIDA64 / CPU PhotoWorxx | |
| Intel Core Ultra 7 270K Plus (v8.20.8100) | |
| Intel Core Ultra 7 270K Plus (v6.92.6600) | |
| Intel Core i9-14900K (v6.85.6300) | |
| Intel Core i9-14900K (v8.20.8100) | |
| Intel Core i5-14600K (v6.85.6300) | |
| Intel Core Ultra 9 285K (v6.92.6600) | |
| Intel Core i7-14700K (v6.92.6600) | |
| AMD Ryzen 9 7950X3D (v6.85.6300) | |
| AMD Ryzen 9 9950X3D (v6.92.6600) | |
| Intel Core i9-13900K (v6.75.6100) | |
| Intel Core i5-12600K (v6.50.5800) | |
| Intel Core i5-13600K (v6.75.6100) | |
| AMD Ryzen 9 9900X (v6.92.6600) | |
| Intel Core i9-12900K (v6.50.5800) | |
| Intel Core Ultra 5 250K Plus (v8.20.8100) | |
| Intel Core Ultra 5 250K Plus (v6.92.6600) | |
| AMD Ryzen 9 9950X (v6.92.6600) | |
| AMD Ryzen 7 9850X3D (v8.20.8100) | |
| AMD Ryzen 7 9850X3D (v6.92.6600) | |
| AMD Ryzen 7 7800X3D (v6.85.6300) | |
| AMD Ryzen 9 7950X (v6.75.6100) | |
| AMD Ryzen 7 9800X3D (v6.92.6600) | |
| AMD Ryzen 9 7900X (v6.70.6000) | |
| AMD Ryzen 7 9700X (v6.92.6600) | |
| AMD Ryzen 5 9600X (v6.92.6600) | |
| Intel Core Ultra 5 245K (v6.92.6600) | |
3DMark 11: 1280x720 Performance Physics
3DMark: 1920x1080 Fire Strike Physics | 2560x1440 Time Spy CPU
CrossMark: Overall | Responsiveness | Creativity | Productivity
PCMark 10: Score | Essentials | Productivity | Digital Content Creation
AIDA64: FP32 Ray-Trace | FPU Julia | CPU SHA3 | CPU Queen | FPU SinJulia | FPU Mandel | CPU AES | CPU ZLib | FP64 Ray-Trace | CPU PhotoWorxx
| PCMark 10 Score | 12382 баллов | |
? | ||
Для оценки времени задержки внутри матрицы мы использовали MicroBenchX с отключенным SMT. Задержки внутри ПЗС были номинальными, наименьшая из них составила 19,5 нс между ядром 2 и ядром 1. Наибольшая задержка внутри ПЗК составила 23 нс между ядрами 0 и 2.
| Core 0 | Core 1 | Core 2 | Core 3 | Core 4 | Core 5 | Core 6 | Core 7 | |
|---|---|---|---|---|---|---|---|---|
| Core 0 | 22.5 | 23 | 22.8 | 20 | 21.5 | 20 | 20.5 | |
| Core 1 | 22.5 | 21 | 22 | 22.5 | 21 | 20.5 | 21.8 | |
| Core 2 | 23 | 21 | 21 | 19.5 | 22.5 | 22.3 | 21.5 | |
| Core 3 | 22.8 | 22 | 21 | 22.5 | 20.8 | 21 | 19.8 | |
| Core 4 | 20 | 22.5 | 19.5 | 22.5 | 21.8 | 22.8 | 22 | |
| Core 5 | 21.5 | 21 | 22.5 | 20.8 | 21.8 | 22.8 | 22.8 | |
| Core 6 | 20 | 20.5 | 22.3 | 21 | 22.8 | 22.8 | 20.3 | |
| Core 7 | 20.5 | 21.8 | 21.5 | 19.8 | 22 | 22.8 | 20.3 |
| AIDA64 Memory Performance rating - Percent | |
| Intel Core Ultra 7 270K Plus | |
| Intel Core i9-14900K | |
| Intel Core i7-14700K | |
| Intel Core i9-12900K -1! | |
| Intel Core i5-14600K | |
| Intel Core i5-12600K -1! | |
| Intel Core Ultra 9 285K | |
| AMD Ryzen 9 7950X3D | |
| AMD Ryzen 9 7950X | |
| AMD Ryzen 9 9950X | |
| AMD Ryzen 9 9900X | |
| Intel Core i9-13900K | |
| AMD Ryzen 9 7900X | |
| AMD Ryzen 9 9950X3D | |
| AMD Ryzen 7 7800X3D | |
| Intel Core i5-13600K | |
| AMD Ryzen 7 9700X | |
| AMD Ryzen 5 9600X | |
| Intel Core Ultra 5 250K Plus | |
| AMD Ryzen 7 9800X3D | |
| AMD Ryzen 7 9850X3D | |
| Intel Core Ultra 5 245K | |
* ... меньше = лучше
3D и игровая производительность: Незначительные преимущества над Ryzen 7 9800X3D
Ryzen 7 9850X3D показывает низкие результаты в графических тестах 3DMark Time Spy и Fire Strike. Ранее мы уже замечали подобное аномальное поведение и у Ryzen 9 9950X3D.
На самом деле, оба процессора показывают схожие результаты в этих бенчмарках.
| 3DMark Performance rating - Percent | |
| AMD Ryzen 7 9800X3D | |
| Intel Core i5-14600K | |
| AMD Ryzen 7 7800X3D | |
| Intel Core Ultra 5 250K Plus | |
| AMD Ryzen 5 9600X | |
| Intel Core Ultra 5 245K | |
| AMD Ryzen 7 9700X | |
| AMD Ryzen 9 7950X3D | |
| Intel Core i9-14900K | |
| Intel Core i7-14700K | |
| AMD Ryzen 9 9950X | |
| AMD Ryzen 9 9950X3D | |
| Intel Core Ultra 7 270K Plus | |
| AMD Ryzen 7 9850X3D | |
| AMD Ryzen 9 9900X | |
| Intel Core Ultra 9 285K | |
| 3DMark 11 - 1280x720 Performance GPU | |
| AMD Ryzen 7 7800X3D | |
| AMD Ryzen 7 9800X3D | |
| Intel Core i5-14600K | |
| Intel Core Ultra 5 250K Plus | |
| AMD Ryzen 9 7950X3D | |
| Intel Core i9-14900K | |
| Intel Core Ultra 5 245K | |
| AMD Ryzen 5 9600X | |
| Intel Core i7-14700K | |
| Intel Core Ultra 7 270K Plus | |
| AMD Ryzen 7 9850X3D | |
| AMD Ryzen 9 9950X | |
| AMD Ryzen 7 9700X | |
| Intel Core Ultra 9 285K | |
| AMD Ryzen 9 9950X3D | |
| AMD Ryzen 9 9900X | |
| 3DMark | |
| 2560x1440 Time Spy Graphics | |
| Intel Core i5-14600K | |
| Intel Core i9-14900K | |
| AMD Ryzen 7 7800X3D | |
| Intel Core i7-14700K | |
| AMD Ryzen 5 9600X | |
| AMD Ryzen 7 9800X3D | |
| Intel Core Ultra 5 250K Plus | |
| Intel Core Ultra 7 270K Plus | |
| Intel Core Ultra 5 245K | |
| AMD Ryzen 9 7950X3D | |
| AMD Ryzen 7 9700X | |
| AMD Ryzen 9 9900X | |
| Intel Core Ultra 9 285K | |
| AMD Ryzen 9 9950X | |
| AMD Ryzen 9 9950X3D | |
| AMD Ryzen 7 9850X3D | |
| 1920x1080 Fire Strike Graphics | |
| Intel Core i5-14600K | |
| AMD Ryzen 7 9800X3D | |
| AMD Ryzen 7 9700X | |
| AMD Ryzen 5 9600X | |
| Intel Core Ultra 5 245K | |
| AMD Ryzen 9 9950X | |
| Intel Core Ultra 5 250K Plus | |
| AMD Ryzen 9 9950X3D | |
| AMD Ryzen 9 9900X | |
| AMD Ryzen 7 7800X3D | |
| AMD Ryzen 9 7950X3D | |
| AMD Ryzen 7 9850X3D | |
| Intel Core i9-14900K | |
| Intel Core i7-14700K | |
| Intel Core Ultra 7 270K Plus | |
| Intel Core Ultra 9 285K | |
| 3DMark 11 Performance | 71510 баллов | |
| 3DMark Fire Strike Score | 53418 баллов | |
| 3DMark Time Spy Score | 27672 баллов | |
? | ||
Ryzen 7 9850X3D на 25% и 36% быстрее, чем Core Ultra 7 270K Plus и Core Ultra 5 250K Plus, соответственно, в нашей подборке игр в разрешении 720p и 1080p.
Однако на самом деле процессор не намного быстрее Ryzen 7 9800X3D в этих разрешениях.
Где Ryzen 7 9850X3D действительно имеет преимущество, так это в играх, требующих большого количества процессора, таких как X-Plane 11, Dota 2 Reborn, и Baldur's Gate 3. Более высокая тактовая частота позволяет процессору опередить Ryzen 7 9800X в этих играх.
| CPU Limit Gaming Performance rating - Percent | |
| AMD Ryzen 7 9850X3D | |
| AMD Ryzen 7 9800X3D | |
| AMD Ryzen 9 9950X3D | |
| AMD Ryzen 7 7800X3D -3! | |
| AMD Ryzen 9 7950X3D -3! | |
| Intel Core i9-14900K -3! | |
| AMD Ryzen 7 9700X | |
| AMD Ryzen 9 9900X | |
| AMD Ryzen 9 9950X -3! | |
| AMD Ryzen 5 9600X | |
| Intel Core Ultra 7 270K Plus | |
| Intel Core i5-14600K -3! | |
| Intel Core Ultra 9 285K | |
| Intel Core Ultra 5 250K Plus | |
| Intel Core i7-14700K -3! | |
| Intel Core Ultra 5 245K | |
| Far Cry 5 | |
| 1280x720 Low Preset AA:T | |
| AMD Ryzen 7 9800X3D | |
| AMD Ryzen 7 9850X3D | |
| AMD Ryzen 9 9950X3D | |
| AMD Ryzen 7 7800X3D | |
| AMD Ryzen 9 7950X3D | |
| Intel Core i9-14900K | |
| AMD Ryzen 9 9900X | |
| AMD Ryzen 5 9600X | |
| AMD Ryzen 7 9700X | |
| Intel Core Ultra 7 270K Plus | |
| Intel Core i5-14600K | |
| AMD Ryzen 9 9950X | |
| Intel Core Ultra 5 250K Plus | |
| Intel Core Ultra 9 285K | |
| Intel Core Ultra 5 245K | |
| Intel Core i7-14700K | |
| 1920x1080 Ultra Preset AA:T | |
| AMD Ryzen 7 9800X3D | |
| AMD Ryzen 7 9850X3D | |
| AMD Ryzen 9 9950X3D | |
| AMD Ryzen 7 7800X3D | |
| AMD Ryzen 9 7950X3D | |
| AMD Ryzen 9 9900X | |
| Intel Core i9-14900K | |
| AMD Ryzen 5 9600X | |
| AMD Ryzen 7 9700X | |
| Intel Core i5-14600K | |
| AMD Ryzen 9 9950X | |
| Intel Core Ultra 7 270K Plus | |
| Intel Core Ultra 5 250K Plus | |
| Intel Core Ultra 9 285K | |
| Intel Core Ultra 5 245K | |
| Intel Core i7-14700K | |
| X-Plane 11.11 | |
| 1280x720 low (fps_test=1) | |
| AMD Ryzen 7 9700X | |
| AMD Ryzen 9 9900X | |
| AMD Ryzen 7 9850X3D | |
| AMD Ryzen 5 9600X | |
| Intel Core i9-14900K | |
| AMD Ryzen 9 9950X3D | |
| Intel Core i5-14600K | |
| Intel Core i7-14700K | |
| AMD Ryzen 9 7950X3D | |
| AMD Ryzen 7 7800X3D | |
| AMD Ryzen 9 9950X | |
| AMD Ryzen 7 9800X3D | |
| Intel Core Ultra 9 285K | |
| Intel Core Ultra 7 270K Plus | |
| Intel Core Ultra 5 250K Plus | |
| Intel Core Ultra 5 245K | |
| 1920x1080 high (fps_test=3) | |
| AMD Ryzen 7 9850X3D | |
| AMD Ryzen 9 9950X3D | |
| AMD Ryzen 7 7800X3D | |
| AMD Ryzen 9 7950X3D | |
| AMD Ryzen 7 9800X3D | |
| AMD Ryzen 7 9700X | |
| AMD Ryzen 9 9900X | |
| AMD Ryzen 5 9600X | |
| Intel Core i9-14900K | |
| AMD Ryzen 9 9950X | |
| Intel Core i7-14700K | |
| Intel Core i5-14600K | |
| Intel Core Ultra 9 285K | |
| Intel Core Ultra 7 270K Plus | |
| Intel Core Ultra 5 250K Plus | |
| Intel Core Ultra 5 245K | |
| Dota 2 Reborn | |
| 1280x720 min (0/3) fastest | |
| AMD Ryzen 7 9850X3D | |
| AMD Ryzen 9 9950X3D | |
| AMD Ryzen 7 9800X3D | |
| AMD Ryzen 7 7800X3D | |
| AMD Ryzen 7 9700X | |
| AMD Ryzen 9 7950X3D | |
| AMD Ryzen 9 9900X | |
| AMD Ryzen 9 9950X | |
| Intel Core i9-14900K | |
| AMD Ryzen 5 9600X | |
| Intel Core Ultra 7 270K Plus | |
| Intel Core i5-14600K | |
| Intel Core Ultra 9 285K | |
| Intel Core Ultra 5 250K Plus | |
| Intel Core i7-14700K | |
| Intel Core Ultra 5 245K | |
| 1920x1080 ultra (3/3) best looking | |
| AMD Ryzen 7 9850X3D | |
| AMD Ryzen 7 9800X3D | |
| AMD Ryzen 9 9950X3D | |
| AMD Ryzen 7 7800X3D | |
| AMD Ryzen 9 7950X3D | |
| AMD Ryzen 9 9900X | |
| AMD Ryzen 9 9950X | |
| AMD Ryzen 7 9700X | |
| AMD Ryzen 5 9600X | |
| Intel Core i9-14900K | |
| Intel Core Ultra 7 270K Plus | |
| Intel Core i5-14600K | |
| Intel Core Ultra 9 285K | |
| Intel Core Ultra 5 250K Plus | |
| Intel Core i7-14700K | |
| Intel Core Ultra 5 245K | |
| The Witcher 3 | |
| 1024x768 Low Graphics & Postprocessing | |
| AMD Ryzen 7 9800X3D | |
| AMD Ryzen 9 7950X3D | |
| AMD Ryzen 7 7800X3D | |
| AMD Ryzen 9 9950X3D | |
| AMD Ryzen 7 9850X3D | |
| Intel Core i9-14900K | |
| AMD Ryzen 9 9950X | |
| AMD Ryzen 5 9600X | |
| AMD Ryzen 7 9700X | |
| Intel Core Ultra 7 270K Plus | |
| AMD Ryzen 9 9900X | |
| Intel Core Ultra 5 250K Plus | |
| Intel Core i7-14700K | |
| Intel Core i5-14600K | |
| Intel Core Ultra 9 285K | |
| Intel Core Ultra 5 245K | |
| 1920x1080 Ultra Graphics & Postprocessing (HBAO+) | |
| Intel Core i5-14600K | |
| AMD Ryzen 7 7800X3D | |
| Intel Core i9-14900K | |
| Intel Core Ultra 5 250K Plus | |
| Intel Core Ultra 5 245K | |
| Intel Core Ultra 7 270K Plus | |
| AMD Ryzen 9 7950X3D | |
| AMD Ryzen 7 9800X3D | |
| Intel Core Ultra 9 285K | |
| AMD Ryzen 9 9950X3D | |
| Intel Core i7-14700K | |
| AMD Ryzen 5 9600X | |
| AMD Ryzen 9 9950X | |
| AMD Ryzen 7 9700X | |
| AMD Ryzen 7 9850X3D | |
| AMD Ryzen 9 9900X | |
| Shadow of the Tomb Raider | |
| 1280x720 Lowest Preset | |
| AMD Ryzen 7 9800X3D | |
| AMD Ryzen 7 7800X3D | |
| AMD Ryzen 9 9950X3D | |
| AMD Ryzen 7 9850X3D | |
| AMD Ryzen 9 7950X3D | |
| Intel Core Ultra 7 270K Plus | |
| AMD Ryzen 7 9700X | |
| AMD Ryzen 9 9950X | |
| Intel Core i9-14900K | |
| AMD Ryzen 9 9900X | |
| AMD Ryzen 5 9600X | |
| Intel Core Ultra 9 285K | |
| Intel Core i5-14600K | |
| Intel Core i7-14700K | |
| Intel Core Ultra 5 250K Plus | |
| Intel Core Ultra 5 245K | |
| 1920x1080 Highest Preset AA:T | |
| AMD Ryzen 7 7800X3D | |
| AMD Ryzen 7 9800X3D | |
| AMD Ryzen 7 9850X3D | |
| AMD Ryzen 9 9950X3D | |
| AMD Ryzen 9 7950X3D | |
| Intel Core Ultra 7 270K Plus | |
| Intel Core i9-14900K | |
| AMD Ryzen 9 9900X | |
| AMD Ryzen 7 9700X | |
| AMD Ryzen 9 9950X | |
| AMD Ryzen 5 9600X | |
| Intel Core Ultra 5 250K Plus | |
| Intel Core i5-14600K | |
| Intel Core Ultra 9 285K | |
| Intel Core i7-14700K | |
| Intel Core Ultra 5 245K | |
| Strange Brigade | |
| 1280x720 lowest AF:1 | |
| AMD Ryzen 7 9700X | |
| AMD Ryzen 7 9800X3D | |
| Intel Core i9-14900K | |
| AMD Ryzen 7 7800X3D | |
| AMD Ryzen 7 9850X3D | |
| AMD Ryzen 5 9600X | |
| Intel Core i5-14600K | |
| Intel Core Ultra 9 285K | |
| Intel Core Ultra 5 250K Plus | |
| Intel Core Ultra 7 270K Plus | |
| AMD Ryzen 9 9900X | |
| AMD Ryzen 9 9950X3D | |
| AMD Ryzen 9 7950X3D | |
| Intel Core Ultra 5 245K | |
| Intel Core i7-14700K | |
| 1920x1080 ultra AA:ultra AF:16 | |
| AMD Ryzen 7 9700X | |
| AMD Ryzen 7 9800X3D | |
| Intel Core i9-14900K | |
| AMD Ryzen 7 7800X3D | |
| AMD Ryzen 7 9850X3D | |
| AMD Ryzen 5 9600X | |
| AMD Ryzen 9 9950X3D | |
| Intel Core Ultra 9 285K | |
| Intel Core i5-14600K | |
| AMD Ryzen 9 9900X | |
| Intel Core Ultra 7 270K Plus | |
| Intel Core Ultra 5 250K Plus | |
| AMD Ryzen 9 7950X3D | |
| Intel Core Ultra 5 245K | |
| Intel Core i7-14700K | |
Мы обнаружили аналогичные тенденции при настройках QHD и 4K Ultra. В этих разрешениях, ограниченных GPU, разница между Ryzen 7 9850X3D и 9800X3D практически нулевая и находится в пределах погрешности округления.
На сайте Ryzen 9 9900X и Core i9-14900K показали хорошие результаты, но чипы AMD X3D явно лидируют, демонстрируя полезность 3D V-Cache, особенно в плане более стабильных 1% и 0,1% минимумов.
| QHD and 4K Gaming Performance rating - Percent | |
| AMD Ryzen 7 9800X3D | |
| AMD Ryzen 7 7800X3D -2! | |
| AMD Ryzen 7 9850X3D | |
| AMD Ryzen 9 9950X3D | |
| AMD Ryzen 9 7950X3D -2! | |
| Intel Core i9-14900K -2! | |
| AMD Ryzen 7 9700X | |
| AMD Ryzen 9 9900X | |
| Intel Core Ultra 7 270K Plus | |
| Intel Core i5-14600K -2! | |
| AMD Ryzen 5 9600X | |
| Intel Core Ultra 5 250K Plus | |
| AMD Ryzen 9 9950X -2! | |
| Intel Core Ultra 9 285K | |
| Intel Core i7-14700K -2! | |
| Intel Core Ultra 5 245K | |
| F1 22 | |
| 2560x1440 Ultra High Preset AA:T AF:16x | |
| AMD Ryzen 7 9800X3D | |
| AMD Ryzen 7 7800X3D | |
| AMD Ryzen 5 9600X | |
| Intel Core i9-14900K | |
| AMD Ryzen 9 9900X | |
| Intel Core i5-14600K | |
| AMD Ryzen 7 9700X | |
| AMD Ryzen 9 7950X3D | |
| AMD Ryzen 9 9950X3D | |
| AMD Ryzen 7 9850X3D | |
| AMD Ryzen 9 9950X | |
| Intel Core Ultra 5 245K | |
| Intel Core Ultra 7 270K Plus | |
| Intel Core i7-14700K | |
| Intel Core Ultra 9 285K | |
| Intel Core Ultra 5 250K Plus | |
| 3840x2160 Ultra High Preset AA:T AF:16x | |
| AMD Ryzen 9 9900X | |
| AMD Ryzen 7 9800X3D | |
| Intel Core Ultra 5 245K | |
| AMD Ryzen 5 9600X | |
| AMD Ryzen 7 9700X | |
| AMD Ryzen 7 7800X3D | |
| AMD Ryzen 9 9950X | |
| Intel Core Ultra 7 270K Plus | |
| Intel Core Ultra 5 250K Plus | |
| Intel Core i5-14600K | |
| Intel Core i9-14900K | |
| AMD Ryzen 9 9950X3D | |
| Intel Core Ultra 9 285K | |
| AMD Ryzen 9 7950X3D | |
| Intel Core i7-14700K | |
| AMD Ryzen 7 9850X3D | |
| Far Cry 5 | |
| 2560x1440 Ultra Preset AA:T | |
| AMD Ryzen 7 9800X3D | |
| AMD Ryzen 7 9850X3D | |
| AMD Ryzen 9 9950X3D | |
| AMD Ryzen 7 7800X3D | |
| AMD Ryzen 9 7950X3D | |
| AMD Ryzen 9 9900X | |
| Intel Core i9-14900K | |
| AMD Ryzen 5 9600X | |
| AMD Ryzen 7 9700X | |
| Intel Core i5-14600K | |
| AMD Ryzen 9 9950X | |
| Intel Core Ultra 7 270K Plus | |
| Intel Core Ultra 5 250K Plus | |
| Intel Core Ultra 9 285K | |
| Intel Core i7-14700K | |
| Intel Core Ultra 5 245K | |
| 3840x2160 Ultra Preset AA:T | |
| AMD Ryzen 7 7800X3D | |
| Intel Core i9-14900K | |
| AMD Ryzen 7 9800X3D | |
| AMD Ryzen 9 7950X3D | |
| Intel Core i5-14600K | |
| AMD Ryzen 9 9950X3D | |
| AMD Ryzen 7 9850X3D | |
| Intel Core Ultra 7 270K Plus | |
| AMD Ryzen 5 9600X | |
| Intel Core Ultra 5 250K Plus | |
| AMD Ryzen 9 9900X | |
| AMD Ryzen 9 9950X | |
| AMD Ryzen 7 9700X | |
| Intel Core Ultra 9 285K | |
| Intel Core Ultra 5 245K | |
| Intel Core i7-14700K | |
| X-Plane 11.11 - 3840x2160 high (fps_test=3) | |
| AMD Ryzen 7 9850X3D | |
| AMD Ryzen 7 7800X3D | |
| AMD Ryzen 9 7950X3D | |
| AMD Ryzen 9 9950X3D | |
| AMD Ryzen 7 9800X3D | |
| AMD Ryzen 7 9700X | |
| AMD Ryzen 5 9600X | |
| Intel Core i9-14900K | |
| AMD Ryzen 9 9900X | |
| Intel Core i7-14700K | |
| Intel Core i5-14600K | |
| AMD Ryzen 9 9950X | |
| Intel Core Ultra 9 285K | |
| Intel Core Ultra 7 270K Plus | |
| Intel Core Ultra 5 250K Plus | |
| Intel Core Ultra 5 245K | |
| Dota 2 Reborn - 3840x2160 ultra (3/3) best looking | |
| AMD Ryzen 7 9800X3D | |
| AMD Ryzen 7 9850X3D | |
| AMD Ryzen 9 9950X3D | |
| AMD Ryzen 7 7800X3D | |
| AMD Ryzen 9 7950X3D | |
| AMD Ryzen 9 9950X | |
| AMD Ryzen 7 9700X | |
| AMD Ryzen 9 9900X | |
| Intel Core i9-14900K | |
| AMD Ryzen 5 9600X | |
| Intel Core Ultra 7 270K Plus | |
| Intel Core i5-14600K | |
| Intel Core i7-14700K | |
| Intel Core Ultra 9 285K | |
| Intel Core Ultra 5 250K Plus | |
| Intel Core Ultra 5 245K | |
| The Witcher 3 - 3840x2160 Ultra Graphics & Postprocessing (HBAO+) | |
| Intel Core i9-14900K | |
| Intel Core Ultra 5 245K | |
| AMD Ryzen 7 9800X3D | |
| Intel Core Ultra 7 270K Plus | |
| AMD Ryzen 7 7800X3D | |
| Intel Core Ultra 5 250K Plus | |
| Intel Core i5-14600K | |
| AMD Ryzen 9 7950X3D | |
| AMD Ryzen 5 9600X | |
| Intel Core i7-14700K | |
| Intel Core Ultra 9 285K | |
| AMD Ryzen 7 9700X | |
| AMD Ryzen 9 9950X3D | |
| AMD Ryzen 9 9900X | |
| AMD Ryzen 7 9850X3D | |
| AMD Ryzen 9 9950X | |
| Shadow of the Tomb Raider | |
| 2560x1440 Highest Preset AA:T | |
| AMD Ryzen 7 7800X3D | |
| AMD Ryzen 9 7950X3D | |
| AMD Ryzen 7 9800X3D | |
| AMD Ryzen 9 9950X3D | |
| AMD Ryzen 7 9850X3D | |
| Intel Core Ultra 7 270K Plus | |
| Intel Core i9-14900K | |
| AMD Ryzen 9 9900X | |
| AMD Ryzen 9 9950X | |
| AMD Ryzen 7 9700X | |
| AMD Ryzen 5 9600X | |
| Intel Core i5-14600K | |
| Intel Core Ultra 5 250K Plus | |
| Intel Core i7-14700K | |
| Intel Core Ultra 9 285K | |
| Intel Core Ultra 5 245K | |
| 3840x2160 Highest Preset AA:T | |
| Intel Core i9-14900K | |
| Intel Core i5-14600K | |
| AMD Ryzen 5 9600X | |
| AMD Ryzen 7 7800X3D | |
| AMD Ryzen 9 7950X3D | |
| Intel Core Ultra 5 245K | |
| Intel Core Ultra 5 250K Plus | |
| Intel Core Ultra 7 270K Plus | |
| AMD Ryzen 9 9900X | |
| AMD Ryzen 7 9700X | |
| AMD Ryzen 7 9800X3D | |
| Intel Core i7-14700K | |
| AMD Ryzen 9 9950X3D | |
| AMD Ryzen 7 9850X3D | |
| Intel Core Ultra 9 285K | |
| AMD Ryzen 9 9950X | |
| Strange Brigade | |
| 2560x1440 ultra AA:ultra AF:16 | |
| Intel Core i9-14900K | |
| AMD Ryzen 7 9800X3D | |
| AMD Ryzen 7 9700X | |
| AMD Ryzen 7 7800X3D | |
| AMD Ryzen 5 9600X | |
| Intel Core Ultra 7 270K Plus | |
| Intel Core i5-14600K | |
| AMD Ryzen 7 9850X3D | |
| Intel Core Ultra 5 250K Plus | |
| AMD Ryzen 9 9900X | |
| AMD Ryzen 9 7950X3D | |
| Intel Core Ultra 9 285K | |
| AMD Ryzen 9 9950X3D | |
| Intel Core Ultra 5 245K | |
| Intel Core i7-14700K | |
| 3840x2160 ultra AA:ultra AF:16 | |
| Intel Core i9-14900K | |
| AMD Ryzen 7 7800X3D | |
| Intel Core i5-14600K | |
| AMD Ryzen 7 9800X3D | |
| Intel Core Ultra 5 250K Plus | |
| Intel Core Ultra 7 270K Plus | |
| AMD Ryzen 5 9600X | |
| AMD Ryzen 9 9900X | |
| AMD Ryzen 9 7950X3D | |
| Intel Core Ultra 5 245K | |
| AMD Ryzen 7 9700X | |
| AMD Ryzen 7 9850X3D | |
| Intel Core Ultra 9 285K | |
| AMD Ryzen 9 9950X3D | |
| Intel Core i7-14700K | |
AMD Ryzen 7 9850X3D с Nvidia GeForce RTX 4090
| мин. | сред. | выс. | макс. | QHD DLSS | QHD | 4K DLSS | 4K | |
|---|---|---|---|---|---|---|---|---|
| The Witcher 3 (2015) | 835 | 784 | 603 | 282 | 242 | 267 | ||
| Dota 2 Reborn (2015) | 399 | 352 | 335 | 309 | 297 | |||
| Final Fantasy XV Benchmark (2018) | 235 | 234 | 225 | 202 | 137 | |||
| X-Plane 11.11 (2018) | 247 | 229 | 202 | 165.8 | ||||
| Far Cry 5 (2018) | 375 | 333 | 321 | 304 | 285 | 179 | ||
| Strange Brigade (2018) | 745 | 638 | 619 | 589 | 513 | 277 | ||
| Shadow of the Tomb Raider (2018) | 402 | 374 | 385 | 370 | 311 | 178.7 | ||
| Borderlands 3 (2019) | 315 | 297 | 263 | 246 | 213 | 123.3 | ||
| F1 22 (2022) | 494 | 508 | 444 | 213 | 155.6 | 81.7 | ||
| Baldur's Gate 3 (2023) | 461 | 372 | 323 | 321 | 308 | 244 | 208 | 139.8 |
| Cyberpunk 2077 (2023) | 264 | 261 | 236 | 211 | 157.7 | 147 | 80.1 | 71.7 |
| Assassin's Creed Mirage (2023) | 287 | 268 | 255 | 209 | 175 | 154 | 120 | |
| Avatar Frontiers of Pandora (2023) | 193.8 | 189.9 | 177.4 | 142.2 | 103 | 86.8 | 56.2 | |
| Black Myth: Wukong (2024) | 194 | 151 | 122 | 81 | 86 | 65 | 66 | 41 |
| Assassin's Creed Shadows (2025) | 135 | 129 | 117 | 95 | 95 | 82 | 80 | 63 |
| F1 25 (2025) | 409 | 389 | 367 | 88.8 | 96.2 | 56.4 | 50.7 | 27.9 |
| Death Stranding 2 (2026) | 180.3 | 158.8 | 146.1 | 123.9 | 124.4 | 106 | 99.1 | 71.8 |
Энергопотребление: На этот раз корона эффективности досталась Intel
Ryzen 7 9850X3D потребляет на 19% больше энергии, чем Core Ultra 7 270K Plus при выполнении одноядерного теста Cinebench R23.
Однако последний потребляет на 41% больше энергии в многоядерных тестах Cinebench благодаря большему количеству ядер.
Между Ryzen 7 9850X3D и 9800X3D разница в одноядерном и многоядерном энергопотреблении составляет всего 3%.
Во время игры The Witcher 3 в разрешении 1080p Ultra, Ryzen 7 9850X3D потребляет на 4% меньше энергии, чем Ryzen 7 9800X3D и Core Ultra 7 270K Plus.
Все три процессора демонстрируют более или менее схожие показатели энергопотребления в Cyberpunk 2077: Призрачная свобода в режиме 1080p Ultra.
Потребляемая мощность: Внешний монитор
| Power Consumption / Cinebench R15 Multi (external Monitor) | |
| Intel Core i9-14900K, NVIDIA GeForce RTX 4090 | |
| Intel Core i7-14700K, NVIDIA GeForce RTX 4090 | |
| Intel Core Ultra 9 285K, NVIDIA GeForce RTX 4090 (Idle: 76.2 W) | |
| Intel Core Ultra 7 270K Plus, NVIDIA GeForce RTX 4090 | |
| Intel Core i5-14600K, NVIDIA GeForce RTX 4090 | |
| AMD Ryzen 9 9950X, NVIDIA GeForce RTX 4090 (Idle: 100 W) | |
| AMD Ryzen 9 9950X3D, NVIDIA GeForce RTX 4090 | |
| AMD Ryzen 9 9900X, NVIDIA GeForce RTX 4090 (Idle: 85.1 W) | |
| AMD Ryzen 9 7950X3D, NVIDIA GeForce RTX 4090 | |
| AMD Ryzen 7 9850X3D, NVIDIA GeForce RTX 4090 (Idle: 96 W) | |
| Intel Core Ultra 5 245K, NVIDIA GeForce RTX 4090 | |
| AMD Ryzen 7 9800X3D, NVIDIA GeForce RTX 4090 | |
| Intel Core Ultra 5 250K Plus, NVIDIA GeForce RTX 4090 | |
| AMD Ryzen 5 9600X, NVIDIA GeForce RTX 4090 | |
| AMD Ryzen 7 7800X3D, NVIDIA GeForce RTX 4090 | |
| AMD Ryzen 7 9700X, NVIDIA GeForce RTX 4090 (Idle: 83 W) | |
| Power Consumption / Cinebench R20 Single (external Monitor) | |
| Intel Core i7-14700K, NVIDIA GeForce RTX 4090 | |
| AMD Ryzen 9 9950X, NVIDIA GeForce RTX 4090 (100) | |
| AMD Ryzen 9 9950X3D, NVIDIA GeForce RTX 4090 | |
| AMD Ryzen 7 9850X3D, NVIDIA GeForce RTX 4090 (96) | |
| AMD Ryzen 9 9900X, NVIDIA GeForce RTX 4090 (85.1) | |
| AMD Ryzen 7 9700X, NVIDIA GeForce RTX 4090 (83) | |
| Intel Core Ultra 9 285K, NVIDIA GeForce RTX 4090 (76.2) | |
| Power Consumption / Cinebench R20 Multi (external Monitor) | |
| Intel Core i7-14700K, NVIDIA GeForce RTX 4090 | |
| Intel Core Ultra 9 285K, NVIDIA GeForce RTX 4090 (76.2) | |
| AMD Ryzen 9 9950X, NVIDIA GeForce RTX 4090 (100) | |
| AMD Ryzen 9 9950X3D, NVIDIA GeForce RTX 4090 | |
| AMD Ryzen 9 9900X, NVIDIA GeForce RTX 4090 (85.1) | |
| AMD Ryzen 7 9850X3D, NVIDIA GeForce RTX 4090 (96) | |
| AMD Ryzen 7 9700X, NVIDIA GeForce RTX 4090 (83) | |
| Power Consumption / Cinebench R23 Single (external Monitor) | |
| AMD Ryzen 7 7800X3D, NVIDIA GeForce RTX 4090 | |
| Intel Core i7-14700K, NVIDIA GeForce RTX 4090 | |
| Intel Core i9-14900K, NVIDIA GeForce RTX 4090 | |
| Intel Core i5-14600K, NVIDIA GeForce RTX 4090 | |
| AMD Ryzen 5 9600X, NVIDIA GeForce RTX 4090 | |
| AMD Ryzen 9 9950X, NVIDIA GeForce RTX 4090 (100) | |
| AMD Ryzen 9 9950X3D, NVIDIA GeForce RTX 4090 | |
| AMD Ryzen 9 9900X, NVIDIA GeForce RTX 4090 (85.1) | |
| AMD Ryzen 7 9850X3D, NVIDIA GeForce RTX 4090 (96) | |
| AMD Ryzen 7 9800X3D, NVIDIA GeForce RTX 4090 | |
| Intel Core Ultra 5 245K, NVIDIA GeForce RTX 4090 | |
| AMD Ryzen 7 9700X, NVIDIA GeForce RTX 4090 (83) | |
| Intel Core Ultra 9 285K, NVIDIA GeForce RTX 4090 (76.2) | |
| Intel Core Ultra 7 270K Plus, NVIDIA GeForce RTX 4090 | |
| Intel Core Ultra 5 250K Plus, NVIDIA GeForce RTX 4090 | |
| Power Consumption / Cinebench R23 Multi (external Monitor) | |
| Intel Core i9-14900K, NVIDIA GeForce RTX 4090 | |
| Intel Core i7-14700K, NVIDIA GeForce RTX 4090 | |
| Intel Core Ultra 7 270K Plus, NVIDIA GeForce RTX 4090 | |
| Intel Core Ultra 9 285K, NVIDIA GeForce RTX 4090 (76.2) | |
| Intel Core i5-14600K, NVIDIA GeForce RTX 4090 | |
| AMD Ryzen 9 9950X, NVIDIA GeForce RTX 4090 (100) | |
| AMD Ryzen 9 9950X3D, NVIDIA GeForce RTX 4090 | |
| AMD Ryzen 9 7950X3D, NVIDIA GeForce RTX 4090 | |
| AMD Ryzen 9 9900X, NVIDIA GeForce RTX 4090 (85.1) | |
| AMD Ryzen 7 9850X3D, NVIDIA GeForce RTX 4090 (96) | |
| AMD Ryzen 7 9800X3D, NVIDIA GeForce RTX 4090 | |
| Intel Core Ultra 5 250K Plus, NVIDIA GeForce RTX 4090 | |
| Intel Core Ultra 5 245K, NVIDIA GeForce RTX 4090 | |
| AMD Ryzen 5 9600X, NVIDIA GeForce RTX 4090 | |
| AMD Ryzen 7 7800X3D, NVIDIA GeForce RTX 4090 | |
| AMD Ryzen 7 9700X, NVIDIA GeForce RTX 4090 (83) | |
| Power Consumption / Cinebench 2024 Single Power (external Monitor) | |
| AMD Ryzen 9 9950X3D, NVIDIA GeForce RTX 4090 | |
| AMD Ryzen 9 9950X, NVIDIA GeForce RTX 4090 | |
| AMD Ryzen 9 9900X, NVIDIA GeForce RTX 4090 | |
| AMD Ryzen 7 9850X3D, NVIDIA GeForce RTX 4090 | |
| AMD Ryzen 7 9700X, NVIDIA GeForce RTX 4090 | |
| Intel Core Ultra 9 285K, NVIDIA GeForce RTX 4090 | |
| Power Consumption / Cinebench 2024 Multi Power (external Monitor) | |
| Intel Core Ultra 9 285K, NVIDIA GeForce RTX 4090 (76.2) | |
| AMD Ryzen 9 9950X, NVIDIA GeForce RTX 4090 (100) | |
| AMD Ryzen 9 9950X3D, NVIDIA GeForce RTX 4090 | |
| AMD Ryzen 9 9900X, NVIDIA GeForce RTX 4090 (85.1) | |
| AMD Ryzen 7 9850X3D, NVIDIA GeForce RTX 4090 (96) | |
| AMD Ryzen 7 9700X, NVIDIA GeForce RTX 4090 (83) | |
| Power Consumption / Prime95 V2810 Stress (external Monitor) | |
| Intel Core i9-14900K, NVIDIA GeForce RTX 4090 | |
| Intel Core i7-14700K, NVIDIA GeForce RTX 4090 | |
| Intel Core Ultra 9 285K, NVIDIA GeForce RTX 4090 (Idle: 76.2 W) | |
| Intel Core i5-14600K, NVIDIA GeForce RTX 4090 | |
| Intel Core Ultra 7 270K Plus, NVIDIA GeForce RTX 4090 | |
| AMD Ryzen 9 9950X3D, NVIDIA GeForce RTX 4090 | |
| AMD Ryzen 9 9950X, NVIDIA GeForce RTX 4090 (Idle: 100 W) | |
| AMD Ryzen 9 9900X, NVIDIA GeForce RTX 4090 (Idle: 85.1 W) | |
| AMD Ryzen 9 7950X3D, NVIDIA GeForce RTX 4090 | |
| AMD Ryzen 7 9800X3D, NVIDIA GeForce RTX 4090 | |
| Intel Core Ultra 5 245K, NVIDIA GeForce RTX 4090 | |
| AMD Ryzen 7 9850X3D, NVIDIA GeForce RTX 4090 (Idle: 96 W) | |
| Intel Core Ultra 5 250K Plus, NVIDIA GeForce RTX 4090 | |
| AMD Ryzen 7 7800X3D, NVIDIA GeForce RTX 4090 | |
| AMD Ryzen 5 9600X, NVIDIA GeForce RTX 4090 | |
| AMD Ryzen 7 9700X, NVIDIA GeForce RTX 4090 (Idle: 83 W) | |
| Power Consumption / The Witcher 3 ultra (external Monitor) | |
| Intel Core i5-14600K, NVIDIA GeForce RTX 4090 | |
| Intel Core i9-14900K, NVIDIA GeForce RTX 4090 | |
| Intel Core i7-14700K, NVIDIA GeForce RTX 4090 | |
| AMD Ryzen 9 7950X3D, NVIDIA GeForce RTX 4090 | |
| AMD Ryzen 7 7800X3D, NVIDIA GeForce RTX 4090 | |
| AMD Ryzen 9 9950X3D, NVIDIA GeForce RTX 4090 | |
| AMD Ryzen 7 9800X3D, NVIDIA GeForce RTX 4090 | |
| Intel Core Ultra 5 245K, NVIDIA GeForce RTX 4090 | |
| AMD Ryzen 9 9950X, NVIDIA GeForce RTX 4090 (Idle: 100 W) | |
| Intel Core Ultra 7 270K Plus, NVIDIA GeForce RTX 4090 | |
| Intel Core Ultra 5 250K Plus, NVIDIA GeForce RTX 4090 | |
| AMD Ryzen 7 9850X3D, NVIDIA GeForce RTX 4090 (Idle: 96 W) | |
| AMD Ryzen 9 9900X, NVIDIA GeForce RTX 4090 (Idle: 85.1 W) | |
| Intel Core Ultra 9 285K, NVIDIA GeForce RTX 4090 (Idle: 76.2 W) | |
| AMD Ryzen 7 9700X, NVIDIA GeForce RTX 4090 (Idle: 83 W) | |
* ... меньше = лучше
Core Ultra 7 270K Plus показывает на 30% и 39% более высокую энергоэффективность в одноядерной и многоядерной производительности, соответственно, чем Ryzen 7 9850X3D.
В играх процессор Arrow Lake-S Refresh по-прежнему показывает лучшую эффективность, но на этот раз разрыв значительно сокращается - до 5%.
| Power Consumption / Cinebench R15 Multi Efficiency (external Monitor) | |
| AMD Ryzen 9 7950X3D, NVIDIA GeForce RTX 4090 | |
| AMD Ryzen 9 9950X3D, NVIDIA GeForce RTX 4090 | |
| AMD Ryzen 9 9950X, NVIDIA GeForce RTX 4090 | |
| Intel Core Ultra 5 250K Plus, NVIDIA GeForce RTX 4090 | |
| Intel Core Ultra 7 270K Plus, NVIDIA GeForce RTX 4090 | |
| Intel Core Ultra 9 285K, NVIDIA GeForce RTX 4090 | |
| AMD Ryzen 9 9900X, NVIDIA GeForce RTX 4090 | |
| AMD Ryzen 7 9700X, NVIDIA GeForce RTX 4090 | |
| Intel Core Ultra 5 245K, NVIDIA GeForce RTX 4090 | |
| AMD Ryzen 7 9800X3D, NVIDIA GeForce RTX 4090 | |
| AMD Ryzen 7 7800X3D, NVIDIA GeForce RTX 4090 | |
| AMD Ryzen 7 9850X3D, NVIDIA GeForce RTX 4090 | |
| Intel Core i7-14700K, NVIDIA GeForce RTX 4090 | |
| AMD Ryzen 5 9600X, NVIDIA GeForce RTX 4090 | |
| Intel Core i9-14900K, NVIDIA GeForce RTX 4090 | |
| Intel Core i5-14600K, NVIDIA GeForce RTX 4090 | |
| Power Consumption / Cinebench R23 Single Power Efficiency - external Monitor | |
| Intel Core Ultra 7 270K Plus, NVIDIA GeForce RTX 4090 | |
| Intel Core Ultra 5 250K Plus, NVIDIA GeForce RTX 4090 | |
| Intel Core Ultra 9 285K, NVIDIA GeForce RTX 4090 | |
| AMD Ryzen 7 9700X, NVIDIA GeForce RTX 4090 | |
| Intel Core Ultra 5 245K, NVIDIA GeForce RTX 4090 | |
| AMD Ryzen 9 9900X, NVIDIA GeForce RTX 4090 | |
| AMD Ryzen 7 9850X3D, NVIDIA GeForce RTX 4090 | |
| AMD Ryzen 7 9800X3D, NVIDIA GeForce RTX 4090 | |
| AMD Ryzen 9 9950X3D, NVIDIA GeForce RTX 4090 | |
| AMD Ryzen 9 9950X, NVIDIA GeForce RTX 4090 | |
| Intel Core i9-14900K, NVIDIA GeForce RTX 4090 | |
| AMD Ryzen 5 9600X, NVIDIA GeForce RTX 4090 | |
| Intel Core i7-14700K, NVIDIA GeForce RTX 4090 | |
| Intel Core i5-14600K, NVIDIA GeForce RTX 4090 | |
| AMD Ryzen 7 7800X3D, NVIDIA GeForce RTX 4090 | |
| Power Consumption / Cinebench R23 Multi Power Efficiency - external Monitor | |
| AMD Ryzen 9 9950X3D, NVIDIA GeForce RTX 4090 | |
| Intel Core Ultra 5 250K Plus, NVIDIA GeForce RTX 4090 | |
| AMD Ryzen 9 9950X, NVIDIA GeForce RTX 4090 | |
| Intel Core Ultra 7 270K Plus, NVIDIA GeForce RTX 4090 | |
| Intel Core Ultra 9 285K, NVIDIA GeForce RTX 4090 | |
| AMD Ryzen 9 7950X3D, NVIDIA GeForce RTX 4090 | |
| AMD Ryzen 9 9900X, NVIDIA GeForce RTX 4090 | |
| AMD Ryzen 7 9700X, NVIDIA GeForce RTX 4090 | |
| Intel Core Ultra 5 245K, NVIDIA GeForce RTX 4090 | |
| AMD Ryzen 7 9800X3D, NVIDIA GeForce RTX 4090 | |
| AMD Ryzen 7 9850X3D, NVIDIA GeForce RTX 4090 | |
| AMD Ryzen 7 7800X3D, NVIDIA GeForce RTX 4090 | |
| Intel Core i7-14700K, NVIDIA GeForce RTX 4090 | |
| AMD Ryzen 5 9600X, NVIDIA GeForce RTX 4090 | |
| Intel Core i9-14900K, NVIDIA GeForce RTX 4090 | |
| Intel Core i5-14600K, NVIDIA GeForce RTX 4090 | |
| Power Consumption / Cinebench 2024 Single Power Efficiency - external Monitor | |
| Intel Core Ultra 9 285K, NVIDIA GeForce RTX 4090 | |
| AMD Ryzen 7 9700X, NVIDIA GeForce RTX 4090 | |
| AMD Ryzen 7 9850X3D, NVIDIA GeForce RTX 4090 | |
| AMD Ryzen 9 9900X, NVIDIA GeForce RTX 4090 | |
| AMD Ryzen 9 9950X3D, NVIDIA GeForce RTX 4090 | |
| AMD Ryzen 9 9950X, NVIDIA GeForce RTX 4090 | |
| Power Consumption / Cinebench 2024 Multi Power Efficiency - external Monitor | |
| AMD Ryzen 9 9950X3D, NVIDIA GeForce RTX 4090 | |
| Intel Core Ultra 9 285K, NVIDIA GeForce RTX 4090 | |
| AMD Ryzen 9 9950X, NVIDIA GeForce RTX 4090 | |
| AMD Ryzen 7 9700X, NVIDIA GeForce RTX 4090 | |
| AMD Ryzen 9 9900X, NVIDIA GeForce RTX 4090 | |
| AMD Ryzen 7 9850X3D, NVIDIA GeForce RTX 4090 | |
| Power Consumption / Witcher 3 ultra Efficiency (external Monitor) | |
| Intel Core Ultra 5 250K Plus, NVIDIA GeForce RTX 4090 | |
| AMD Ryzen 7 9700X, NVIDIA GeForce RTX 4090 | |
| Intel Core Ultra 9 285K, NVIDIA GeForce RTX 4090 | |
| AMD Ryzen 7 7800X3D, NVIDIA GeForce RTX 4090 | |
| Intel Core Ultra 7 270K Plus, NVIDIA GeForce RTX 4090 | |
| Intel Core Ultra 5 245K, NVIDIA GeForce RTX 4090 | |
| AMD Ryzen 7 9800X3D, NVIDIA GeForce RTX 4090 | |
| AMD Ryzen 7 9850X3D, NVIDIA GeForce RTX 4090 | |
| AMD Ryzen 9 7950X3D, NVIDIA GeForce RTX 4090 | |
| AMD Ryzen 9 9950X3D, NVIDIA GeForce RTX 4090 | |
| AMD Ryzen 9 9900X, NVIDIA GeForce RTX 4090 | |
| AMD Ryzen 9 9950X, NVIDIA GeForce RTX 4090 | |
| Intel Core i9-14900K, NVIDIA GeForce RTX 4090 | |
| Intel Core i5-14600K, NVIDIA GeForce RTX 4090 | |
| Intel Core i7-14700K, NVIDIA GeForce RTX 4090 | |
Впечатления Notebookcheck от AMD Ryzen 7 9850X3D
Ryzen 7 9850X3D снова выводит AMD в лидеры гонки лучших игровых процессоров, несмотря на целенаправленные усилия Intel с Arrow Lake-S Refresh.
Однако Ryzen 7 9850X3D мало чем отличается от Ryzen 7 9800X3D и не является привлекательным обновлением даже для владельцев Ryzen 7 7800X3D.
Декларация о непредвзятости
Отбор устройств для обзора осуществляется нашей редакцией. Тестовый образец был предоставлен автору производителем или продавцом для целей настоящего обзора. Кредитор не имел никакого влияния на этот обзор, и производитель не получил копию этого обзора до публикации. Обязанности публиковать этот обзор не было. Являясь независимой медиа-компанией, Notebookcheck не подчиняется власти производителей, розничных продавцов или издателей.
Вот как проводит тестирование Notebookcheck
Каждый год Notebookcheck независимо проверяет сотни ноутбуков и смартфонов, используя стандартизированные процедуры, чтобы гарантировать сопоставимость всех результатов. В течение примерно 20 лет мы постоянно совершенствовали наши методы испытаний и при этом установили отраслевые стандарты. В наших испытательных лабораториях опытные специалисты и редакторы используют высококачественное измерительное оборудование. Эти тесты включают в себя многоэтапный процесс проверки. Наша сложная рейтинговая система основана на сотнях обоснованных измерений и критериев, что обеспечивает объективность.

