Notebookcheck Logo
Teaser

Intel Core Ultra 5 235 и 225F против AMD Ryzen - Какой процессор выгоднее?

Экономный и эффективный.

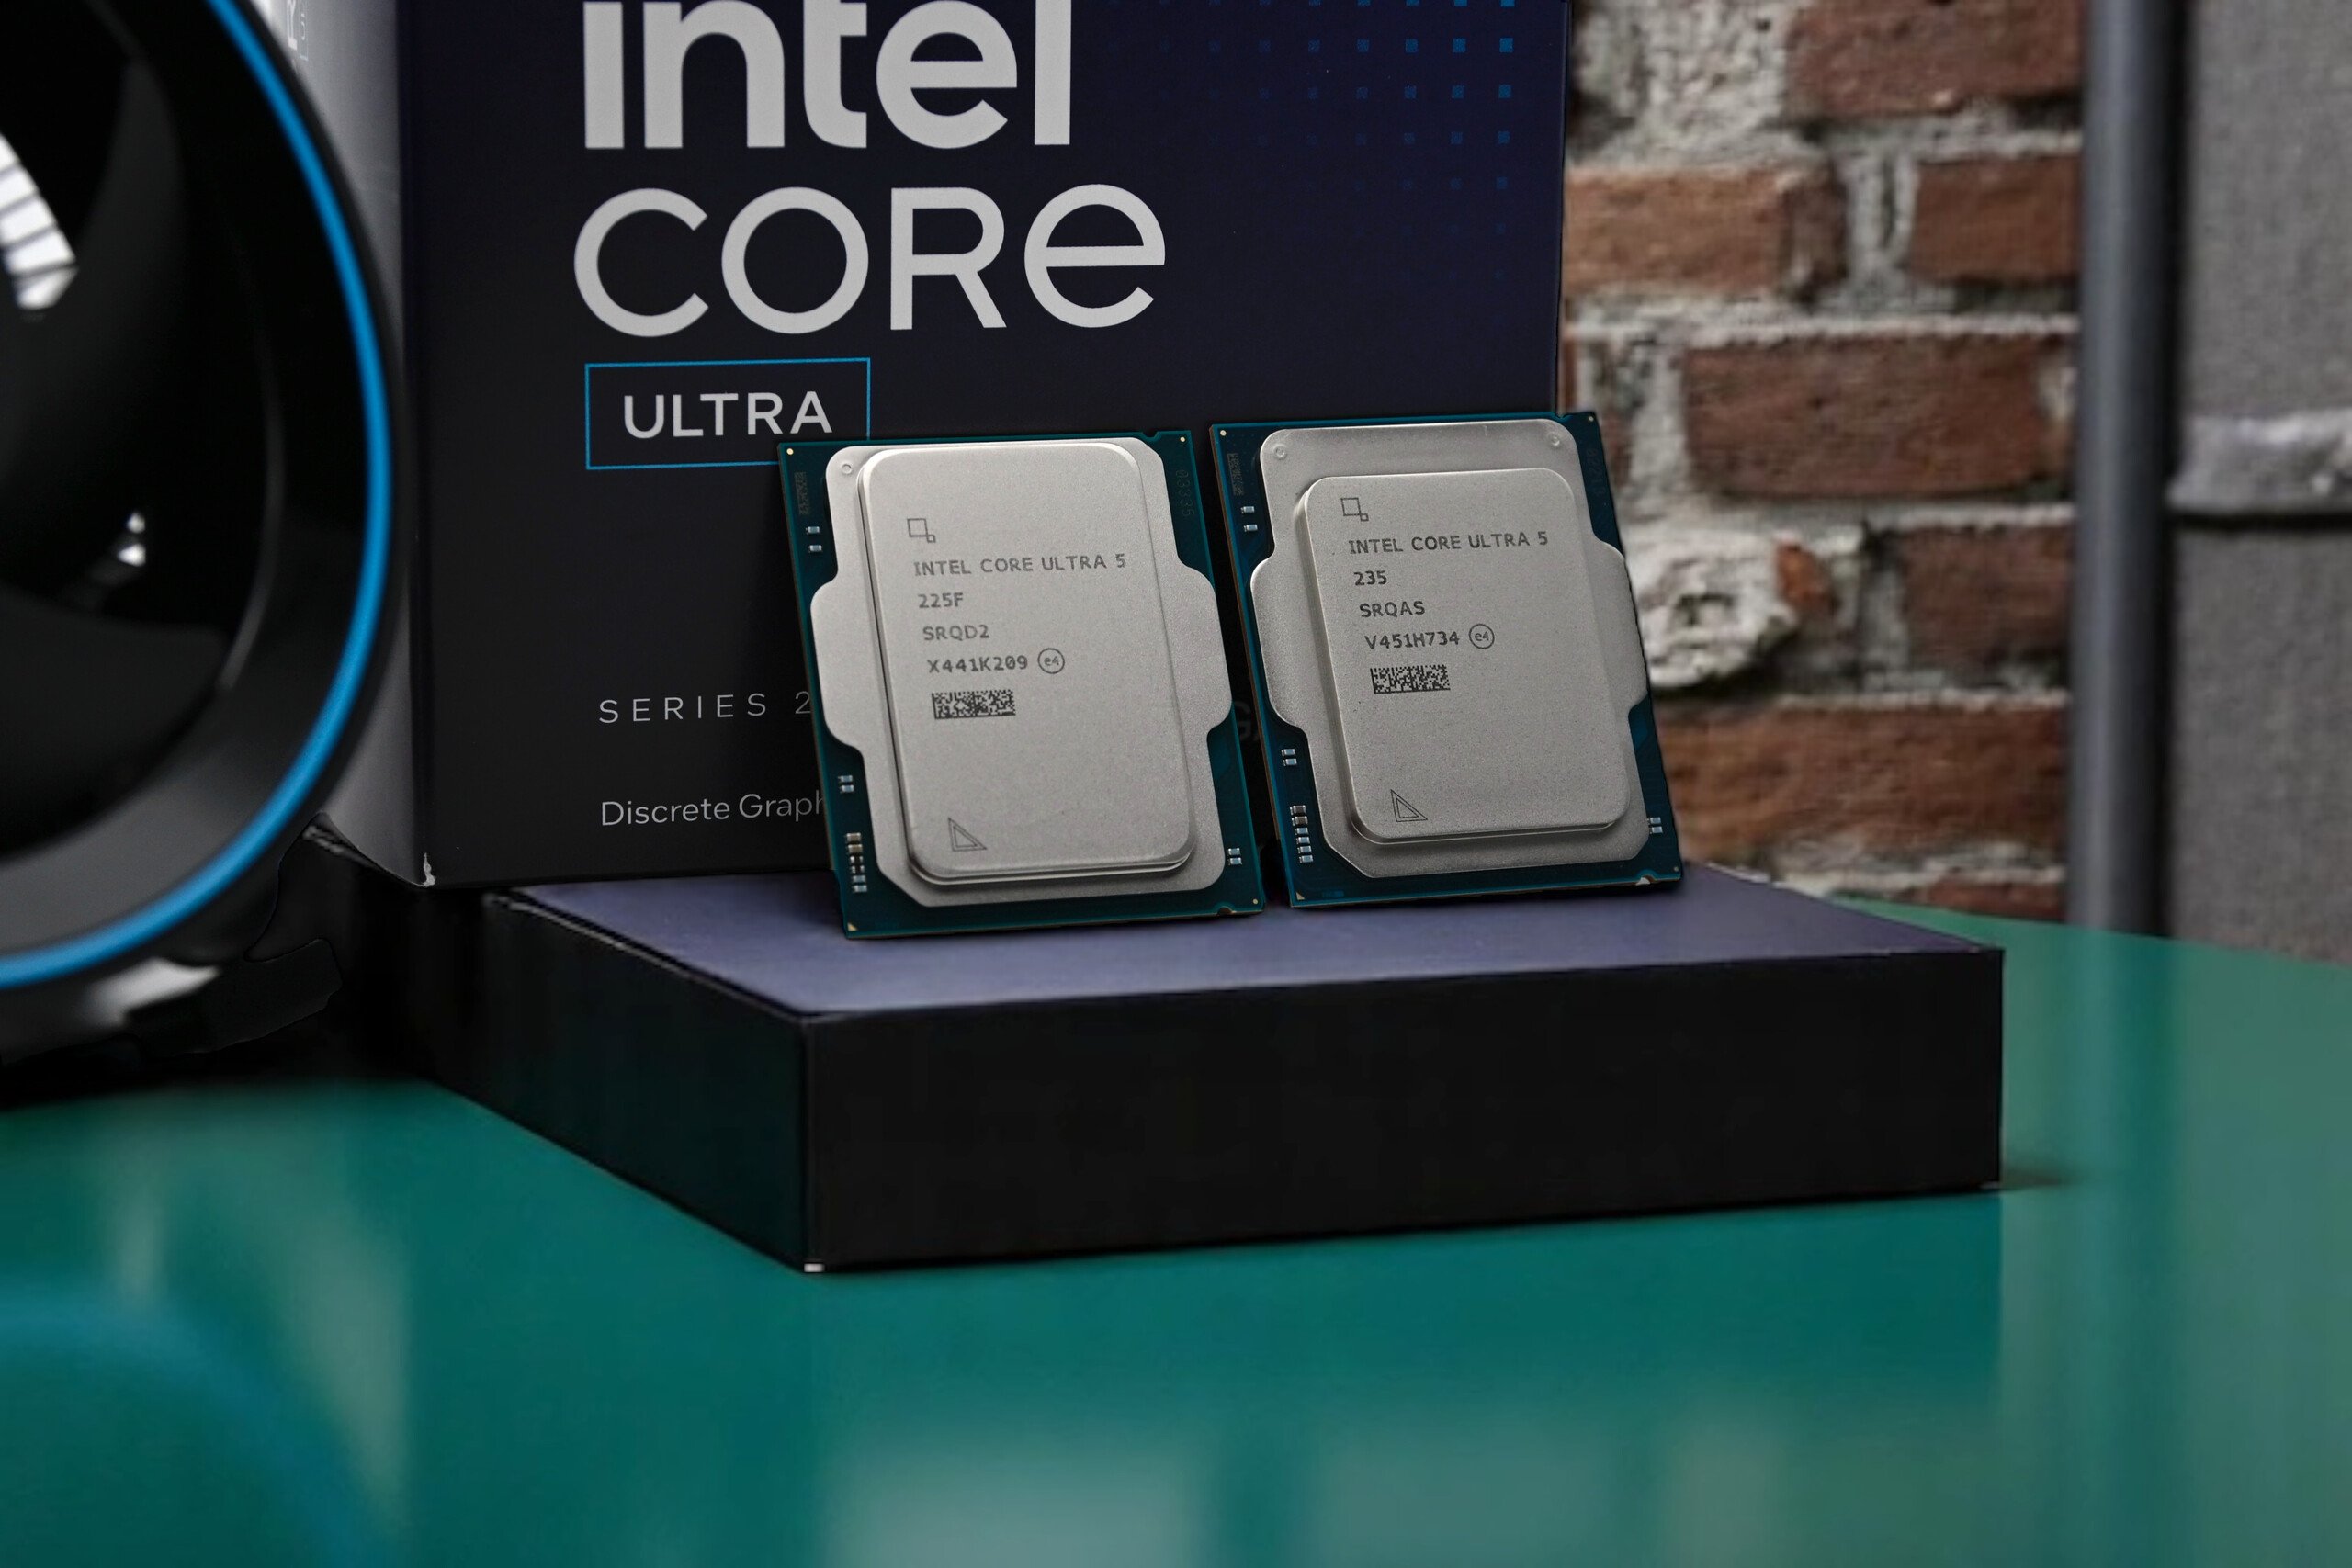
Старшие чипы Arrow Lake от Intel не произвели должного впечатления в сегменте настольных компьютеров. Теперь мы рассмотрим два более бюджетных и эффективных чипа с аналогичной архитектурой, а именно Core Ultra 5 235 и 225F. Потенциал у них огромный, но как новые процессоры среднего класса проявят себя в повседневной работе, под нагрузкой и в играх? В нашем обзоре вы найдете ответы, а также несколько сюрпризов.
Sebastian Bade, 👁 Sebastian Bade (перевод DeepL) Опубликовано 🇺🇸 🇩🇪 ...
CPU

Вердикт: Core Ultra 5 235 или Core Ultra 225F - какой чип Intel выгоднее?

Процессоры Intel Core Ultra 5 235 и Core Ultra 5 225F привносят глоток свежего воздуха в средний диапазон. Оба процессора основаны на новой архитектуре Arrow Lake и впечатляют своим современным производством, хорошей эффективностью и интегрированным NPU для приложений искусственного интеллекта. Однако с точки зрения производительности эти два процессора находятся лишь в нижней части среднего диапазона, что должно быть отражено в их цене, поскольку в настоящее время они все еще слишком дороги, чтобы вызвать интерес покупателей. Их производительность сопоставима с AMD Ryzen 5 9600X, который стоит примерно на 80 долларов дешевле. В целом, в настоящее время Intel может привлечь покупателей только ценой.

Тем не менее, оба процессора являются хорошим выбором, когда речь идет о чистой производительности. Во время нашего тестирования не было ни одного приложения, с которым не справился бы даже маленький Intel Core Ultra 5 225F. Игры также являются детской забавой для этих процессоров. В качестве положительных моментов следует отметить их значительно меньшее энергопотребление и легкое охлаждение, что особенно интересно для компактных систем. В конечном итоге, Intel Core Ultra 5 235 обеспечивает лучший общий пакет, что явно отражается на его эффективности.

За

+ хорошая повседневная производительность
+ PCI Express 5.0
+ намного эффективнее, чем предыдущие поколения
+ интегрированный NPU
+ легко охлаждается
+ модульная сборка - дизайн чиплета

Против

- требуется новая материнская плата
- в настоящее время все еще слишком дорого

Intel Core Ultra 5 235 и Intel Core Ultra 5 225F принадлежат к последнему поколению процессоров Intel на базе архитектуры Meteor Lake. Оба чипа сочетают в себе мощные ядра P и эффективные ядра E с интегрированным ускорением искусственного интеллекта благодаря выделенному NPU (Neural Processing Unit). Как и Intel Core Ultra 5 225F, Intel Core Ultra 5 235 созданы для энергоэффективности, что отражается в их низком предельном энергопотреблении. Оба процессора относятся к классу 65-ваттных и могут работать при мощности до 121 Вт в течение коротких периодов времени. Благодаря этому экономные процессоры в первую очередь подходят для очень компактных ПК. Они также не требуют мощного охлаждения. Как мы уже знаем, суффикс F указывает на то, что это процессоры без iGPU.

Оба процессора основаны на современных технологиях производства и предлагают повышенную энергоэффективность, высокие многозадачные возможности и поддержку таких современных стандартов, как DDR5 и PCIe 5.0.

Intel Core Ultra 5 235
Процессор
Intel Core Ultra 5 235 14 x 3.4 - 5 GHz, 121 W PL2 / Short Burst, 65 W PL1 / Sustained, Arrow Lake-S
Графический адаптер
NVIDIA GeForce RTX 4090 - 24 Гбайт VRAM, 450 W TDP
ОЗУ
32 Гбайт 
, DDR5-6000 MT/s, CL30-38-38-96
Материнская плата
Intel Z890 (Arrow Lake-S PCH)
Хранение данных
Kingston KC3000 2048G SKC3000D2048G, 2048 Гбайт 
Операционная система
Microsoft Windows 11 Pro
Стоимость
279 евро
Внимание: Разные образцы одной и той же модели часто используют неодинаковые компоненты! (Матрица AUO вместо BOE, память Hynix вместо Samsung, накопитель SATA вместо PCIe, ...)


Intel Core Ultra 5 225F
Процессор
Intel Core Ultra 5 225F 10 x 3.3 - 4.9 GHz, 121 W PL2 / Short Burst, 65 W PL1 / Sustained, Arrow Lake-S
Графический адаптер
NVIDIA GeForce RTX 4090 - 24 Гбайт VRAM, 450 W TDP
ОЗУ
32 Гбайт 
, DDR5-6000 MT/s, CL30-38-38-96
Материнская плата
Intel Z890 (Arrow Lake-S PCH)
Хранение данных
Kingston KC3000 2048G SKC3000D2048G, 2048 Гбайт 
Операционная система
Microsoft Windows 11 Pro
Стоимость
229 евро
Внимание: Разные образцы одной и той же модели часто используют неодинаковые компоненты! (Матрица AUO вместо BOE, память Hynix вместо Samsung, накопитель SATA вместо PCIe, ...)


Мы использовали следующую систему для наших бенчмарков и тестов:

  • Streacom BC1 V2 Open Benchtable
  • Intel Core Ultra 5 235, Intel Core Ultra 5 225F
  • Asus TUF Gaming Z890-PLUS Wi-Fi, BIOS: 2001
  • Водяное охлаждение Custom Loop (помпа: Watercool WCP D5, радиатор: EK MO-RA3 420 Pro)
  • Palit GeForce RTX 4090 GameRock OC
  • EVGA SuperNOVA P+ 1600W
  • G.Skill Trident Z5 Neo DDR5-6000 2x 16 ГБ, EXPO (DDR5-6000 CL30-38-38-96)
  • Kingston KC3000 2 ТБ, M.2 2280 (ОС + синтетические бенчмарки)
  • Intel SSD DC P4618 - 6,4 ТБ (игры)
  • Microsoft Windows 11 Professional 64-bit (версия 24H2)

Сравнение процессоров Intel Arrow Lake S

Модель Ядра /
Потоки
Тактовая частота P-ядер / Turbo Тактовая частота E-ядер / Turbo TBMT 3.0 Кэш L2 Intel Smart Cache iGPU (4 ядра Xe) NPU PBP MTP Цена (MRSP)
Intel Core Ultra 9 285K 24 (8P + 16E) /24 3,7 ГГц / 5,5 ГГц 3,2 ГГц / 4,6 ГГц 5,6 ГГц 40 МБ 36 МБ 2,0 ГГц 13 TOPS 125 Вт 250 Вт $589
Intel Core Ultra 7 265K 20 (8P + 12E) /20 3,9 ГГц / 5,4 ГГц 3,3 ГГц / 4,6 ГГц 5,6 ГГц 36 МБ 30 МБ 2,0 ГГц 13 TOPS 125 ватт 250 ватт $394
Intel Core Ultra 7 265KF 20 (8P + 12E) /20 3,9 ГГц / 5,4 ГГц 3,3 ГГц / 4,6 ГГц 5,6 ГГц 36 МБ 30 МБ - 13 TOPS 125 ватт 250 ватт $379
Intel Core Ultra 5 245K 14 (6P + 8E) /14 3,9 ГГц / 5,4 ГГц 4,2 ГГц / 5,2 ГГц 5,2 ГГц 26 МБ 24 МБ 1,9 ГГц 13 TOPS 125 ватт 159 ватт $309
Intel Core Ultra 5 245KF 14 (6P + 8E) /14 3,9 ГГц / 5,4 ГГц 4,2 ГГц / 5,2 ГГц 5,2 ГГц 26 МБ 24 МБ - 13 TOPS 125 ватт 159 ватт $294
Intel Core Ultra 5 235 14 (6P + 8E) /14 3,4 ГГц / 5,0 ГГц 2,9 ГГц / 4,4 ГГц 5,0 ГГц 26 МБ 24 МБ 2,0 ГГц 13 TOPS 65 ватт 121 ватт $247
Intel Core Ultra 5 225F 14 (6P + 4E) /10 3,3 ГГц / 4,9 ГГц 2,7 ГГц / 4,4 ГГц 4,9 ГГц 22 МБ 20 МБ - 13 TOPS 65 ватт 121 ватт $221
Intel Core Ultra 5 235 и Intel Core Ultra 5 225F
Intel Core Ultra 5 235
Intel Core Ultra 5 225F
Комплектный кулер для Intel Core Ultra 5 235 и Intel Core Ultra 5 225F

Asus TUF Gaming Z890-PLUS Wi-Fi служит платформой

Asus TUF Gaming Z890-PLUS Wi-Fi

Как и в нашем обзоре Intel Core Ultra 5 245Kмы использовали материнскую плату Asus TUF Gaming Z890-PLUS Wi-Fi и для этого теста. На момент тестирования была установлена последняя версия BIOS. Визуально TUF Gaming Z890-PLUS Wi-Fi органично вписывается в серию TUF: преимущественно черный дизайн, подчеркнутый несколькими серебристыми элементами, но без RGB-подсветки на передней панели. Несколько светодиодов на задней панели обеспечивают несколько тонких световых эффектов. Материнская плата поддерживает оперативную память DDR5 с тактовой частотой до 9 066 МТ/с и максимальным объемом 256 ГБ при полной загрузке. Для обеспечения совместимости рекомендуется просмотреть список QVL. Что касается возможностей подключения, то плата предлагает множество портов USB 3, порт USB 4.0, 2,5G LAN и поддержку стандарта Wi-Fi 7. Большие радиаторы обеспечивают необходимое рассеивание тепла. Полезно: Верхний кулер SSD можно снять без использования каких-либо инструментов, а Q-образное крепление позволяет быстро снять видеокарту - только нижний радиатор прикручивается.

В настоящее время цена Asus TUF Gaming Z890-PLUS Wi-Fi составляет около 320 долларов (Amazon).

Условия тестирования

Все тесты производительности мы проводили с использованием энергетического профиля "Высокая производительность". Мы активировали настройки Intel по умолчанию в BIOS, так что Intel Core Ultra 5 235 и Intel Core Ultra 5 225F работали в рамках спецификаций, определенных производителем. Для охлаждения использовалась специальная система водяного охлаждения, которую мы уже использовали в предыдущих тестах производительности процессора в той же конфигурации.

Бенчмарки

Давайте посмотрим на производительность процессоров Intel Core Ultra 5 235 и Intel Core Ultra 5 225F: оба процессора обеспечивают хорошую производительность, но находятся на одном уровне с Intel Core i5-13600K. Благодаря 6 производительным и 8 эффективным ядрам Intel Core Ultra 5 235 имеет в общей сложности 14 физических ядер, в то время как Intel Core Ultra 5 225F имеет в общей сложности 10 ядер с 6 производительными и 4 эффективными ядрами. Гиперпоточность больше не используется в новых моделях Arrow Lake-S. Двум процессорам Ultra Core 5 не нужно бояться прямого сравнения с AMD или их внутренними конкурентами. Intel удается добиться впечатляющей производительности этих двух процессоров благодаря их более низкому энергопотреблению.

Intel Core Ultra 5 235

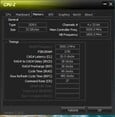
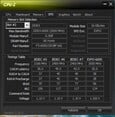
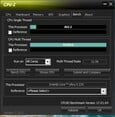
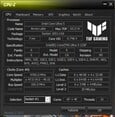
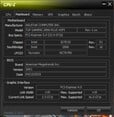
CPU-Z
CPU-Z
CPU-Z
CPU-Z
CPU-Z
CPU-Z

Intel Core Ultra 5 225F

CPU-Z
CPU-Z
CPU-Z
CPU-Z
CPU-Z
CPU-Z
Performance Rating - Percent
AMD Ryzen 9 9950X
Ryzen 9 9950X, 4300 МГц
82 pt
Intel Core i9-14900K
i9-14900K, 3200 МГц
81.8 pt
Intel Core i9-13900K
i9-13900K, 3000 МГц
79.5 pt
Intel Core Ultra 9 285K
Ultra 9 285K, 3200 МГц
79.3 pt
AMD Ryzen 9 7950X
R9 7950X, 4500 МГц
78.2 pt
AMD Ryzen 9 7950X3D
R9 7950X3D, 4200 МГц
78 pt
AMD Ryzen 9 7900X
R9 7900X, 4700 МГц
71.3 pt
AMD Ryzen 7 9800X3D
R7 9800X3D, 4700 МГц
69.8 pt
Intel Core i5-14600K
i5-14600K, 3500 МГц
68.3 pt
AMD Ryzen 7 9700X
Ryzen 7 9700X, 3800 МГц
67.8 pt
Intel Core i9-12900K
i9-12900K, 3200 МГц
67.7 pt
Intel Core Ultra 5 245K
Ultra 5 245K, 3600 МГц
67.6 pt
AMD Ryzen 9 5950X
R9 5950X, 3400 МГц
66.6 pt
Intel Core i5-13600K
i5-13600K, 3500 МГц
66.3 pt
Intel Core Ultra 5 235
Ultra 5 235, 3400 МГц
66 pt
AMD Ryzen 5 9600X
Ryzen 5 9600X, 3900 МГц
64.1 pt
AMD Ryzen 7 7800X3D
R7 7800X3D, 4200 МГц
63.6 pt
AMD Ryzen 7 7745HX
R7 7745HX, 3600 МГц
61.8 pt
AMD Ryzen 5 7600X
R5 7600X, 4700 МГц
61.4 pt
Intel Core Ultra 5 225F
Ultra 5 225F, 3300 МГц
59.6 pt
Intel Core i5-12600K
i5-12600K, 2800 МГц
59.3 pt
Intel Core i5-13400
i5-13400, 2500 МГц
56.7 pt
Intel Core i5-12400F
i5-12400F, 2500 МГц
52.1 pt
Cinebench R23
Single Core
Intel Core i9-14900K
i9-14900K, 3200 МГц
2351 Points +14%
Intel Core Ultra 9 285K
Ultra 9 285K, 3200 МГц
2342 Points +14%
Intel Core i9-13900K
i9-13900K, 3000 МГц
2267 Points +10%
AMD Ryzen 7 9700X
Ryzen 7 9700X, 3800 МГц
2211 Points +7%
AMD Ryzen 9 9950X
Ryzen 9 9950X, 4300 МГц
2202 Points +7%
AMD Ryzen 5 9600X
Ryzen 5 9600X, 3900 МГц
2180 Points +6%
Intel Core Ultra 5 245K
Ultra 5 245K, 3600 МГц
2132 Points +4%
AMD Ryzen 7 9800X3D
R7 9800X3D, 4700 МГц
2080 Points +1%
Intel Core i5-14600K
i5-14600K, 3500 МГц
2064 Points 0%
Intel Core Ultra 5 235
Ultra 5 235, 3400 МГц
2057 Points
AMD Ryzen 9 7950X3D
R9 7950X3D, 4200 МГц
2053 Points 0%
AMD Ryzen 9 7950X
R9 7950X, 4500 МГц
2045 Points -1%
AMD Ryzen 9 7900X
R9 7900X, 4700 МГц
2039 Points -1%
Intel Core i5-13600K
i5-13600K, 3500 МГц
2010 Points -2%
Intel Core i9-12900K
i9-12900K, 3200 МГц
1998 Points -3%
AMD Ryzen 5 7600X
R5 7600X, 4700 МГц
1967 Points -4%
Intel Core i5-12600K
i5-12600K, 2800 МГц
1907 Points -7%
Intel Core Ultra 5 225F
Ultra 5 225F, 3300 МГц
1893 Points -8%
AMD Ryzen 7 7745HX
R7 7745HX, 3600 МГц
1854 Points -10%
AMD Ryzen 7 7800X3D
R7 7800X3D, 4200 МГц
1820 Points -12%
Intel Core i5-13400
i5-13400, 2500 МГц
1786 Points -13%
Intel Core i5-12400F
i5-12400F, 2500 МГц
1680 Points -18%
AMD Ryzen 9 5950X
R9 5950X, 3400 МГц
1649 Points -20%
Multi Core
Intel Core Ultra 9 285K
Ultra 9 285K, 3200 МГц
42522 Points +96%
Intel Core i9-14900K
i9-14900K, 3200 МГц
41193 Points +90%
AMD Ryzen 9 9950X
Ryzen 9 9950X, 4300 МГц
40924 Points +89%
Intel Core i9-13900K
i9-13900K, 3000 МГц
40103 Points +85%
AMD Ryzen 9 7950X
R9 7950X, 4500 МГц
37792 Points +74%
AMD Ryzen 9 7950X3D
R9 7950X3D, 4200 МГц
36291 Points +67%
AMD Ryzen 9 7900X
R9 7900X, 4700 МГц
29480 Points +36%
AMD Ryzen 9 5950X
R9 5950X, 3400 МГц
27062 Points +25%
Intel Core i9-12900K
i9-12900K, 3200 МГц
27005 Points +25%
Intel Core Ultra 5 245K
Ultra 5 245K, 3600 МГц
25066 Points +16%
Intel Core i5-14600K
i5-14600K, 3500 МГц
24491 Points +13%
Intel Core i5-13600K
i5-13600K, 3500 МГц
24268 Points +12%
AMD Ryzen 7 9800X3D
R7 9800X3D, 4700 МГц
23230 Points +7%
Intel Core Ultra 5 235
Ultra 5 235, 3400 МГц
21677 Points
AMD Ryzen 7 9700X
Ryzen 7 9700X, 3800 МГц
20485 Points -5%
AMD Ryzen 7 7745HX
R7 7745HX, 3600 МГц
18845 Points -13%
AMD Ryzen 7 7800X3D
R7 7800X3D, 4200 МГц
18086 Points -17%
Intel Core i5-12600K
i5-12600K, 2800 МГц
17491 Points -19%
AMD Ryzen 5 9600X
Ryzen 5 9600X, 3900 МГц
17176 Points -21%
Intel Core Ultra 5 225F
Ultra 5 225F, 3300 МГц
16467 Points -24%
Intel Core i5-13400
i5-13400, 2500 МГц
15953 Points -26%
AMD Ryzen 5 7600X
R5 7600X, 4700 МГц
15322 Points -29%
Intel Core i5-12400F
i5-12400F, 2500 МГц
12380 Points -43%
Cinebench R20
CPU (Single Core)
Intel Core i9-14900K
i9-14900K, 3200 МГц
900 Points +13%
Intel Core Ultra 9 285K
Ultra 9 285K, 3200 МГц
899 Points +13%
AMD Ryzen 9 9950X
Ryzen 9 9950X, 4300 МГц
871 Points +10%
AMD Ryzen 7 9700X
Ryzen 7 9700X, 3800 МГц
870 Points +9%
AMD Ryzen 5 9600X
Ryzen 5 9600X, 3900 МГц
858 Points +8%
Intel Core i9-13900K
i9-13900K, 3000 МГц
828 Points +4%
Intel Core Ultra 5 245K
Ultra 5 245K, 3600 МГц
820 Points +3%
AMD Ryzen 7 9800X3D
R7 9800X3D, 4700 МГц
818 Points +3%
AMD Ryzen 9 7950X
R9 7950X, 4500 МГц
795 Points 0%
AMD Ryzen 9 7950X3D
R9 7950X3D, 4200 МГц
795 Points 0%
Intel Core Ultra 5 235
Ultra 5 235, 3400 МГц
795 Points
Intel Core i5-14600K
i5-14600K, 3500 МГц
790 Points -1%
AMD Ryzen 9 7900X
R9 7900X, 4700 МГц
786 Points -1%
Intel Core i5-13600K
i5-13600K, 3500 МГц
775 Points -3%
Intel Core i9-12900K
i9-12900K, 3200 МГц
766 Points -4%
AMD Ryzen 5 7600X
R5 7600X, 4700 МГц
761 Points -4%
Intel Core i5-12600K
i5-12600K, 2800 МГц
734 Points -8%
Intel Core Ultra 5 225F
Ultra 5 225F, 3300 МГц
726 Points -9%
AMD Ryzen 7 7745HX
R7 7745HX, 3600 МГц
719 Points -10%
AMD Ryzen 7 7800X3D
R7 7800X3D, 4200 МГц
709 Points -11%
Intel Core i5-13400
i5-13400, 2500 МГц
688 Points -13%
Intel Core i5-12400F
i5-12400F, 2500 МГц
653 Points -18%
AMD Ryzen 9 5950X
R9 5950X, 3400 МГц
641 Points -19%
CPU (Multi Core)
Intel Core Ultra 9 285K
Ultra 9 285K, 3200 МГц
16623 Points +95%
AMD Ryzen 9 9950X
Ryzen 9 9950X, 4300 МГц
15788 Points +85%
Intel Core i9-14900K
i9-14900K, 3200 МГц
15466 Points +82%
Intel Core i9-13900K
i9-13900K, 3000 МГц
15181 Points +78%
AMD Ryzen 9 7950X
R9 7950X, 4500 МГц
14786 Points +74%
AMD Ryzen 9 7950X3D
R9 7950X3D, 4200 МГц
14188 Points +67%
AMD Ryzen 9 7900X
R9 7900X, 4700 МГц
11563 Points +36%
AMD Ryzen 9 5950X
R9 5950X, 3400 МГц
10482 Points +23%
Intel Core i9-12900K
i9-12900K, 3200 МГц
10240 Points +20%
Intel Core Ultra 5 245K
Ultra 5 245K, 3600 МГц
9752 Points +14%
Intel Core i5-14600K
i5-14600K, 3500 МГц
9371 Points +10%
Intel Core i5-13600K
i5-13600K, 3500 МГц
9265 Points +9%
AMD Ryzen 7 9800X3D
R7 9800X3D, 4700 МГц
9057 Points +6%
Intel Core Ultra 5 235
Ultra 5 235, 3400 МГц
8518 Points
AMD Ryzen 7 9700X
Ryzen 7 9700X, 3800 МГц
7956 Points -7%
AMD Ryzen 7 7745HX
R7 7745HX, 3600 МГц
7399 Points -13%
AMD Ryzen 7 7800X3D
R7 7800X3D, 4200 МГц
7121 Points -16%
AMD Ryzen 5 9600X
Ryzen 5 9600X, 3900 МГц
6719 Points -21%
Intel Core i5-12600K
i5-12600K, 2800 МГц
6692 Points -21%
Intel Core Ultra 5 225F
Ultra 5 225F, 3300 МГц
6386 Points -25%
Intel Core i5-13400
i5-13400, 2500 МГц
6135 Points -28%
AMD Ryzen 5 7600X
R5 7600X, 4700 МГц
5985 Points -30%
Intel Core i5-12400F
i5-12400F, 2500 МГц
4740 Points -44%
Cinebench R15
CPU Single 64Bit
Intel Core Ultra 9 285K
Ultra 9 285K, 3200 МГц
355 Points +14%
AMD Ryzen 7 9700X
Ryzen 7 9700X, 3800 МГц
346 Points +11%
AMD Ryzen 9 9950X
Ryzen 9 9950X, 4300 МГц
344 Points +10%
AMD Ryzen 5 9600X
Ryzen 5 9600X, 3900 МГц
341 Points +9%
Intel Core i9-14900K
i9-14900K, 3200 МГц
332 Points +6%
AMD Ryzen 9 7950X
R9 7950X, 4500 МГц
328 Points +5%
AMD Ryzen 7 9800X3D
R7 9800X3D, 4700 МГц
328 Points +5%
Intel Core i9-13900K
i9-13900K, 3000 МГц
327 Points +5%
AMD Ryzen 9 7950X3D
R9 7950X3D, 4200 МГц
326 Points +4%
AMD Ryzen 9 7900X
R9 7900X, 4700 МГц
324 Points +4%
Intel Core Ultra 5 245K
Ultra 5 245K, 3600 МГц
322 Points +3%
AMD Ryzen 5 7600X
R5 7600X, 4700 МГц
315 Points +1%
Intel Core Ultra 5 235
Ultra 5 235, 3400 МГц
312 Points
Intel Core i5-14600K
i5-14600K, 3500 МГц
297 Points -5%
AMD Ryzen 7 7745HX
R7 7745HX, 3600 МГц
295 Points -5%
AMD Ryzen 7 7800X3D
R7 7800X3D, 4200 МГц
291 Points -7%
Intel Core i5-13600K
i5-13600K, 3500 МГц
289 Points -7%
Intel Core Ultra 5 225F
Ultra 5 225F, 3300 МГц
287 Points -8%
Intel Core i9-12900K
i9-12900K, 3200 МГц
286 Points -8%
Intel Core i5-12600K
i5-12600K, 2800 МГц
275 Points -12%
AMD Ryzen 9 5950X
R9 5950X, 3400 МГц
272 Points -13%
Intel Core i5-13400
i5-13400, 2500 МГц
257 Points -18%
Intel Core i5-12400F
i5-12400F, 2500 МГц
244 Points -22%
CPU Multi 64Bit
Intel Core Ultra 9 285K
Ultra 9 285K, 3200 МГц
6396 Points +76%
AMD Ryzen 9 9950X
Ryzen 9 9950X, 4300 МГц
6335 (6262.72min - 6335.13max) Points +74%
Intel Core i9-14900K
i9-14900K, 3200 МГц
6282 Points +72%
AMD Ryzen 9 7950X
R9 7950X, 4500 МГц
6209 Points +70%
Intel Core i9-13900K
i9-13900K, 3000 МГц
6191 Points +70%
AMD Ryzen 9 7950X3D
R9 7950X3D, 4200 МГц
5974 Points +64%
AMD Ryzen 9 7900X
R9 7900X, 4700 МГц
4856 Points +33%
AMD Ryzen 9 5950X
R9 5950X, 3400 МГц
4492 Points +23%
Intel Core i9-12900K
i9-12900K, 3200 МГц
4057 Points +11%
Intel Core Ultra 5 245K
Ultra 5 245K, 3600 МГц
3850 Points +6%
AMD Ryzen 7 9800X3D
R7 9800X3D, 4700 МГц
3647 Points 0%
Intel Core i5-13600K
i5-13600K, 3500 МГц
3643 Points 0%
Intel Core Ultra 5 235
Ultra 5 235, 3400 МГц
3642 Points
Intel Core i5-14600K
i5-14600K, 3500 МГц
3640 Points 0%
AMD Ryzen 7 9700X
Ryzen 7 9700X, 3800 МГц
3178 (3067.25min - 3120.37max) Points -13%
AMD Ryzen 7 7745HX
R7 7745HX, 3600 МГц
2994 Points -18%
AMD Ryzen 7 7800X3D
R7 7800X3D, 4200 МГц
2974 Points -18%
Intel Core Ultra 5 225F
Ultra 5 225F, 3300 МГц
2660 Points -27%
AMD Ryzen 5 9600X
Ryzen 5 9600X, 3900 МГц
2630 Points -28%
Intel Core i5-12600K
i5-12600K, 2800 МГц
2555 Points -30%
AMD Ryzen 5 7600X
R5 7600X, 4700 МГц
2507 Points -31%
Intel Core i5-13400
i5-13400, 2500 МГц
2358 Points -35%
Intel Core i5-12400F
i5-12400F, 2500 МГц
1759 Points -52%
Cinebench R11.5
CPU Single 64Bit
Intel Core Ultra 9 285K
Ultra 9 285K, 3200 МГц
4.17 Points +10%
AMD Ryzen 7 9700X
Ryzen 7 9700X, 3800 МГц
4.06 Points +7%
AMD Ryzen 9 9950X
Ryzen 9 9950X, 4300 МГц
4.03 Points +6%
Intel Core i9-14900K
i9-14900K, 3200 МГц
4.02 Points +6%
AMD Ryzen 5 9600X
Ryzen 5 9600X, 3900 МГц
4 Points +5%
Intel Core i9-13900K
i9-13900K, 3000 МГц
3.92 Points +3%
AMD Ryzen 9 7950X
R9 7950X, 4500 МГц
3.86 Points +2%
AMD Ryzen 9 7950X3D
R9 7950X3D, 4200 МГц
3.86 Points +2%
Intel Core Ultra 5 245K
Ultra 5 245K, 3600 МГц
3.85 Points +1%
AMD Ryzen 7 9800X3D
R7 9800X3D, 4700 МГц
3.84 Points +1%
AMD Ryzen 9 7900X
R9 7900X, 4700 МГц
3.83 Points +1%
Intel Core Ultra 5 235
Ultra 5 235, 3400 МГц
3.8 Points
AMD Ryzen 5 7600X
R5 7600X, 4700 МГц
3.72 Points -2%
Intel Core Ultra 5 225F
Ultra 5 225F, 3300 МГц
3.62 Points -5%
Intel Core i5-14600K
i5-14600K, 3500 МГц
3.58 Points -6%
AMD Ryzen 7 7745HX
R7 7745HX, 3600 МГц
3.5 Points -8%
Intel Core i9-12900K
i9-12900K, 3200 МГц
3.49 Points -8%
Intel Core i5-13600K
i5-13600K, 3500 МГц
3.48 Points -8%
AMD Ryzen 7 7800X3D
R7 7800X3D, 4200 МГц
3.43 Points -10%
Intel Core i5-12600K
i5-12600K, 2800 МГц
3.31 Points -13%
AMD Ryzen 9 5950X
R9 5950X, 3400 МГц
3.14 Points -17%
Intel Core i5-13400
i5-13400, 2500 МГц
3.1 Points -18%
Intel Core i5-12400F
i5-12400F, 2500 МГц
2.95 Points -22%
CPU Multi 64Bit
Intel Core Ultra 9 285K
Ultra 9 285K, 3200 МГц
77.29 Points +75%
AMD Ryzen 9 9950X
Ryzen 9 9950X, 4300 МГц
72.28 Points +63%
Intel Core i9-14900K
i9-14900K, 3200 МГц
72.24 Points +63%
Intel Core i9-13900K
i9-13900K, 3000 МГц
70.78 Points +60%
AMD Ryzen 9 7950X
R9 7950X, 4500 МГц
68.61 Points +55%
AMD Ryzen 9 7950X3D
R9 7950X3D, 4200 МГц
64.59 Points +46%
AMD Ryzen 9 7900X
R9 7900X, 4700 МГц
54.51 Points +23%
AMD Ryzen 9 5950X
R9 5950X, 3400 МГц
49.6 Points +12%
Intel Core Ultra 5 245K
Ultra 5 245K, 3600 МГц
47.55 Points +7%
Intel Core i9-12900K
i9-12900K, 3200 МГц
47.06 Points +6%
Intel Core Ultra 5 235
Ultra 5 235, 3400 МГц
44.28 Points
Intel Core i5-13600K
i5-13600K, 3500 МГц
42.38 Points -4%
AMD Ryzen 7 9800X3D
R7 9800X3D, 4700 МГц
41.67 Points -6%
Intel Core i5-14600K
i5-14600K, 3500 МГц
40.96 Points -7%
AMD Ryzen 7 9700X
Ryzen 7 9700X, 3800 МГц
36.24 Points -18%
AMD Ryzen 7 7745HX
R7 7745HX, 3600 МГц
35.06 Points -21%
AMD Ryzen 7 7800X3D
R7 7800X3D, 4200 МГц
33.48 Points -24%
Intel Core Ultra 5 225F
Ultra 5 225F, 3300 МГц
32.71 Points -26%
AMD Ryzen 5 9600X
Ryzen 5 9600X, 3900 МГц
30.86 Points -30%
Intel Core i5-12600K
i5-12600K, 2800 МГц
30.01 Points -32%
AMD Ryzen 5 7600X
R5 7600X, 4700 МГц
28.41 Points -36%
Intel Core i5-13400
i5-13400, 2500 МГц
27.36 Points -38%
Intel Core i5-12400F
i5-12400F, 2500 МГц
20.39 Points -54%
Blender - v2.79 BMW27 CPU
Intel Core i5-12400F
i5-12400F, 2500 МГц
269 Seconds * -60%
Intel Core Ultra 5 225F
Ultra 5 225F, 3300 МГц
218 Seconds * -30%
Intel Core i5-13400
i5-13400, 2500 МГц
206 Seconds * -23%
AMD Ryzen 5 7600X
R5 7600X, 4700 МГц
203 Seconds * -21%
Intel Core i5-12600K
i5-12600K, 2800 МГц
189.5 Seconds * -13%
AMD Ryzen 5 9600X
Ryzen 5 9600X, 3900 МГц
184 Seconds * -10%
AMD Ryzen 7 7800X3D
R7 7800X3D, 4200 МГц
169 Seconds * -1%
AMD Ryzen 7 7745HX
R7 7745HX, 3600 МГц
169 Seconds * -1%
Intel Core Ultra 5 235
Ultra 5 235, 3400 МГц
168 Seconds *
AMD Ryzen 7 9700X
Ryzen 7 9700X, 3800 МГц
154 Seconds * +8%
AMD Ryzen 7 9800X3D
R7 9800X3D, 4700 МГц
137 Seconds * +18%
Intel Core Ultra 5 245K
Ultra 5 245K, 3600 МГц
136 Seconds * +19%
Intel Core i5-13600K
i5-13600K, 3500 МГц
135 Seconds * +20%
Intel Core i5-14600K
i5-14600K, 3500 МГц
134 Seconds * +20%
Intel Core i9-12900K
i9-12900K, 3200 МГц
121.1 Seconds * +28%
AMD Ryzen 9 5950X
R9 5950X, 3400 МГц
112.8 Seconds * +33%
AMD Ryzen 9 7900X
R9 7900X, 4700 МГц
106 Seconds * +37%
AMD Ryzen 9 7950X3D
R9 7950X3D, 4200 МГц
86 Seconds * +49%
AMD Ryzen 9 7950X
R9 7950X, 4500 МГц
85 Seconds * +49%
Intel Core i9-13900K
i9-13900K, 3000 МГц
80 Seconds * +52%
Intel Core i9-14900K
i9-14900K, 3200 МГц
80 Seconds * +52%
Intel Core Ultra 9 285K
Ultra 9 285K, 3200 МГц
79 Seconds * +53%
AMD Ryzen 9 9950X
Ryzen 9 9950X, 4300 МГц
77 Seconds * +54%
wPrime 2.10
32m
Intel Core i9-12900K
i9-12900K, 3200 МГц
4.924 s * -73%
Intel Core i5-12600K
i5-12600K, 2800 МГц
4.725 s * -66%
Intel Core i5-12400F
i5-12400F, 2500 МГц
4.078 s * -43%
Intel Core Ultra 5 225F
Ultra 5 225F, 3300 МГц
3.581 s * -26%
Intel Core i5-13400
i5-13400, 2500 МГц
3.474 s * -22%
Intel Core Ultra 5 245K
Ultra 5 245K, 3600 МГц
2.976 s * -4%
Intel Core Ultra 5 235
Ultra 5 235, 3400 МГц
2.849 s *
AMD Ryzen 5 7600X
R5 7600X, 4700 МГц
2.78 s * +2%
AMD Ryzen 5 9600X
Ryzen 5 9600X, 3900 МГц
2.617 s * +8%
AMD Ryzen 9 5950X
R9 5950X, 3400 МГц
2.538 s * +11%
Intel Core i5-13600K
i5-13600K, 3500 МГц
2.527 s * +11%
AMD Ryzen 7 7800X3D
R7 7800X3D, 4200 МГц
2.435 s * +15%
Intel Core i5-14600K
i5-14600K, 3500 МГц
2.39 s * +16%
AMD Ryzen 7 9700X
Ryzen 7 9700X, 3800 МГц
2.36 s * +17%
AMD Ryzen 7 7745HX
R7 7745HX, 3600 МГц
2.275 s * +20%
AMD Ryzen 7 9800X3D
R7 9800X3D, 4700 МГц
2.254 s * +21%
Intel Core Ultra 9 285K
Ultra 9 285K, 3200 МГц
2.197 s * +23%
AMD Ryzen 9 9950X
Ryzen 9 9950X, 4300 МГц
2.077 s * +27%
Intel Core i9-14900K
i9-14900K, 3200 МГц
2.07 s * +27%
AMD Ryzen 9 7950X3D
R9 7950X3D, 4200 МГц
2.007 s * +30%
Intel Core i9-13900K
i9-13900K, 3000 МГц
1.818 s * +36%
AMD Ryzen 9 7900X
R9 7900X, 4700 МГц
1.781 s * +37%
AMD Ryzen 9 7950X
R9 7950X, 4500 МГц
1.669 s * +41%
1024m
Intel Core i5-13400
i5-13400, 2500 МГц
452.309 s * -482%
Intel Core i5-12600K
i5-12600K, 2800 МГц
202.7 s * -161%
Intel Core i9-12900K
i9-12900K, 3200 МГц
190.6 s * -145%
Intel Core i5-13600K
i5-13600K, 3500 МГц
177.592 s * -129%
Intel Core i5-14600K
i5-14600K, 3500 МГц
158.77 s * -104%
Intel Core i5-12400F
i5-12400F, 2500 МГц
112.849 s * -45%
Intel Core Ultra 5 225F
Ultra 5 225F, 3300 МГц
107.715 s * -39%
Intel Core i9-13900K
i9-13900K, 3000 МГц
79.738 s * -3%
Intel Core Ultra 5 245K
Ultra 5 245K, 3600 МГц
77.721 s * -0%
Intel Core Ultra 5 235
Ultra 5 235, 3400 МГц
77.669 s *
AMD Ryzen 5 7600X
R5 7600X, 4700 МГц
74.491 s * +4%
Intel Core i9-14900K
i9-14900K, 3200 МГц
74.47 s * +4%
AMD Ryzen 5 9600X
Ryzen 5 9600X, 3900 МГц
72.546 s * +7%
AMD Ryzen 9 5950X
R9 5950X, 3400 МГц
64.9 s * +16%
AMD Ryzen 7 7800X3D
R7 7800X3D, 4200 МГц
62.733 s * +19%
AMD Ryzen 7 7745HX
R7 7745HX, 3600 МГц
60.675 s * +22%
AMD Ryzen 7 9700X
Ryzen 7 9700X, 3800 МГц
59.56 s * +23%
AMD Ryzen 7 9800X3D
R7 9800X3D, 4700 МГц
54.284 s * +30%
Intel Core Ultra 9 285K
Ultra 9 285K, 3200 МГц
48.806 s * +37%
AMD Ryzen 9 7900X
R9 7900X, 4700 МГц
39.954 s * +49%
AMD Ryzen 9 7950X3D
R9 7950X3D, 4200 МГц
33.879 s * +56%
AMD Ryzen 9 7950X
R9 7950X, 4500 МГц
30.811 s * +60%
AMD Ryzen 9 9950X
Ryzen 9 9950X, 4300 МГц
29.318 s * +62%
X264 HD Benchmark 4.0
Pass 1
Intel Core i9-14900K
i9-14900K, 3200 МГц
433.5 (424min - 434max) fps +15%
Intel Core Ultra 9 285K
Ultra 9 285K, 3200 МГц
422 (421min - 423max) fps +12%
Intel Core i9-13900K
i9-13900K, 3000 МГц
412 (410min - 417max) fps +9%
Intel Core i5-14600K
i5-14600K, 3500 МГц
411 (410min - 412max) fps +9%
AMD Ryzen 9 7950X3D
R9 7950X3D, 4200 МГц
392.5 (391min - 397max) fps +4%
AMD Ryzen 9 9950X
Ryzen 9 9950X, 4300 МГц
392 (392min - 393max) fps +4%
Intel Core Ultra 5 245K
Ultra 5 245K, 3600 МГц
388.5 (387min - 390max) fps +3%
Intel Core i5-13600K
i5-13600K, 3500 МГц
388 (386min - 388max) fps +3%
AMD Ryzen 9 7950X
R9 7950X, 4500 МГц
379.5 (378min - 385max) fps 0%
Intel Core Ultra 5 235
Ultra 5 235, 3400 МГц
378 (376min - 378max) fps
AMD Ryzen 9 7900X
R9 7900X, 4700 МГц
376 (369min - 378max) fps -1%
AMD Ryzen 7 9700X
Ryzen 7 9700X, 3800 МГц
376 (374min - 376max) fps -1%
AMD Ryzen 7 9800X3D
R7 9800X3D, 4700 МГц
375.5 (375min - 377max) fps -1%
Intel Core i9-12900K
i9-12900K, 3200 МГц
368.5 (366min - 369max) fps -3%
AMD Ryzen 5 7600X
R5 7600X, 4700 МГц
367 (363min - 371max) fps -3%
Intel Core Ultra 5 225F
Ultra 5 225F, 3300 МГц
364.5 (362min - 365max) fps -4%
AMD Ryzen 5 9600X
Ryzen 5 9600X, 3900 МГц
364 (361min - 367max) fps -4%
AMD Ryzen 7 7745HX
R7 7745HX, 3600 МГц
358.5 (356min - 366max) fps -5%
AMD Ryzen 7 7800X3D
R7 7800X3D, 4200 МГц
344 (339min - 346max) fps -9%
AMD Ryzen 9 5950X
R9 5950X, 3400 МГц
338.5 (337min - 340max) fps -10%
Intel Core i5-12600K
i5-12600K, 2800 МГц
333.5 (332min - 336max) fps -12%
Intel Core i5-13400
i5-13400, 2500 МГц
311 (310min - 312max) fps -18%
Intel Core i5-12400F
i5-12400F, 2500 МГц
252.5 (249min - 256max) fps -33%
Pass 2
Intel Core Ultra 9 285K
Ultra 9 285K, 3200 МГц
296.5 (296min - 298max) fps +48%
Intel Core i9-14900K
i9-14900K, 3200 МГц
286.5 (285min - 287max) fps +43%
AMD Ryzen 9 9950X
Ryzen 9 9950X, 4300 МГц
271 (271min - 272max) fps +35%
Intel Core i9-13900K
i9-13900K, 3000 МГц
267 (266min - 271max) fps +33%
AMD Ryzen 9 7950X
R9 7950X, 4500 МГц
266.5 (263min - 267max) fps +33%
AMD Ryzen 9 7950X3D
R9 7950X3D, 4200 МГц
265.5 (263min - 266max) fps +32%
AMD Ryzen 9 7900X
R9 7900X, 4700 МГц
241 (240min - 242max) fps +20%
AMD Ryzen 9 5950X
R9 5950X, 3400 МГц
221 (220min - 221max) fps +10%
Intel Core Ultra 5 245K
Ultra 5 245K, 3600 МГц
216.5 (215min - 217max) fps +8%
Intel Core i5-14600K
i5-14600K, 3500 МГц
209 (208min - 209max) fps +4%
Intel Core i9-12900K
i9-12900K, 3200 МГц
206 (206min - 206max) fps +3%
AMD Ryzen 7 9800X3D
R7 9800X3D, 4700 МГц
203 (202min - 203max) fps +1%
Intel Core Ultra 5 235
Ultra 5 235, 3400 МГц
200.85 (169.7min - 209max) fps
Intel Core i5-13600K
i5-13600K, 3500 МГц
199 (198.5min - 199.4max) fps -1%
AMD Ryzen 7 9700X
Ryzen 7 9700X, 3800 МГц
176.05 (175.9min - 176.1max) fps -12%
AMD Ryzen 7 7745HX
R7 7745HX, 3600 МГц
173.25 (172.2min - 174.1max) fps -14%
AMD Ryzen 7 7800X3D
R7 7800X3D, 4200 МГц
169.25 (169.1min - 170max) fps -16%
AMD Ryzen 5 9600X
Ryzen 5 9600X, 3900 МГц
154 (153.4min - 154.3max) fps -23%
Intel Core Ultra 5 225F
Ultra 5 225F, 3300 МГц
148.9 (135.9min - 157.2max) fps -26%
Intel Core i5-12600K
i5-12600K, 2800 МГц
148 (147min - 148max) fps -26%
AMD Ryzen 5 7600X
R5 7600X, 4700 МГц
147.8 (147.7min - 147.9max) fps -26%
Intel Core i5-13400
i5-13400, 2500 МГц
135.8 (135.7min - 135.9max) fps -32%
Intel Core i5-12400F
i5-12400F, 2500 МГц
101.35 (101.1min - 101.5max) fps -50%
WinRAR - Result
AMD Ryzen 9 7900X
R9 7900X, 4700 МГц
17225 KB/s +74%
AMD Ryzen 7 7800X3D
R7 7800X3D, 4200 МГц
16585 KB/s +68%
AMD Ryzen 9 7950X
R9 7950X, 4500 МГц
16351 KB/s +65%
AMD Ryzen 5 7600X
R5 7600X, 4700 МГц
16178 KB/s +64%
Intel Core i9-14900K
i9-14900K, 3200 МГц
16108 KB/s +63%
AMD Ryzen 9 7950X3D
R9 7950X3D, 4200 МГц
15779 KB/s +60%
AMD Ryzen 7 9800X3D
R7 9800X3D, 4700 МГц
15574 KB/s +58%
Intel Core i9-13900K
i9-13900K, 3000 МГц
14836 KB/s +50%
AMD Ryzen 5 9600X
Ryzen 5 9600X, 3900 МГц
14819 KB/s +50%
AMD Ryzen 7 7745HX
R7 7745HX, 3600 МГц
14476 KB/s +46%
AMD Ryzen 9 9950X
Ryzen 9 9950X, 4300 МГц
13778 KB/s +39%
AMD Ryzen 7 9700X
Ryzen 7 9700X, 3800 МГц
13549 KB/s +37%
Intel Core Ultra 9 285K
Ultra 9 285K, 3200 МГц
12599 KB/s +27%
AMD Ryzen 9 5950X
R9 5950X, 3400 МГц
12503 KB/s +27%
Intel Core i5-14600K
i5-14600K, 3500 МГц
11491 KB/s +16%
Intel Core i5-13600K
i5-13600K, 3500 МГц
10937 KB/s +11%
Intel Core i9-12900K
i9-12900K, 3200 МГц
10792 KB/s +9%
Intel Core Ultra 5 245K
Ultra 5 245K, 3600 МГц
10521 KB/s +6%
Intel Core Ultra 5 235
Ultra 5 235, 3400 МГц
9883 KB/s
Intel Core Ultra 5 225F
Ultra 5 225F, 3300 МГц
8846 KB/s -10%
Intel Core i5-13400
i5-13400, 2500 МГц
7979 KB/s -19%
Intel Core i5-12400F
i5-12400F, 2500 МГц
7816 KB/s -21%
Intel Core i5-12600K
i5-12600K, 2800 МГц
6239 KB/s -37%
TrueCrypt
AES Mean 100MB
AMD Ryzen 9 9950X
Ryzen 9 9950X, 4300 МГц
32.4 GB/s +104%
AMD Ryzen 9 7950X
R9 7950X, 4500 МГц
30.7 GB/s +93%
Intel Core i9-13900K
i9-13900K, 3000 МГц
27 GB/s +70%
AMD Ryzen 9 5950X
R9 5950X, 3400 МГц
26.9 GB/s +69%
AMD Ryzen 9 7950X3D
R9 7950X3D, 4200 МГц
26.9 GB/s +69%
Intel Core i9-14900K
i9-14900K, 3200 МГц
26.7 GB/s +68%
Intel Core i5-14600K
i5-14600K, 3500 МГц
19.5 GB/s +23%
Intel Core i5-13600K
i5-13600K, 3500 МГц
18.8 GB/s +18%
Intel Core i9-12900K
i9-12900K, 3200 МГц
18.5 GB/s +16%
AMD Ryzen 7 9800X3D
R7 9800X3D, 4700 МГц
17.8 GB/s +12%
AMD Ryzen 7 7745HX
R7 7745HX, 3600 МГц
16.4 GB/s +3%
Intel Core Ultra 5 245K
Ultra 5 245K, 3600 МГц
16.4 GB/s +3%
AMD Ryzen 7 9700X
Ryzen 7 9700X, 3800 МГц
16.1 GB/s +1%
Intel Core Ultra 9 285K
Ultra 9 285K, 3200 МГц
16 GB/s +1%
Intel Core Ultra 5 235
Ultra 5 235, 3400 МГц
15.9 GB/s
AMD Ryzen 7 7800X3D
R7 7800X3D, 4200 МГц
15.3 GB/s -4%
AMD Ryzen 9 7900X
R9 7900X, 4700 МГц
14.8 GB/s -7%
AMD Ryzen 5 9600X
Ryzen 5 9600X, 3900 МГц
13.4 GB/s -16%
AMD Ryzen 5 7600X
R5 7600X, 4700 МГц
13.2 GB/s -17%
Intel Core i5-12600K
i5-12600K, 2800 МГц
12.8 GB/s -19%
Intel Core i5-13400
i5-13400, 2500 МГц
11.8 GB/s -26%
Intel Core Ultra 5 225F
Ultra 5 225F, 3300 МГц
11.6 GB/s -27%
Intel Core i5-12400F
i5-12400F, 2500 МГц
9.3 GB/s -42%
Twofish Mean 100MB
Intel Core i9-14900K
i9-14900K, 3200 МГц
5.8 GB/s +107%
AMD Ryzen 9 9950X
Ryzen 9 9950X, 4300 МГц
5.6 GB/s +100%
Intel Core i9-13900K
i9-13900K, 3000 МГц
5.4 GB/s +93%
Intel Core Ultra 9 285K
Ultra 9 285K, 3200 МГц
4.9 GB/s +75%
AMD Ryzen 9 7950X
R9 7950X, 4500 МГц
4.5 GB/s +61%
AMD Ryzen 9 7950X3D
R9 7950X3D, 4200 МГц
4.2 GB/s +50%
AMD Ryzen 9 5950X
R9 5950X, 3400 МГц
3.7 GB/s +32%
Intel Core i9-12900K
i9-12900K, 3200 МГц
3.7 GB/s +32%
Intel Core i5-14600K
i5-14600K, 3500 МГц
3.4 GB/s +21%
Intel Core i5-13600K
i5-13600K, 3500 МГц
3.1 GB/s +11%
Intel Core Ultra 5 245K
Ultra 5 245K, 3600 МГц
3 GB/s +7%
AMD Ryzen 7 9800X3D
R7 9800X3D, 4700 МГц
2.9 GB/s +4%
AMD Ryzen 9 7900X
R9 7900X, 4700 МГц
2.8 GB/s 0%
AMD Ryzen 7 9700X
Ryzen 7 9700X, 3800 МГц
2.8 GB/s 0%
Intel Core Ultra 5 235
Ultra 5 235, 3400 МГц
2.8 GB/s
Intel Core i5-12600K
i5-12600K, 2800 МГц
2.2 GB/s -21%
AMD Ryzen 7 7745HX
R7 7745HX, 3600 МГц
2.2 GB/s -21%
AMD Ryzen 5 9600X
Ryzen 5 9600X, 3900 МГц
2.2 GB/s -21%
AMD Ryzen 7 7800X3D
R7 7800X3D, 4200 МГц
2.1 GB/s -25%
Intel Core Ultra 5 225F
Ultra 5 225F, 3300 МГц
2.1 GB/s -25%
Intel Core i5-13400
i5-13400, 2500 МГц
2 GB/s -29%
AMD Ryzen 5 7600X
R5 7600X, 4700 МГц
1.8 GB/s -36%
Intel Core i5-12400F
i5-12400F, 2500 МГц
1.4 GB/s -50%
Serpent Mean 100MB
AMD Ryzen 9 9950X
Ryzen 9 9950X, 4300 МГц
3.4 GB/s +143%
Intel Core i9-13900K
i9-13900K, 3000 МГц
3 GB/s +114%
AMD Ryzen 9 7950X
R9 7950X, 4500 МГц
2.8 GB/s +100%
AMD Ryzen 9 7950X3D
R9 7950X3D, 4200 МГц
2.8 GB/s +100%
Intel Core i9-14900K
i9-14900K, 3200 МГц
2.8 GB/s +100%
AMD Ryzen 9 5950X
R9 5950X, 3400 МГц
2.4 GB/s +71%
Intel Core Ultra 9 285K
Ultra 9 285K, 3200 МГц
2.3 GB/s +64%
Intel Core i9-12900K
i9-12900K, 3200 МГц
1.9 GB/s +36%
Intel Core i5-14600K
i5-14600K, 3500 МГц
1.8 GB/s +29%
Intel Core i5-13600K
i5-13600K, 3500 МГц
1.7 GB/s +21%
AMD Ryzen 7 9700X
Ryzen 7 9700X, 3800 МГц
1.7 GB/s +21%
AMD Ryzen 7 9800X3D
R7 9800X3D, 4700 МГц
1.7 GB/s +21%
AMD Ryzen 9 7900X
R9 7900X, 4700 МГц
1.5 GB/s +7%
Intel Core Ultra 5 245K
Ultra 5 245K, 3600 МГц
1.5 GB/s +7%
AMD Ryzen 7 7745HX
R7 7745HX, 3600 МГц
1.4 GB/s 0%
AMD Ryzen 5 9600X
Ryzen 5 9600X, 3900 МГц
1.4 GB/s 0%
Intel Core Ultra 5 235
Ultra 5 235, 3400 МГц
1.4 GB/s
Intel Core i5-12600K
i5-12600K, 2800 МГц
1.3 GB/s -7%
AMD Ryzen 7 7800X3D
R7 7800X3D, 4200 МГц
1.3 GB/s -7%
Intel Core i5-13400
i5-13400, 2500 МГц
1.2 GB/s -14%
AMD Ryzen 5 7600X
R5 7600X, 4700 МГц
1.1 GB/s -21%
Intel Core Ultra 5 225F
Ultra 5 225F, 3300 МГц
1 GB/s -29%
Intel Core i5-12400F
i5-12400F, 2500 МГц
0.884 GB/s -37%
Geekbench 5.5
Multi-Core
Intel Core i9-14900K
i9-14900K, 3200 МГц
25867 Points +46%
Intel Core Ultra 9 285K
Ultra 9 285K, 3200 МГц
25740 Points +45%
AMD Ryzen 9 7950X
R9 7950X, 4500 МГц
24625 Points +39%
AMD Ryzen 9 7950X3D
R9 7950X3D, 4200 МГц
24343 Points +38%
Intel Core i9-13900K
i9-13900K, 3000 МГц
24157 Points +37%
AMD Ryzen 9 9950X
Ryzen 9 9950X, 4300 МГц
23982 Points +36%
AMD Ryzen 9 7900X
R9 7900X, 4700 МГц
19987 Points +13%
Intel Core i9-12900K
i9-12900K, 3200 МГц
17854 Points +1%
Intel Core Ultra 5 245K
Ultra 5 245K, 3600 МГц
17760 Points 0%
Intel Core Ultra 5 235
Ultra 5 235, 3400 МГц
17696 Points
Intel Core i5-14600K
i5-14600K, 3500 МГц
17516 Points -1%
AMD Ryzen 9 5950X
R9 5950X, 3400 МГц
16891 Points -5%
Intel Core i5-13600K
i5-13600K, 3500 МГц
16651 Points -6%
AMD Ryzen 7 9800X3D
R7 9800X3D, 4700 МГц
16637 Points -6%
AMD Ryzen 7 9700X
Ryzen 7 9700X, 3800 МГц
14613 Points -17%
AMD Ryzen 7 7800X3D
R7 7800X3D, 4200 МГц
14252 Points -19%
Intel Core Ultra 5 225F
Ultra 5 225F, 3300 МГц
13898 Points -21%
AMD Ryzen 7 7745HX
R7 7745HX, 3600 МГц
13462 Points -24%
Intel Core i5-12600K
i5-12600K, 2800 МГц
12797 Points -28%
AMD Ryzen 5 9600X
Ryzen 5 9600X, 3900 МГц
12751 Points -28%
Intel Core i5-13400
i5-13400, 2500 МГц
12107 Points -32%
AMD Ryzen 5 7600X
R5 7600X, 4700 МГц
11917 Points -33%
Intel Core i5-12400F
i5-12400F, 2500 МГц
9517 Points -46%
Single-Core
AMD Ryzen 9 9950X
Ryzen 9 9950X, 4300 МГц
2559 Points +18%
AMD Ryzen 5 9600X
Ryzen 5 9600X, 3900 МГц
2523 Points +16%
AMD Ryzen 7 9700X
Ryzen 7 9700X, 3800 МГц
2507 Points +15%
AMD Ryzen 7 9800X3D
R7 9800X3D, 4700 МГц
2450 Points +13%
Intel Core Ultra 9 285K
Ultra 9 285K, 3200 МГц
2366 Points +9%
AMD Ryzen 9 7950X
R9 7950X, 4500 МГц
2311 Points +6%
AMD Ryzen 9 7950X3D
R9 7950X3D, 4200 МГц
2311 Points +6%
Intel Core i9-13900K
i9-13900K, 3000 МГц
2290 Points +5%
AMD Ryzen 9 7900X
R9 7900X, 4700 МГц
2274 Points +5%
Intel Core i9-14900K
i9-14900K, 3200 МГц
2243 Points +3%
Intel Core Ultra 5 245K
Ultra 5 245K, 3600 МГц
2224 Points +2%
AMD Ryzen 5 7600X
R5 7600X, 4700 МГц
2205 Points +2%
Intel Core Ultra 5 235
Ultra 5 235, 3400 МГц
2171 Points
Intel Core Ultra 5 225F
Ultra 5 225F, 3300 МГц
2082 Points -4%
AMD Ryzen 7 7745HX
R7 7745HX, 3600 МГц
2067 Points -5%
Intel Core i9-12900K
i9-12900K, 3200 МГц
2042 Points -6%
AMD Ryzen 7 7800X3D
R7 7800X3D, 4200 МГц
2027 Points -7%
Intel Core i5-14600K
i5-14600K, 3500 МГц
2017 Points -7%
Intel Core i5-13600K
i5-13600K, 3500 МГц
1967 Points -9%
Intel Core i5-12600K
i5-12600K, 2800 МГц
1904 Points -12%
Intel Core i5-13400
i5-13400, 2500 МГц
1795 Points -17%
Intel Core i5-12400F
i5-12400F, 2500 МГц
1742 Points -20%
AMD Ryzen 9 5950X
R9 5950X, 3400 МГц
1682 Points -23%
Geekbench 5.0
5.0 Multi-Core
Intel Core Ultra 9 285K
Ultra 9 285K, 3200 МГц
25793 Points +46%
Intel Core i9-14900K
i9-14900K, 3200 МГц
25459 Points +44%
AMD Ryzen 9 7950X
R9 7950X, 4500 МГц
24479 Points +39%
Intel Core i9-13900K
i9-13900K, 3000 МГц
24021 Points +36%
AMD Ryzen 9 7950X3D
R9 7950X3D, 4200 МГц
23720 Points +34%
AMD Ryzen 9 9950X
Ryzen 9 9950X, 4300 МГц
23387 Points +32%
AMD Ryzen 9 7900X
R9 7900X, 4700 МГц
19975 Points +13%
Intel Core i9-12900K
i9-12900K, 3200 МГц
17959 Points +2%
Intel Core Ultra 5 245K
Ultra 5 245K, 3600 МГц
17938 Points +2%
Intel Core Ultra 5 235
Ultra 5 235, 3400 МГц
17664 Points
Intel Core i5-14600K
i5-14600K, 3500 МГц
17374 Points -2%
AMD Ryzen 7 9800X3D
R7 9800X3D, 4700 МГц
16773 Points -5%
Intel Core i5-13600K
i5-13600K, 3500 МГц
16635 Points -6%
AMD Ryzen 9 5950X
R9 5950X, 3400 МГц
16570 Points -6%
AMD Ryzen 7 9700X
Ryzen 7 9700X, 3800 МГц
14698 Points -17%
Intel Core Ultra 5 225F
Ultra 5 225F, 3300 МГц
13908 Points -21%
AMD Ryzen 7 7800X3D
R7 7800X3D, 4200 МГц
13888 Points -21%
AMD Ryzen 7 7745HX
R7 7745HX, 3600 МГц
13342 Points -24%
Intel Core i5-12600K
i5-12600K, 2800 МГц
12746 Points -28%
AMD Ryzen 5 9600X
Ryzen 5 9600X, 3900 МГц
12556 Points -29%
AMD Ryzen 5 7600X
R5 7600X, 4700 МГц
11880 Points -33%
Intel Core i5-13400
i5-13400, 2500 МГц
11801 Points -33%
Intel Core i5-12400F
i5-12400F, 2500 МГц
9368 Points -47%
5.0 Single-Core
AMD Ryzen 9 9950X
Ryzen 9 9950X, 4300 МГц
2445 Points +15%
AMD Ryzen 7 9700X
Ryzen 7 9700X, 3800 МГц
2402 Points +13%
AMD Ryzen 5 9600X
Ryzen 5 9600X, 3900 МГц
2397 Points +13%
Intel Core Ultra 9 285K
Ultra 9 285K, 3200 МГц
2332 Points +10%
AMD Ryzen 7 9800X3D
R7 9800X3D, 4700 МГц
2316 Points +9%
Intel Core i9-14900K
i9-14900K, 3200 МГц
2272 Points +7%
AMD Ryzen 9 7950X
R9 7950X, 4500 МГц
2222 Points +4%
Intel Core i9-13900K
i9-13900K, 3000 МГц
2214 Points +4%
AMD Ryzen 9 7900X
R9 7900X, 4700 МГц
2194 Points +3%
AMD Ryzen 9 7950X3D
R9 7950X3D, 4200 МГц
2183 Points +3%
Intel Core Ultra 5 245K
Ultra 5 245K, 3600 МГц
2180 Points +2%
Intel Core Ultra 5 235
Ultra 5 235, 3400 МГц
2127 Points
AMD Ryzen 5 7600X
R5 7600X, 4700 МГц
2126 Points 0%
Intel Core Ultra 5 225F
Ultra 5 225F, 3300 МГц
2035 Points -4%
Intel Core i5-14600K
i5-14600K, 3500 МГц
2004 Points -6%
AMD Ryzen 7 7745HX
R7 7745HX, 3600 МГц
1989 Points -6%
Intel Core i9-12900K
i9-12900K, 3200 МГц
1968 Points -7%
AMD Ryzen 7 7800X3D
R7 7800X3D, 4200 МГц
1938 Points -9%
Intel Core i5-13600K
i5-13600K, 3500 МГц
1931 Points -9%
Intel Core i5-12600K
i5-12600K, 2800 МГц
1821 Points -14%
Intel Core i5-13400
i5-13400, 2500 МГц
1706 Points -20%
AMD Ryzen 9 5950X
R9 5950X, 3400 МГц
1683 Points -21%
Intel Core i5-12400F
i5-12400F, 2500 МГц
1673 Points -21%
Geekbench 4.4
64 Bit Single-Core Score
AMD Ryzen 9 9950X
Ryzen 9 9950X, 4300 МГц
10016 Points +11%
Intel Core i9-14900K
i9-14900K, 3200 МГц
9890 Points +9%
AMD Ryzen 7 9700X
Ryzen 7 9700X, 3800 МГц
9801 Points +8%
Intel Core Ultra 9 285K
Ultra 9 285K, 3200 МГц
9791 Points +8%
AMD Ryzen 5 9600X
Ryzen 5 9600X, 3900 МГц
9757 Points +8%
Intel Core i9-13900K
i9-13900K, 3000 МГц
9598 Points +6%
AMD Ryzen 7 9800X3D
R7 9800X3D, 4700 МГц
9530 Points +5%
AMD Ryzen 9 7950X
R9 7950X, 4500 МГц
9322 Points +3%
AMD Ryzen 9 7950X3D
R9 7950X3D, 4200 МГц
9240 Points +2%
AMD Ryzen 9 7900X
R9 7900X, 4700 МГц
9193 Points +2%
Intel Core Ultra 5 245K
Ultra 5 245K, 3600 МГц
9171 Points +1%
AMD Ryzen 7 7800X3D
R7 7800X3D, 4200 МГц
9097 Points +1%
Intel Core Ultra 5 235
Ultra 5 235, 3400 МГц
9043 Points
AMD Ryzen 5 7600X
R5 7600X, 4700 МГц
8926 Points -1%
Intel Core i5-14600K
i5-14600K, 3500 МГц
8904 Points -2%
Intel Core Ultra 5 225F
Ultra 5 225F, 3300 МГц
8813 Points -3%
Intel Core i9-12900K
i9-12900K, 3200 МГц
8665 Points -4%
Intel Core i5-13600K
i5-13600K, 3500 МГц
8618 Points -5%
AMD Ryzen 7 7745HX
R7 7745HX, 3600 МГц
8243 Points -9%
Intel Core i5-12600K
i5-12600K, 2800 МГц
8223 Points -9%
Intel Core i5-13400
i5-13400, 2500 МГц
7683 Points -15%
Intel Core i5-12400F
i5-12400F, 2500 МГц
7548 Points -17%
AMD Ryzen 9 5950X
R9 5950X, 3400 МГц
7216 Points -20%
64 Bit Multi-Core Score
AMD Ryzen 9 9950X
Ryzen 9 9950X, 4300 МГц
100326 Points +52%
Intel Core Ultra 9 285K
Ultra 9 285K, 3200 МГц
92188 Points +40%
AMD Ryzen 9 7950X
R9 7950X, 4500 МГц
89678 Points +36%
Intel Core i9-14900K
i9-14900K, 3200 МГц
89177 Points +35%
AMD Ryzen 9 7950X3D
R9 7950X3D, 4200 МГц
87922 Points +34%
Intel Core i9-13900K
i9-13900K, 3000 МГц
86695 Points +32%
AMD Ryzen 9 7900X
R9 7900X, 4700 МГц
74731 Points +14%
AMD Ryzen 7 9800X3D
R7 9800X3D, 4700 МГц
70343 Points +7%
Intel Core Ultra 5 245K
Ultra 5 245K, 3600 МГц
65981 Points 0%
Intel Core Ultra 5 235
Ultra 5 235, 3400 МГц
65823 Points
Intel Core i5-14600K
i5-14600K, 3500 МГц
64035 Points -3%
Intel Core i9-12900K
i9-12900K, 3200 МГц
63583 Points -3%
AMD Ryzen 9 5950X
R9 5950X, 3400 МГц
63233 Points -4%
Intel Core i5-13600K
i5-13600K, 3500 МГц
60407 Points -8%
AMD Ryzen 7 9700X
Ryzen 7 9700X, 3800 МГц
59594 Points -9%
AMD Ryzen 7 7800X3D
R7 7800X3D, 4200 МГц
54840 Points -17%
AMD Ryzen 7 7745HX
R7 7745HX, 3600 МГц
54665 Points -17%
AMD Ryzen 5 9600X
Ryzen 5 9600X, 3900 МГц
51644 Points -22%
Intel Core Ultra 5 225F
Ultra 5 225F, 3300 МГц
50491 Points -23%
AMD Ryzen 5 7600X
R5 7600X, 4700 МГц
47407 Points -28%
Intel Core i5-12600K
i5-12600K, 2800 МГц
46557 Points -29%
Intel Core i5-13400
i5-13400, 2500 МГц
42509 Points -35%
Intel Core i5-12400F
i5-12400F, 2500 МГц
35098 Points -47%
3DMark 11 - 1280x720 Performance Physics
AMD Ryzen 7 9800X3D
R7 9800X3D, 4700 МГц
39622 Points +47%
AMD Ryzen 9 9950X
Ryzen 9 9950X, 4300 МГц
38269 Points +42%
AMD Ryzen 9 7950X3D
R9 7950X3D, 4200 МГц
36991 Points +37%
AMD Ryzen 7 7800X3D
R7 7800X3D, 4200 МГц
35127 Points +30%
Intel Core i9-13900K
i9-13900K, 3000 МГц
32273 Points +20%
Intel Core i9-14900K
i9-14900K, 3200 МГц
32188 Points +19%
Intel Core i5-14600K
i5-14600K, 3500 МГц
31641 Points +17%
AMD Ryzen 7 9700X
Ryzen 7 9700X, 3800 МГц
30757 Points +14%
Intel Core i5-13600K
i5-13600K, 3500 МГц
30480 Points +13%
Intel Core Ultra 9 285K
Ultra 9 285K, 3200 МГц
28636 Points +6%
AMD Ryzen 9 7900X
R9 7900X, 4700 МГц
28618 Points +6%
AMD Ryzen 9 7950X
R9 7950X, 4500 МГц
28618 Points +6%
Intel Core i9-12900K
i9-12900K, 3200 МГц
28211 Points +5%
Intel Core Ultra 5 245K
Ultra 5 245K, 3600 МГц
27022 Points 0%
Intel Core Ultra 5 235
Ultra 5 235, 3400 МГц
26990 Points
AMD Ryzen 7 7745HX
R7 7745HX, 3600 МГц
26321 Points -2%
AMD Ryzen 5 9600X
Ryzen 5 9600X, 3900 МГц
25717 Points -5%
AMD Ryzen 5 7600X
R5 7600X, 4700 МГц
25396 Points -6%
AMD Ryzen 9 5950X
R9 5950X, 3400 МГц
25367 Points -6%
Intel Core i5-12600K
i5-12600K, 2800 МГц
25017 Points -7%
Intel Core i5-13400
i5-13400, 2500 МГц
23120 Points -14%
Intel Core Ultra 5 225F
Ultra 5 225F, 3300 МГц
21562 Points -20%
Intel Core i5-12400F
i5-12400F, 2500 МГц
19436 Points -28%
7-Zip 18.03
7z b 4
AMD Ryzen 9 7950X
R9 7950X, 4500 МГц
161724 MIPS +127%
AMD Ryzen 9 9950X
Ryzen 9 9950X, 4300 МГц
160423 MIPS +125%
AMD Ryzen 9 7950X3D
R9 7950X3D, 4200 МГц
159341 MIPS +124%
Intel Core i9-14900K
i9-14900K, 3200 МГц
149570 MIPS +110%
Intel Core i9-13900K
i9-13900K, 3000 МГц
147068 MIPS +107%
Intel Core Ultra 9 285K
Ultra 9 285K, 3200 МГц
129542 MIPS +82%
AMD Ryzen 9 5950X
R9 5950X, 3400 МГц
127792 MIPS +80%
AMD Ryzen 9 7900X
R9 7900X, 4700 МГц
124975 MIPS +76%
Intel Core i9-12900K
i9-12900K, 3200 МГц
97671 MIPS +37%
Intel Core i5-14600K
i5-14600K, 3500 МГц
93235 MIPS +31%
AMD Ryzen 7 9800X3D
R7 9800X3D, 4700 МГц
90354 MIPS +27%
Intel Core i5-13600K
i5-13600K, 3500 МГц
89647 MIPS +26%
AMD Ryzen 7 7800X3D
R7 7800X3D, 4200 МГц
85067 MIPS +20%
AMD Ryzen 7 7745HX
R7 7745HX, 3600 МГц
83268 MIPS +17%
AMD Ryzen 7 9700X
Ryzen 7 9700X, 3800 МГц
82553 MIPS +16%
Intel Core Ultra 5 245K
Ultra 5 245K, 3600 МГц
77921 MIPS +9%
Intel Core Ultra 5 235
Ultra 5 235, 3400 МГц
71174 MIPS
AMD Ryzen 5 7600X
R5 7600X, 4700 МГц
69291 MIPS -3%
AMD Ryzen 5 9600X
Ryzen 5 9600X, 3900 МГц
68220 MIPS -4%
Intel Core i5-12600K
i5-12600K, 2800 МГц
64260 MIPS -10%
Intel Core i5-13400
i5-13400, 2500 МГц
59510 MIPS -16%
Intel Core Ultra 5 225F
Ultra 5 225F, 3300 МГц
54166 MIPS -24%
Intel Core i5-12400F
i5-12400F, 2500 МГц
45043 MIPS -37%
7z b 4 -mmt1
AMD Ryzen 7 9800X3D
R7 9800X3D, 4700 МГц
8484 MIPS +31%
AMD Ryzen 9 7950X
R9 7950X, 4500 МГц
8365 MIPS +29%
AMD Ryzen 9 7950X3D
R9 7950X3D, 4200 МГц
8321 MIPS +28%
AMD Ryzen 9 7900X
R9 7900X, 4700 МГц
8282 MIPS +28%
AMD Ryzen 7 7800X3D
R7 7800X3D, 4200 МГц
8235 MIPS +27%
AMD Ryzen 5 7600X
R5 7600X, 4700 МГц
8063 MIPS +24%
AMD Ryzen 7 9700X
Ryzen 7 9700X, 3800 МГц
7894 MIPS +22%
AMD Ryzen 9 9950X
Ryzen 9 9950X, 4300 МГц
7852 MIPS +21%
AMD Ryzen 5 9600X
Ryzen 5 9600X, 3900 МГц
7796 MIPS +20%
Intel Core i9-14900K
i9-14900K, 3200 МГц
7772 MIPS +20%
Intel Core Ultra 9 285K
Ultra 9 285K, 3200 МГц
7288 MIPS +12%
AMD Ryzen 7 7745HX
R7 7745HX, 3600 МГц
7275 MIPS +12%
Intel Core i9-13900K
i9-13900K, 3000 МГц
7272 MIPS +12%
AMD Ryzen 9 5950X
R9 5950X, 3400 МГц
6974 MIPS +8%
Intel Core i5-14600K
i5-14600K, 3500 МГц
6910 MIPS +7%
Intel Core i9-12900K
i9-12900K, 3200 МГц
6571 MIPS +1%
Intel Core i5-13600K
i5-13600K, 3500 МГц
6502 MIPS 0%
Intel Core Ultra 5 235
Ultra 5 235, 3400 МГц
6479 MIPS
Intel Core Ultra 5 245K
Ultra 5 245K, 3600 МГц
6477 MIPS 0%
Intel Core Ultra 5 225F
Ultra 5 225F, 3300 МГц
6000 MIPS -7%
Intel Core i5-12600K
i5-12600K, 2800 МГц
5944 MIPS -8%
Intel Core i5-13400
i5-13400, 2500 МГц
5829 MIPS -10%
Intel Core i5-12400F
i5-12400F, 2500 МГц
5476 MIPS -15%
HWBOT x265 Benchmark v2.2 - 4k Preset
AMD Ryzen 9 9950X
Ryzen 9 9950X, 4300 МГц
45.1 fps +80%
Intel Core Ultra 9 285K
Ultra 9 285K, 3200 МГц
45 fps +80%
AMD Ryzen 9 7950X
R9 7950X, 4500 МГц
44.4 fps +78%
Intel Core i9-14900K
i9-14900K, 3200 МГц
42.8 fps +71%
Intel Core i9-13900K
i9-13900K, 3000 МГц
42.6 fps +70%
AMD Ryzen 9 7950X3D
R9 7950X3D, 4200 МГц
42.4 fps +70%
AMD Ryzen 9 7900X
R9 7900X, 4700 МГц
36.2 fps +45%
AMD Ryzen 9 5950X
R9 5950X, 3400 МГц
31.8 fps +27%
AMD Ryzen 7 9800X3D
R7 9800X3D, 4700 МГц
30.6 fps +22%
Intel Core i5-12600K
i5-12600K, 2800 МГц
30.1 fps +20%
Intel Core i9-12900K
i9-12900K, 3200 МГц
30 fps +20%
Intel Core Ultra 5 245K
Ultra 5 245K, 3600 МГц
29.6 fps +18%
Intel Core i5-14600K
i5-14600K, 3500 МГц
28.6 fps +14%
Intel Core i5-13600K
i5-13600K, 3500 МГц
27.6 fps +10%
AMD Ryzen 7 9700X
Ryzen 7 9700X, 3800 МГц
26.4 fps +6%
Intel Core Ultra 5 235
Ultra 5 235, 3400 МГц
25 fps
AMD Ryzen 7 7800X3D
R7 7800X3D, 4200 МГц
24.4 fps -2%
AMD Ryzen 7 7745HX
R7 7745HX, 3600 МГц
24.1 fps -4%
AMD Ryzen 5 9600X
Ryzen 5 9600X, 3900 МГц
23.2 fps -7%
AMD Ryzen 5 7600X
R5 7600X, 4700 МГц
21.1 fps -16%
Intel Core Ultra 5 225F
Ultra 5 225F, 3300 МГц
20.7 fps -17%
Intel Core i5-13400
i5-13400, 2500 МГц
19.1 fps -24%
Intel Core i5-12400F
i5-12400F, 2500 МГц
15.2 fps -39%
R Benchmark 2.5 - Overall mean
Intel Core i5-12400F
i5-12400F, 2500 МГц
0.4837 sec * -18%
Intel Core i5-13400
i5-13400, 2500 МГц
0.4654 sec * -13%
Intel Core Ultra 5 225F
Ultra 5 225F, 3300 МГц
0.4598 sec * -12%
AMD Ryzen 9 5950X
R9 5950X, 3400 МГц
0.4556 sec * -11%
Intel Core i5-12600K
i5-12600K, 2800 МГц
0.4456 sec * -9%
Intel Core i9-12900K
i9-12900K, 3200 МГц
0.4216 sec * -3%
AMD Ryzen 7 7800X3D
R7 7800X3D, 4200 МГц
0.4152 sec * -1%
AMD Ryzen 7 7745HX
R7 7745HX, 3600 МГц
0.4141 sec * -1%
Intel Core Ultra 5 235
Ultra 5 235, 3400 МГц
0.4101 sec *
Intel Core Ultra 5 245K
Ultra 5 245K, 3600 МГц
0.4086 sec * -0%
Intel Core Ultra 5 245K
Ultra 5 245K, 3600 МГц
0.4058 sec * +1%
Intel Core i5-13600K
i5-13600K, 3500 МГц
0.405 sec * +1%
Intel Core i5-14600K
i5-14600K, 3500 МГц
0.3937 sec * +4%
Intel Core Ultra 9 285K
Ultra 9 285K, 3200 МГц
0.3833 sec * +7%
AMD Ryzen 5 7600X
R5 7600X, 4700 МГц
0.3749 sec * +9%
AMD Ryzen 9 7900X
R9 7900X, 4700 МГц
0.3736 sec * +9%
AMD Ryzen 9 7950X3D
R9 7950X3D, 4200 МГц
0.372 sec * +9%
AMD Ryzen 9 7950X
R9 7950X, 4500 МГц
0.3682 sec * +10%
Intel Core i9-13900K
i9-13900K, 3000 МГц
0.3539 sec * +14%
AMD Ryzen 7 9800X3D
R7 9800X3D, 4700 МГц
0.3461 sec * +16%
Intel Core i9-14900K
i9-14900K, 3200 МГц
0.345 sec * +16%
AMD Ryzen 7 9700X
Ryzen 7 9700X, 3800 МГц
0.3414 sec * +17%
AMD Ryzen 5 9600X
Ryzen 5 9600X, 3900 МГц
0.3389 sec * +17%
AMD Ryzen 9 9950X
Ryzen 9 9950X, 4300 МГц
0.3307 sec * +19%
LibreOffice - 20 Documents To PDF
Intel Core i5-12600K
i5-12600K, 2800 МГц
71.8 s * -59%
AMD Ryzen 7 9800X3D
R7 9800X3D, 4700 МГц
46.6 s * -3%
Intel Core i5-12400F
i5-12400F, 2500 МГц
46.5 s * -3%
AMD Ryzen 5 9600X
Ryzen 5 9600X, 3900 МГц
46.4 s * -3%
AMD Ryzen 9 5950X
R9 5950X, 3400 МГц
45.97 s * -2%
Intel Core Ultra 5 235
Ultra 5 235, 3400 МГц
45.2 s *
AMD Ryzen 9 9950X
Ryzen 9 9950X, 4300 МГц
45.1 s * -0%
AMD Ryzen 7 9700X
Ryzen 7 9700X, 3800 МГц
43.8 s * +3%
Intel Core Ultra 5 245K
Ultra 5 245K, 3600 МГц
43.1 s * +5%
Intel Core Ultra 5 245K
Ultra 5 245K, 3600 МГц
39.3 s * +13%
AMD Ryzen 7 7745HX
R7 7745HX, 3600 МГц
41.4 s * +8%
AMD Ryzen 7 7800X3D
R7 7800X3D, 4200 МГц
40.7 s * +10%
Intel Core i9-12900K
i9-12900K, 3200 МГц
40.6 s * +10%
Intel Core Ultra 5 225F
Ultra 5 225F, 3300 МГц
38.8 s * +14%
Intel Core i5-13400
i5-13400, 2500 МГц
38.7 s * +14%
AMD Ryzen 9 7950X3D
R9 7950X3D, 4200 МГц
38.6 s * +15%
AMD Ryzen 5 7600X
R5 7600X, 4700 МГц
36.8 s * +19%
Intel Core i9-13900K
i9-13900K, 3000 МГц
36.6 s * +19%
Intel Core Ultra 9 285K
Ultra 9 285K, 3200 МГц
36.2 s * +20%
AMD Ryzen 9 7950X
R9 7950X, 4500 МГц
35.5 s * +21%
Intel Core i5-13600K
i5-13600K, 3500 МГц
35 s * +23%
AMD Ryzen 9 7900X
R9 7900X, 4700 МГц
34.9 s * +23%
Intel Core i9-14900K
i9-14900K, 3200 МГц
32.5 s * +28%
Intel Core i5-14600K
i5-14600K, 3500 МГц
31.9 s * +29%
WebXPRT 3 - Overall
AMD Ryzen 9 9950X
Ryzen 9 9950X, 4300 МГц
409 Points +24%
AMD Ryzen 7 9700X
Ryzen 7 9700X, 3800 МГц
398 Points +21%
AMD Ryzen 9 7950X3D
R9 7950X3D, 4200 МГц
383 Points +16%
Intel Core i9-14900K
i9-14900K, 3200 МГц
382 Points +16%
Intel Core Ultra 9 285K
Ultra 9 285K, 3200 МГц
377 Points +15%
AMD Ryzen 9 7900X
R9 7900X, 4700 МГц
371 Points +13%
AMD Ryzen 9 7950X
R9 7950X, 4500 МГц
366 Points +11%
AMD Ryzen 5 9600X
Ryzen 5 9600X, 3900 МГц
364 Points +11%
AMD Ryzen 5 7600X
R5 7600X, 4700 МГц
362 Points +10%
Intel Core i9-13900K
i9-13900K, 3000 МГц
361 Points +10%
Intel Core i5-14600K
i5-14600K, 3500 МГц
354 Points +8%
AMD Ryzen 7 7800X3D
R7 7800X3D, 4200 МГц
353 Points +7%
AMD Ryzen 7 9800X3D
R7 9800X3D, 4700 МГц
353 Points +7%
AMD Ryzen 7 7745HX
R7 7745HX, 3600 МГц
349 Points +6%
Intel Core Ultra 5 245K
Ultra 5 245K, 3600 МГц
346 Points +5%
Intel Core i5-13600K
i5-13600K, 3500 МГц
333 Points +1%
Intel Core Ultra 5 235
Ultra 5 235, 3400 МГц
329 Points
Intel Core i9-12900K
i9-12900K, 3200 МГц
320 Points -3%
Intel Core Ultra 5 225F
Ultra 5 225F, 3300 МГц
319 Points -3%
Intel Core i5-13400
i5-13400, 2500 МГц
306 Points -7%
Intel Core i5-12600K
i5-12600K, 2800 МГц
293 Points -11%
AMD Ryzen 9 5950X
R9 5950X, 3400 МГц
291 Points -12%
Intel Core i5-12400F
i5-12400F, 2500 МГц
272 Points -17%
Mozilla Kraken 1.1 - Total
Intel Core i5-12400F
i5-12400F, 2500 МГц
573 ms * -31%
AMD Ryzen 9 5950X
R9 5950X, 3400 МГц
558 ms * -28%
Intel Core i5-13400
i5-13400, 2500 МГц
535 ms * -23%
Intel Core i5-12600K
i5-12600K, 2800 МГц
511 ms * -17%
AMD Ryzen 7 7800X3D
R7 7800X3D, 4200 МГц
487 ms * -12%
Intel Core i9-12900K
i9-12900K, 3200 МГц
481 ms * -10%
AMD Ryzen 7 7745HX
R7 7745HX, 3600 МГц
481 ms * -10%
Intel Core i5-13600K
i5-13600K, 3500 МГц
469 ms * -8%
Intel Core Ultra 5 225F
Ultra 5 225F, 3300 МГц
451 ms * -3%
Intel Core i5-14600K
i5-14600K, 3500 МГц
450 ms * -3%
AMD Ryzen 5 7600X
R5 7600X, 4700 МГц
441 ms * -1%
AMD Ryzen 9 7950X3D
R9 7950X3D, 4200 МГц
437 ms * -0%
Intel Core Ultra 5 235
Ultra 5 235, 3400 МГц
436 ms *
AMD Ryzen 9 7950X
R9 7950X, 4500 МГц
433 ms * +1%
Intel Core i9-13900K
i9-13900K, 3000 МГц
432 ms * +1%
AMD Ryzen 9 7900X
R9 7900X, 4700 МГц
431 ms * +1%
Intel Core Ultra 5 245K
Ultra 5 245K, 3600 МГц
425 ms * +3%
Intel Core i9-14900K
i9-14900K, 3200 МГц
418 ms * +4%
AMD Ryzen 7 9800X3D
R7 9800X3D, 4700 МГц
401 ms * +8%
Intel Core Ultra 9 285K
Ultra 9 285K, 3200 МГц
396 ms * +9%
AMD Ryzen 5 9600X
Ryzen 5 9600X, 3900 МГц
389 ms * +11%
AMD Ryzen 7 9700X
Ryzen 7 9700X, 3800 МГц
383 ms * +12%
AMD Ryzen 9 9950X
Ryzen 9 9950X, 4300 МГц
377 ms * +14%
3DMark
1920x1080 Fire Strike Physics
Intel Core i9-14900K
i9-14900K, 3200 МГц
56087 Points +49%
Intel Core i9-13900K
i9-13900K, 3000 МГц
53853 Points +43%
Intel Core Ultra 9 285K
Ultra 9 285K, 3200 МГц
53194 Points +41%
AMD Ryzen 9 9950X
Ryzen 9 9950X, 4300 МГц
49522 Points +31%
AMD Ryzen 9 7950X3D
R9 7950X3D, 4200 МГц
44787 Points +19%
AMD Ryzen 9 7900X
R9 7900X, 4700 МГц
42682 Points +13%
AMD Ryzen 9 7950X
R9 7950X, 4500 МГц
42682 Points +13%
Intel Core i5-14600K
i5-14600K, 3500 МГц
40164 Points +6%
AMD Ryzen 7 9800X3D
R7 9800X3D, 4700 МГц
39893 Points +6%
AMD Ryzen 9 5950X
R9 5950X, 3400 МГц
39600 Points +5%
Intel Core i9-12900K
i9-12900K, 3200 МГц
39112 Points +4%
Intel Core Ultra 5 245K
Ultra 5 245K, 3600 МГц
38202 Points +1%
AMD Ryzen 7 9700X
Ryzen 7 9700X, 3800 МГц
38088 Points +1%
Intel Core Ultra 5 235
Ultra 5 235, 3400 МГц
37722 Points
Intel Core i5-13600K
i5-13600K, 3500 МГц
35386 Points -6%
AMD Ryzen 5 9600X
Ryzen 5 9600X, 3900 МГц
33462 Points -11%
AMD Ryzen 7 7800X3D
R7 7800X3D, 4200 МГц
33345 Points -12%
Intel Core Ultra 5 225F
Ultra 5 225F, 3300 МГц
31547 Points -16%
AMD Ryzen 5 7600X
R5 7600X, 4700 МГц
30691 Points -19%
Intel Core i5-12600K
i5-12600K, 2800 МГц
29671 Points -21%
Intel Core i5-13400
i5-13400, 2500 МГц
27135 Points -28%
Intel Core i5-12400F
i5-12400F, 2500 МГц
24023 Points -36%
AMD Ryzen 7 7745HX
R7 7745HX, 3600 МГц
19932 Points -47%
2560x1440 Time Spy CPU
Intel Core i9-14900K
i9-14900K, 3200 МГц
23721 Points +47%
Intel Core i9-13900K
i9-13900K, 3000 МГц
19392 Points +20%
Intel Core i5-14600K
i5-14600K, 3500 МГц
18768 Points +16%
Intel Core i9-12900K
i9-12900K, 3200 МГц
18431 Points +14%
Intel Core Ultra 9 285K
Ultra 9 285K, 3200 МГц
17911 Points +11%
AMD Ryzen 9 7950X3D
R9 7950X3D, 4200 МГц
17206 Points +7%
Intel Core i5-13600K
i5-13600K, 3500 МГц
17124 Points +6%
AMD Ryzen 9 7900X
R9 7900X, 4700 МГц
16616 Points +3%
AMD Ryzen 9 7950X
R9 7950X, 4500 МГц
16616 Points +3%
AMD Ryzen 7 9800X3D
R7 9800X3D, 4700 МГц
16159 Points 0%
Intel Core Ultra 5 235
Ultra 5 235, 3400 МГц
16138 Points
AMD Ryzen 9 9950X
Ryzen 9 9950X, 4300 МГц
16112 Points 0%
Intel Core Ultra 5 245K
Ultra 5 245K, 3600 МГц
15010 Points -7%
AMD Ryzen 7 9700X
Ryzen 7 9700X, 3800 МГц
14306 Points -11%
AMD Ryzen 7 7800X3D
R7 7800X3D, 4200 МГц
14098 Points -13%
Intel Core i5-12600K
i5-12600K, 2800 МГц
13869 Points -14%
AMD Ryzen 9 5950X
R9 5950X, 3400 МГц
13650 Points -15%
Intel Core i5-13400
i5-13400, 2500 МГц
12948 Points -20%
Intel Core Ultra 5 225F
Ultra 5 225F, 3300 МГц
11220 Points -30%
AMD Ryzen 7 7745HX
R7 7745HX, 3600 МГц
11051 Points -32%
AMD Ryzen 5 9600X
Ryzen 5 9600X, 3900 МГц
10821 Points -33%
AMD Ryzen 5 7600X
R5 7600X, 4700 МГц
10458 Points -35%
Intel Core i5-12400F
i5-12400F, 2500 МГц
9745 Points -40%
Super Pi mod 1.5 XS 1M - 1M
Intel Core i5-12400F
i5-12400F, 2500 МГц
8.298 s * -9%
Intel Core i5-13400
i5-13400, 2500 МГц
8.033 s * -5%
AMD Ryzen 7 9800X3D
R7 9800X3D, 4700 МГц
8.005 s * -5%
Intel Core Ultra 5 225F
Ultra 5 225F, 3300 МГц
7.792 s * -2%
Intel Core Ultra 5 235
Ultra 5 235, 3400 МГц
7.635 s *
AMD Ryzen 5 9600X
Ryzen 5 9600X, 3900 МГц
7.614 s * -0%
AMD Ryzen 7 9700X
Ryzen 7 9700X, 3800 МГц
7.54 s * +1%
AMD Ryzen 5 7600X
R5 7600X, 4700 МГц
7.423 s * +3%
Intel Core i5-12600K
i5-12600K, 2800 МГц
7.406 s * +3%
AMD Ryzen 9 9950X
Ryzen 9 9950X, 4300 МГц
7.31 s * +4%
Intel Core Ultra 5 245K
Ultra 5 245K, 3600 МГц
7.303 s * +4%
AMD Ryzen 7 7800X3D
R7 7800X3D, 4200 МГц
7.089 s * +7%
AMD Ryzen 9 5950X
R9 5950X, 3400 МГц
7.065 s * +7%
Intel Core i9-12900K
i9-12900K, 3200 МГц
7.063 s * +7%
AMD Ryzen 7 7745HX
R7 7745HX, 3600 МГц
6.813 s * +11%
Intel Core Ultra 9 285K
Ultra 9 285K, 3200 МГц
6.713 s * +12%
Intel Core i5-13600K
i5-13600K, 3500 МГц
6.58 s * +14%
Intel Core i5-14600K
i5-14600K, 3500 МГц
6.234 s * +18%
AMD Ryzen 9 7900X
R9 7900X, 4700 МГц
6.141 s * +20%
AMD Ryzen 9 7950X3D
R9 7950X3D, 4200 МГц
6.109 s * +20%
AMD Ryzen 9 7950X
R9 7950X, 4500 МГц
6.088 s * +20%
Intel Core i9-13900K
i9-13900K, 3000 МГц
5.655 s * +26%
Intel Core i9-14900K
i9-14900K, 3200 МГц
5.476 s * +28%
Super Pi mod 1.5 XS 2M - 2M
Intel Core i5-12400F
i5-12400F, 2500 МГц
18.473 s * -10%
Intel Core i5-13400
i5-13400, 2500 МГц
17.963 s * -7%
AMD Ryzen 7 9800X3D
R7 9800X3D, 4700 МГц
17.086 s * -2%
Intel Core Ultra 5 225F
Ultra 5 225F, 3300 МГц
16.962 s * -1%
Intel Core Ultra 5 235
Ultra 5 235, 3400 МГц
16.731 s *
Intel Core i5-12600K
i5-12600K, 2800 МГц
16.42 s * +2%
AMD Ryzen 5 9600X
Ryzen 5 9600X, 3900 МГц
16.363 s * +2%
AMD Ryzen 7 9700X
Ryzen 7 9700X, 3800 МГц
16.1 s * +4%
Intel Core Ultra 5 245K
Ultra 5 245K, 3600 МГц
16.026 s * +4%
AMD Ryzen 5 7600X
R5 7600X, 4700 МГц
15.954 s * +5%
AMD Ryzen 9 9950X
Ryzen 9 9950X, 4300 МГц
15.61 s * +7%
Intel Core i9-12900K
i9-12900K, 3200 МГц
15.59 s * +7%
AMD Ryzen 7 7800X3D
R7 7800X3D, 4200 МГц
15.335 s * +8%
AMD Ryzen 9 5950X
R9 5950X, 3400 МГц
15.28 s * +9%
Intel Core i5-13600K
i5-13600K, 3500 МГц
14.876 s * +11%
AMD Ryzen 7 7745HX
R7 7745HX, 3600 МГц
14.691 s * +12%
Intel Core Ultra 9 285K
Ultra 9 285K, 3200 МГц
14.64 s * +12%
Intel Core i5-14600K
i5-14600K, 3500 МГц
13.657 s * +18%
AMD Ryzen 9 7950X
R9 7950X, 4500 МГц
13.291 s * +21%
AMD Ryzen 9 7900X
R9 7900X, 4700 МГц
13.251 s * +21%
Intel Core i9-13900K
i9-13900K, 3000 МГц
13.193 s * +21%
AMD Ryzen 9 7950X3D
R9 7950X3D, 4200 МГц
13.189 s * +21%
Intel Core i9-14900K
i9-14900K, 3200 МГц
11.996 s * +28%

* ... меньше = лучше
Cinebench, Intel Core Ultra 5 235

Cinebench R15
Cinebench R15
Cinebench R20
Cinebench R20
Cinebench R23
Cinebench R23
Cinebench 2024
Cinebench 2024

Cinebench, Intel Core Ultra 5 225F

Cinebench R15
Cinebench R15
Cinebench R20
Cinebench R20
Cinebench R23
Cinebench R23
Cinebench 2024
Cinebench 2024

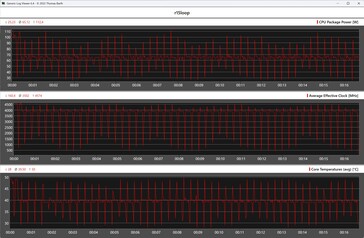
Intel Core Ultra 5 235 и Intel Core Ultra 5 225F в многопоточном тесте Cinebench R15

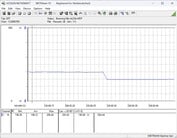
Оба процессора справились с непрерывным циклом Cinebench R15 без существенных ограничений. При непрерывной нагрузке их энергопотребление снизилось, как и предполагалось, до значения PL1 (65 Вт), которое поддерживалось без каких-либо проблем.

Многопоточный тест Cinebench R15

Intel Core Ultra 5 235
Intel Core Ultra 5 225F
2263.72463.72663.72863.73063.73263.73463.7Tooltip
Intel Core Ultra 5 235 Ultra 5 235: Ø2903 (2849.61-3580.38)
Intel Core Ultra 5 225F Ultra 5 225F: Ø2290 (2263.72-2625.36)

Бенчмарки и приложения

При повседневном использовании Intel Core Ultra 5 235 и Core Ultra 5 225F обеспечивают солидную производительность, сравнимую с другими процессорами того же сегмента. При обычном использовании вряд ли будут заметны какие-либо различия - даже если в бенчмарках они оказались на нижней границе тестового поля. Как и ожидалось, наши тестовые образцы заняли место сразу после Intel Core Ultra 5 245Kчто объясняет субъективно небольшую разницу в производительности между другими процессорами.

PCMark 10 - Score
AMD Ryzen 9 9950X
10699 Points +19%
Intel Core Ultra 9 285K
10443 Points +16%
Intel Core i9-14900K
10101 Points +12%
AMD Ryzen 5 9600X
10060 Points +12%
AMD Ryzen 9 7900X
9911 Points +10%
AMD Ryzen 9 7950X
9911 Points +10%
Intel Core i9-13900K
9788 Points +9%
Intel Core i5-14600K
9587 Points +7%
AMD Ryzen 7 7800X3D
9500 Points +6%
AMD Ryzen 5 7600X
9470 Points +5%
Intel Core Ultra 5 245K
9409 Points +5%
Intel Core i5-13600K
9362 Points +4%
Intel Core Ultra 5 235
8982 Points
Intel Core Ultra 5 225F
8892 Points -1%
AMD Ryzen 9 5950X
8778 Points -2%
Intel Core i5-13400
8614 Points -4%
Intel Core i9-12900K
8604 Points -4%
Intel Core i5-12600K
8259 Points -8%
Intel Core i5-12400F
7756 Points -14%
CrossMark - Overall
Intel Core i9-14900K
2611 Points +23%
Intel Core i9-13900K
2589 Points +21%
Intel Core Ultra 9 285K
2533 Points +19%
AMD Ryzen 9 7950X
2512 Points +18%
AMD Ryzen 9 9950X
2451 Points +15%
AMD Ryzen 9 7900X
2405 Points +13%
Intel Core i5-14600K
2310 Points +8%
Intel Core i5-13600K
2271 Points +7%
Intel Core Ultra 5 245K
2245 Points +5%
AMD Ryzen 5 7600X
2236 Points +5%
AMD Ryzen 7 7800X3D
2216 Points +4%
AMD Ryzen 9 7950X3D
2193 Points +3%
Intel Core Ultra 5 235
2131 Points
AMD Ryzen 5 9600X
2103 Points -1%
Intel Core Ultra 5 225F
2006 Points -6%
Intel Core i5-13400
1877 Points -12%
Intel Core i5-12400F
1762 Points -17%
AMD Ryzen 9 5950X
1495 Points -30%
Blender
v2.79 BMW27 CPU
Intel Core i5-12400F
269 Seconds * -60%
Intel Core Ultra 5 225F
218 Seconds * -30%
Intel Core i5-13400
206 Seconds * -23%
AMD Ryzen 5 7600X
203 Seconds * -21%
Intel Core i5-12600K
189.5 Seconds * -13%
AMD Ryzen 5 9600X
184 Seconds * -10%
AMD Ryzen 7 7800X3D
169 Seconds * -1%
Intel Core Ultra 5 235
168 Seconds *
Intel Core Ultra 5 245K
136 Seconds * +19%
Intel Core i5-13600K
135 Seconds * +20%
Intel Core i5-14600K
134 Seconds * +20%
Intel Core i9-12900K
121.1 Seconds * +28%
AMD Ryzen 9 5950X
112.8 Seconds * +33%
AMD Ryzen 9 7900X
106 Seconds * +37%
AMD Ryzen 9 7950X3D
86 Seconds * +49%
AMD Ryzen 9 7950X
85 Seconds * +49%
Intel Core i9-13900K
80 Seconds * +52%
Intel Core i9-14900K
80 Seconds * +52%
Intel Core Ultra 9 285K
79 Seconds * +53%
AMD Ryzen 9 9950X
77 Seconds * +54%
v3.3 Classroom CPU
Intel Core i5-12400F
430 Seconds * -55%
Intel Core Ultra 5 225F
351 Seconds * -26%
Intel Core i5-13400
336 Seconds * -21%
AMD Ryzen 5 9600X
289 Seconds * -4%
Intel Core Ultra 5 235
278 Seconds *
AMD Ryzen 7 7800X3D
266 Seconds * +4%
Intel Core i5-13600K
224 Seconds * +19%
Intel Core i5-14600K
223 Seconds * +20%
Intel Core Ultra 5 245K
216 Seconds * +22%
Intel Core i9-13900K
138 Seconds * +50%
Intel Core i9-14900K
135 Seconds * +51%
AMD Ryzen 9 7950X3D
133 Seconds * +52%
Intel Core Ultra 9 285K
124 Seconds * +55%
AMD Ryzen 9 9950X
118 Seconds * +58%

* ... меньше = лучше

Performance Rating - Percent
AMD Ryzen 5 9600X
NVIDIA GeForce RTX 4090
97.9 pt
Intel Core i9-14900K
NVIDIA GeForce RTX 4090
97 pt
Intel Core i5-14600K
NVIDIA GeForce RTX 4090
96.2 pt
Intel Core i7-13700K
NVIDIA GeForce RTX 4090
95.6 pt
AMD Ryzen 7 7800X3D
NVIDIA GeForce RTX 4090
95.1 pt
AMD Ryzen 9 7950X3D
NVIDIA GeForce RTX 4090
95.1 pt
AMD Ryzen 9 7950X
NVIDIA GeForce RTX 4090
95.1 pt
Intel Core i7-13700
NVIDIA GeForce RTX 4090
94.7 pt
Intel Core Ultra 9 285K
NVIDIA GeForce RTX 4090
91.1 pt
Intel Core i7-12700
NVIDIA GeForce RTX 4090
91 pt
Intel Core Ultra 5 245K
NVIDIA GeForce RTX 4090
90.8 pt
Intel Core Ultra 5 235
NVIDIA GeForce RTX 4090
89.2 pt
Intel Core Ultra 5 225F
NVIDIA GeForce RTX 4090
89 pt
Intel Core i5-13400
NVIDIA GeForce RTX 4090
88.7 pt
3DMark 11 - 1280x720 Performance GPU
AMD Ryzen 7 7800X3D
NVIDIA GeForce RTX 4090
114641 Points +7%
Intel Core Ultra 5 225F
NVIDIA GeForce RTX 4090
113075 Points +5%
Intel Core i5-14600K
NVIDIA GeForce RTX 4090
110994 Points +3%
AMD Ryzen 9 7950X
NVIDIA GeForce RTX 4090
107723 Points 0%
Intel Core Ultra 5 235
NVIDIA GeForce RTX 4090
107306 Points
Intel Core i7-13700K
NVIDIA GeForce RTX 4090
107060 Points 0%
AMD Ryzen 9 7950X3D
NVIDIA GeForce RTX 4090
105886 Points -1%
Intel Core i7-13700
NVIDIA GeForce RTX 4090
105473 Points -2%
Intel Core i9-14900K
NVIDIA GeForce RTX 4090
104998 Points -2%
Intel Core i7-12700
NVIDIA GeForce RTX 4090
104876 Points -2%
Intel Core Ultra 5 245K
NVIDIA GeForce RTX 4090
104781 Points -2%
Intel Core i5-13400
NVIDIA GeForce RTX 4090
104598 Points -3%
AMD Ryzen 5 9600X
NVIDIA GeForce RTX 4090
104516 Points -3%
Intel Core Ultra 9 285K
NVIDIA GeForce RTX 4090
97005 Points -10%
3DMark
2560x1440 Time Spy Graphics
Intel Core i5-14600K
NVIDIA GeForce RTX 4090
37769 Points +2%
Intel Core i9-14900K
NVIDIA GeForce RTX 4090
37762 Points +2%
AMD Ryzen 7 7800X3D
NVIDIA GeForce RTX 4090
37664 Points +2%
AMD Ryzen 5 9600X
NVIDIA GeForce RTX 4090
37161 Points 0%
Intel Core i7-13700K
NVIDIA GeForce RTX 4090
37109 Points 0%
Intel Core i7-13700
NVIDIA GeForce RTX 4090
37106 Points 0%
Intel Core Ultra 5 235
NVIDIA GeForce RTX 4090
36999 Points
AMD Ryzen 9 7950X
NVIDIA GeForce RTX 4090
36836 Points 0%
Intel Core Ultra 5 245K
NVIDIA GeForce RTX 4090
36813 Points -1%
Intel Core Ultra 5 225F
NVIDIA GeForce RTX 4090
36671 Points -1%
AMD Ryzen 9 7950X3D
NVIDIA GeForce RTX 4090
36665 Points -1%
Intel Core Ultra 9 285K
NVIDIA GeForce RTX 4090
36172 Points -2%
Intel Core i7-12700
NVIDIA GeForce RTX 4090
34580 Points -7%
Intel Core i5-13400
NVIDIA GeForce RTX 4090
33624 Points -9%
1920x1080 Fire Strike Graphics
Intel Core i5-14600K
NVIDIA GeForce RTX 4090
86031 Points +11%
Intel Core Ultra 5 225F
NVIDIA GeForce RTX 4090
81886 Points +5%
Intel Core i7-12700
NVIDIA GeForce RTX 4090
79398 Points +2%
Intel Core i7-13700K
NVIDIA GeForce RTX 4090
79091 Points +2%
Intel Core i7-13700
NVIDIA GeForce RTX 4090
78878 Points +1%
AMD Ryzen 5 9600X
NVIDIA GeForce RTX 4090
78579 Points +1%
Intel Core Ultra 5 245K
NVIDIA GeForce RTX 4090
78079 Points 0%
Intel Core Ultra 5 235
NVIDIA GeForce RTX 4090
77786 Points
Intel Core i5-13400
NVIDIA GeForce RTX 4090
77224 Points -1%
AMD Ryzen 7 7800X3D
NVIDIA GeForce RTX 4090
73447 Points -6%
AMD Ryzen 9 7950X3D
NVIDIA GeForce RTX 4090
72901 Points -6%
AMD Ryzen 9 7950X
NVIDIA GeForce RTX 4090
72678 Points -7%
Intel Core i9-14900K
NVIDIA GeForce RTX 4090
70971 Points -9%
Intel Core Ultra 9 285K
NVIDIA GeForce RTX 4090
55924 Points -28%
3840x2160 Fire Strike Ultra Graphics
AMD Ryzen 7 7800X3D
NVIDIA GeForce RTX 4090
25571 Points +3%
Intel Core i5-14600K
NVIDIA GeForce RTX 4090
25342 Points +3%
Intel Core i7-13700
NVIDIA GeForce RTX 4090
25254 Points +2%
Intel Core i9-14900K
NVIDIA GeForce RTX 4090
25209 Points +2%
Intel Core i7-13700K
NVIDIA GeForce RTX 4090
25187 Points +2%
Intel Core Ultra 5 245K
NVIDIA GeForce RTX 4090
25088 Points +1%
Intel Core i5-13400
NVIDIA GeForce RTX 4090
25052 Points +1%
AMD Ryzen 9 7950X
NVIDIA GeForce RTX 4090
25018 Points +1%
AMD Ryzen 9 7950X3D
NVIDIA GeForce RTX 4090
24969 Points +1%
AMD Ryzen 5 9600X
NVIDIA GeForce RTX 4090
24915 Points +1%
Intel Core Ultra 5 235
NVIDIA GeForce RTX 4090
24718 Points
Intel Core i7-12700
NVIDIA GeForce RTX 4090
24669 Points 0%
Intel Core Ultra 5 225F
NVIDIA GeForce RTX 4090
24648 Points 0%
Intel Core Ultra 9 285K
NVIDIA GeForce RTX 4090
24376 Points -1%
Unigine Superposition
1280x720 720p Low
AMD Ryzen 5 9600X
NVIDIA GeForce RTX 4090
63603 Points +70%
Intel Core i9-14900K
NVIDIA GeForce RTX 4090
57174 Points +53%
AMD Ryzen 7 7800X3D
NVIDIA GeForce RTX 4090
56805 Points +52%
AMD Ryzen 9 7950X
NVIDIA GeForce RTX 4090
51741 Points +38%
Intel Core i7-13700K
NVIDIA GeForce RTX 4090
51443 Points +37%
AMD Ryzen 9 7950X3D
NVIDIA GeForce RTX 4090
50990 Points +36%
Intel Core i7-13700
NVIDIA GeForce RTX 4090
50107 Points +34%
Intel Core i5-14600K
NVIDIA GeForce RTX 4090
49203 Points +31%
Intel Core Ultra 9 285K
NVIDIA GeForce RTX 4090
44723 Points +19%
Intel Core i7-12700
NVIDIA GeForce RTX 4090
40758 Points +9%
Intel Core Ultra 5 245K
NVIDIA GeForce RTX 4090
40122 Points +7%
Intel Core Ultra 5 235
NVIDIA GeForce RTX 4090
37480 Points
Intel Core i5-13400
NVIDIA GeForce RTX 4090
35207 Points -6%
Intel Core Ultra 5 225F
NVIDIA GeForce RTX 4090
34664 Points -8%
1920x1080 1080p High
Intel Core i9-14900K
NVIDIA GeForce RTX 4090
50399 Points +47%
AMD Ryzen 5 9600X
NVIDIA GeForce RTX 4090
50230 Points +47%
AMD Ryzen 7 7800X3D
NVIDIA GeForce RTX 4090
49328 Points +44%
AMD Ryzen 9 7950X
NVIDIA GeForce RTX 4090
46814 Points +37%
Intel Core i7-13700K
NVIDIA GeForce RTX 4090
46385 Points +35%
AMD Ryzen 9 7950X3D
NVIDIA GeForce RTX 4090
46052 Points +34%
Intel Core i7-13700
NVIDIA GeForce RTX 4090
45368 Points +32%
Intel Core i5-14600K
NVIDIA GeForce RTX 4090
45162 Points +32%
Intel Core Ultra 9 285K
NVIDIA GeForce RTX 4090
41496 Points +21%
Intel Core i7-12700
NVIDIA GeForce RTX 4090
37819 Points +10%
Intel Core Ultra 5 245K
NVIDIA GeForce RTX 4090
36786 Points +7%
Intel Core Ultra 5 235
NVIDIA GeForce RTX 4090
34275 Points
Intel Core i5-13400
NVIDIA GeForce RTX 4090
32711 Points -5%
Intel Core Ultra 5 225F
NVIDIA GeForce RTX 4090
32007 Points -7%
1920x1080 1080p Extreme
AMD Ryzen 7 7800X3D
NVIDIA GeForce RTX 4090
22618 Points +1%
Intel Core Ultra 9 285K
NVIDIA GeForce RTX 4090
22319 Points 0%
Intel Core Ultra 5 235
NVIDIA GeForce RTX 4090
22317 Points
Intel Core Ultra 5 225F
NVIDIA GeForce RTX 4090
22284 Points 0%
Intel Core i5-14600K
NVIDIA GeForce RTX 4090
21954 Points -2%
Intel Core i9-14900K
NVIDIA GeForce RTX 4090
21920 Points -2%
AMD Ryzen 9 7950X3D
NVIDIA GeForce RTX 4090
21913 Points -2%
AMD Ryzen 9 7950X
NVIDIA GeForce RTX 4090
21824 Points -2%
Intel Core i7-13700
NVIDIA GeForce RTX 4090
21808 Points -2%
Intel Core i7-13700K
NVIDIA GeForce RTX 4090
21744 Points -3%
Intel Core Ultra 5 245K
NVIDIA GeForce RTX 4090
21706 Points -3%
Intel Core i5-13400
NVIDIA GeForce RTX 4090
21646 Points -3%
Intel Core i7-12700
NVIDIA GeForce RTX 4090
21615 Points -3%
AMD Ryzen 5 9600X
NVIDIA GeForce RTX 4090
21586 Points -3%
3840x2160 4k Optimized
AMD Ryzen 9 7950X
NVIDIA GeForce RTX 4090
33943 Points +8%
Intel Core i9-14900K
NVIDIA GeForce RTX 4090
33885 Points +7%
AMD Ryzen 9 7950X3D
NVIDIA GeForce RTX 4090
33883 Points +7%
Intel Core i7-13700
NVIDIA GeForce RTX 4090
33765 Points +7%
Intel Core i7-13700K
NVIDIA GeForce RTX 4090
33719 Points +7%
Intel Core i5-14600K
NVIDIA GeForce RTX 4090
33700 Points +7%
AMD Ryzen 7 7800X3D
NVIDIA GeForce RTX 4090
33601 Points +7%
AMD Ryzen 5 9600X
NVIDIA GeForce RTX 4090
33095 Points +5%
Intel Core Ultra 9 285K
NVIDIA GeForce RTX 4090
33051 Points +5%
Intel Core i7-12700
NVIDIA GeForce RTX 4090
32608 Points +3%
Intel Core Ultra 5 245K
NVIDIA GeForce RTX 4090
32169 Points +2%
Intel Core Ultra 5 235
NVIDIA GeForce RTX 4090
31533 Points
Intel Core i5-13400
NVIDIA GeForce RTX 4090
30877 Points -2%
Intel Core Ultra 5 225F
NVIDIA GeForce RTX 4090
30495 Points -3%
7680x4320 8k Optimized
AMD Ryzen 9 7950X3D
NVIDIA GeForce RTX 4090
13105 Points +3%
AMD Ryzen 9 7950X
NVIDIA GeForce RTX 4090
13082 Points +3%
Intel Core i7-13700
NVIDIA GeForce RTX 4090
13081 Points +3%
Intel Core i7-13700K
NVIDIA GeForce RTX 4090
13078 Points +3%
Intel Core i7-12700
NVIDIA GeForce RTX 4090
13070 Points +3%
Intel Core i5-13400
NVIDIA GeForce RTX 4090
13011 Points +3%
Intel Core i9-14900K
NVIDIA GeForce RTX 4090
12845 Points +1%
Intel Core i5-14600K
NVIDIA GeForce RTX 4090
12791 Points +1%
AMD Ryzen 7 7800X3D
NVIDIA GeForce RTX 4090
12770 Points +1%
Intel Core Ultra 5 245K
NVIDIA GeForce RTX 4090
12714 Points 0%
Intel Core Ultra 9 285K
NVIDIA GeForce RTX 4090
12705 Points 0%
Intel Core Ultra 5 225F
NVIDIA GeForce RTX 4090
12674 Points 0%
Intel Core Ultra 5 235
NVIDIA GeForce RTX 4090
12666 Points
AMD Ryzen 5 9600X
NVIDIA GeForce RTX 4090
12498 Points -1%
Unigine Valley 1.0
1920x1080 Extreme HD DirectX AA:x8
AMD Ryzen 5 9600X
NVIDIA GeForce RTX 4090
324 fps +48%
Intel Core i9-14900K
NVIDIA GeForce RTX 4090
305.2 fps +39%
Intel Core i5-14600K
NVIDIA GeForce RTX 4090
283.4 fps +29%
AMD Ryzen 9 7950X3D
NVIDIA GeForce RTX 4090
277.2 fps +26%
Intel Core i7-13700K
NVIDIA GeForce RTX 4090
273.9 fps +25%
AMD Ryzen 9 7950X
NVIDIA GeForce RTX 4090
270.7 fps +23%
Intel Core i7-13700
NVIDIA GeForce RTX 4090
266.6 fps +21%
Intel Core Ultra 9 285K
NVIDIA GeForce RTX 4090
264 fps +20%
AMD Ryzen 7 7800X3D
NVIDIA GeForce RTX 4090
246.7 fps +12%
Intel Core Ultra 5 245K
NVIDIA GeForce RTX 4090
246.6 fps +12%
Intel Core i7-12700
NVIDIA GeForce RTX 4090
238.4 fps +9%
Intel Core i5-13400
NVIDIA GeForce RTX 4090
226.2 fps +3%
Intel Core Ultra 5 225F
NVIDIA GeForce RTX 4090
226.2 fps +3%
Intel Core Ultra 5 235
NVIDIA GeForce RTX 4090
219.5 fps
1920x1080 Extreme HD Preset OpenGL AA:x8
AMD Ryzen 5 9600X
NVIDIA GeForce RTX 4090
331.8 fps +44%
Intel Core i9-14900K
NVIDIA GeForce RTX 4090
322.2 fps +39%
Intel Core i7-13700K
NVIDIA GeForce RTX 4090
305.7 fps +32%
Intel Core i5-14600K
NVIDIA GeForce RTX 4090
303.2 fps +31%
AMD Ryzen 9 7950X3D
NVIDIA GeForce RTX 4090
295.4 fps +28%
Intel Core i7-13700
NVIDIA GeForce RTX 4090
293.1 fps +27%
AMD Ryzen 9 7950X
NVIDIA GeForce RTX 4090
288 fps +25%
Intel Core Ultra 9 285K
NVIDIA GeForce RTX 4090
278.9 fps +21%
AMD Ryzen 7 7800X3D
NVIDIA GeForce RTX 4090
260.9 fps +13%
Intel Core Ultra 5 245K
NVIDIA GeForce RTX 4090
259.8 fps +12%
Intel Core i7-12700
NVIDIA GeForce RTX 4090
258.5 fps +12%
Intel Core i5-13400
NVIDIA GeForce RTX 4090
242.8 fps +5%
Intel Core Ultra 5 225F
NVIDIA GeForce RTX 4090
237.7 fps +3%
Intel Core Ultra 5 235
NVIDIA GeForce RTX 4090
231 fps
Unigine Heaven 4.0
Extreme Preset OpenGL
AMD Ryzen 5 9600X
NVIDIA GeForce RTX 4090
472.4 fps +13%
Intel Core i9-14900K
NVIDIA GeForce RTX 4090
465.1 fps +11%
AMD Ryzen 9 7950X3D
NVIDIA GeForce RTX 4090
458.2 fps +9%
Intel Core i7-13700K
NVIDIA GeForce RTX 4090
456.9 fps +9%
Intel Core i5-14600K
NVIDIA GeForce RTX 4090
456.3 fps +9%
AMD Ryzen 9 7950X
NVIDIA GeForce RTX 4090
450.4 fps +7%
Intel Core i7-13700
NVIDIA GeForce RTX 4090
450.4 fps +7%
Intel Core Ultra 9 285K
NVIDIA GeForce RTX 4090
447.7 fps +7%
AMD Ryzen 7 7800X3D
NVIDIA GeForce RTX 4090
442.4 fps +5%
Intel Core i7-12700
NVIDIA GeForce RTX 4090
433.8 fps +3%
Intel Core Ultra 5 245K
NVIDIA GeForce RTX 4090
433.8 fps +3%
Intel Core i5-13400
NVIDIA GeForce RTX 4090
420 fps 0%
Intel Core Ultra 5 235
NVIDIA GeForce RTX 4090
419.5 fps
Intel Core Ultra 5 225F
NVIDIA GeForce RTX 4090
408.7 fps -3%
Extreme Preset DX11
AMD Ryzen 9 7950X3D
NVIDIA GeForce RTX 4090
492.5 fps +18%
AMD Ryzen 9 7950X
NVIDIA GeForce RTX 4090
491.5 fps +18%
Intel Core i9-14900K
NVIDIA GeForce RTX 4090
483.7 fps +16%
AMD Ryzen 5 9600X
NVIDIA GeForce RTX 4090
473.9 fps +14%
Intel Core i7-13700K
NVIDIA GeForce RTX 4090
473.8 fps +14%
Intel Core i5-14600K
NVIDIA GeForce RTX 4090
473 fps +14%
AMD Ryzen 7 7800X3D
NVIDIA GeForce RTX 4090
463.8 fps +12%
Intel Core i7-13700
NVIDIA GeForce RTX 4090
462.5 fps +11%
Intel Core Ultra 9 285K
NVIDIA GeForce RTX 4090
462.4 fps +11%
Intel Core Ultra 5 245K
NVIDIA GeForce RTX 4090
440.5 fps +6%
Intel Core i7-12700
NVIDIA GeForce RTX 4090
435.2 fps +5%
Intel Core i5-13400
NVIDIA GeForce RTX 4090
416.6 fps 0%
Intel Core Ultra 5 235
NVIDIA GeForce RTX 4090
415.8 fps
Intel Core Ultra 5 225F
NVIDIA GeForce RTX 4090
409.4 fps -2%
ComputeMark v2.1
1024x600 Normal, Score
Intel Core i5-14600K
NVIDIA GeForce RTX 4090
92397 Points +1%
AMD Ryzen 5 9600X
NVIDIA GeForce RTX 4090
92222 Points +1%
AMD Ryzen 9 7950X
NVIDIA GeForce RTX 4090
92171 Points +1%
Intel Core i9-14900K
NVIDIA GeForce RTX 4090
92026 Points +1%
Intel Core i7-13700K
NVIDIA GeForce RTX 4090
92009 Points +1%
AMD Ryzen 9 7950X3D
NVIDIA GeForce RTX 4090
91838 Points +1%
Intel Core i7-12700
NVIDIA GeForce RTX 4090
91703 Points +1%
AMD Ryzen 7 7800X3D
NVIDIA GeForce RTX 4090
91665 Points +1%
Intel Core i5-13400
NVIDIA GeForce RTX 4090
91659 Points +1%
Intel Core i7-13700
NVIDIA GeForce RTX 4090
91616 Points +1%
Intel Core Ultra 5 235
NVIDIA GeForce RTX 4090
91112 Points
Intel Core Ultra 5 225F
NVIDIA GeForce RTX 4090
90991 Points 0%
Intel Core Ultra 9 285K
NVIDIA GeForce RTX 4090
90932 Points 0%
Intel Core Ultra 5 245K
NVIDIA GeForce RTX 4090
90595 Points -1%
1024x600 Normal, Fluid 3DTex
AMD Ryzen 7 7800X3D
NVIDIA GeForce RTX 4090
10875 Points +3%
Intel Core i7-13700K
NVIDIA GeForce RTX 4090
10805 Points +3%
Intel Core i5-14600K
NVIDIA GeForce RTX 4090
10797 Points +3%
AMD Ryzen 9 7950X3D
NVIDIA GeForce RTX 4090
10778 Points +2%
Intel Core i7-13700
NVIDIA GeForce RTX 4090
10759 Points +2%
Intel Core i5-13400
NVIDIA GeForce RTX 4090
10756 Points +2%
AMD Ryzen 5 9600X
NVIDIA GeForce RTX 4090
10756 Points +2%
Intel Core i7-12700
NVIDIA GeForce RTX 4090
10749 Points +2%
AMD Ryzen 9 7950X
NVIDIA GeForce RTX 4090
10724 Points +2%
Intel Core i9-14900K
NVIDIA GeForce RTX 4090
10715 Points +2%
Intel Core Ultra 5 225F
NVIDIA GeForce RTX 4090
10620 Points +1%
Intel Core Ultra 9 285K
NVIDIA GeForce RTX 4090
10584 Points +1%
Intel Core Ultra 5 235
NVIDIA GeForce RTX 4090
10530 Points
Intel Core Ultra 5 245K
NVIDIA GeForce RTX 4090
10396 Points -1%
1024x600 Normal, Fluid 2DTexArr
AMD Ryzen 5 9600X
NVIDIA GeForce RTX 4090
6948 Points +1%
Intel Core i9-14900K
NVIDIA GeForce RTX 4090
6940 Points +1%
Intel Core i5-14600K
NVIDIA GeForce RTX 4090
6920 Points 0%
Intel Core i7-13700K
NVIDIA GeForce RTX 4090
6914 Points 0%
Intel Core Ultra 9 285K
NVIDIA GeForce RTX 4090
6895 Points 0%
Intel Core Ultra 5 245K
NVIDIA GeForce RTX 4090
6892 Points 0%
Intel Core Ultra 5 235
NVIDIA GeForce RTX 4090
6892 Points
AMD Ryzen 9 7950X
NVIDIA GeForce RTX 4090
6891 Points 0%
Intel Core i7-12700
NVIDIA GeForce RTX 4090
6891 Points 0%
Intel Core i7-13700
NVIDIA GeForce RTX 4090
6891 Points 0%
AMD Ryzen 9 7950X3D
NVIDIA GeForce RTX 4090
6887 Points 0%
AMD Ryzen 7 7800X3D
NVIDIA GeForce RTX 4090
6887 Points 0%
Intel Core Ultra 5 225F
NVIDIA GeForce RTX 4090
6887 Points 0%
Intel Core i5-13400
NVIDIA GeForce RTX 4090
6879 Points 0%
1024x600 Normal, Mandel Vector
Intel Core i5-14600K
NVIDIA GeForce RTX 4090
17355 Points +1%
AMD Ryzen 9 7950X
NVIDIA GeForce RTX 4090
17336 Points +1%
AMD Ryzen 5 9600X
NVIDIA GeForce RTX 4090
17307 Points +1%
Intel Core i9-14900K
NVIDIA GeForce RTX 4090
17302 Points +1%
AMD Ryzen 9 7950X3D
NVIDIA GeForce RTX 4090
17301 Points +1%
Intel Core i7-13700K
NVIDIA GeForce RTX 4090
17250 Points +1%
Intel Core Ultra 9 285K
NVIDIA GeForce RTX 4090
17212 Points +1%
Intel Core i7-13700
NVIDIA GeForce RTX 4090
17207 Points +1%
Intel Core i7-12700
NVIDIA GeForce RTX 4090
17196 Points +1%
AMD Ryzen 7 7800X3D
NVIDIA GeForce RTX 4090
17156 Points 0%
Intel Core i5-13400
NVIDIA GeForce RTX 4090
17154 Points 0%
Intel Core Ultra 5 235
NVIDIA GeForce RTX 4090
17099 Points
Intel Core Ultra 5 245K
NVIDIA GeForce RTX 4090
17075 Points 0%
Intel Core Ultra 5 225F
NVIDIA GeForce RTX 4090
17071 Points 0%
1024x600 Normal, Mandel Scalar
Intel Core i5-14600K
NVIDIA GeForce RTX 4090
22992 Points +1%
Intel Core i9-14900K
NVIDIA GeForce RTX 4090
22976 Points +1%
AMD Ryzen 7 7800X3D
NVIDIA GeForce RTX 4090
22926 Points +1%
AMD Ryzen 9 7950X
NVIDIA GeForce RTX 4090
22889 Points 0%
Intel Core i7-13700K
NVIDIA GeForce RTX 4090
22862 Points 0%
AMD Ryzen 5 9600X
NVIDIA GeForce RTX 4090
22843 Points 0%
Intel Core i7-12700
NVIDIA GeForce RTX 4090
22834 Points 0%
AMD Ryzen 9 7950X3D
NVIDIA GeForce RTX 4090
22834 Points 0%
Intel Core i7-13700
NVIDIA GeForce RTX 4090
22825 Points 0%
Intel Core i5-13400
NVIDIA GeForce RTX 4090
22813 Points 0%
Intel Core Ultra 5 235
NVIDIA GeForce RTX 4090
22806 Points
Intel Core Ultra 5 225F
NVIDIA GeForce RTX 4090
22711 Points 0%
Intel Core Ultra 5 245K
NVIDIA GeForce RTX 4090
22542 Points -1%
Intel Core Ultra 9 285K
NVIDIA GeForce RTX 4090
22528 Points -1%
1024x600 Normal, QJuliaRayTrace
AMD Ryzen 5 9600X
NVIDIA GeForce RTX 4090
34367 Points +2%
Intel Core i5-14600K
NVIDIA GeForce RTX 4090
34333 Points +2%
AMD Ryzen 9 7950X
NVIDIA GeForce RTX 4090
34332 Points +2%
Intel Core i7-13700K
NVIDIA GeForce RTX 4090
34178 Points +1%
Intel Core i9-14900K
NVIDIA GeForce RTX 4090
34092 Points +1%
Intel Core i5-13400
NVIDIA GeForce RTX 4090
34057 Points +1%
AMD Ryzen 9 7950X3D
NVIDIA GeForce RTX 4090
34038 Points +1%
Intel Core i7-12700
NVIDIA GeForce RTX 4090
34033 Points +1%
Intel Core i7-13700
NVIDIA GeForce RTX 4090
33935 Points 0%
AMD Ryzen 7 7800X3D
NVIDIA GeForce RTX 4090
33822 Points 0%
Intel Core Ultra 5 235
NVIDIA GeForce RTX 4090
33784 Points
Intel Core Ultra 5 245K
NVIDIA GeForce RTX 4090
33724 Points 0%
Intel Core Ultra 9 285K
NVIDIA GeForce RTX 4090
33713 Points 0%
Intel Core Ultra 5 225F
NVIDIA GeForce RTX 4090
33702 Points 0%

Производительность NPU

Процессоры Intel Core Ultra 5 235 и Core Ultra 5 225F оснащены встроенным блоком нейронной обработки (NPU), который специально разработан для приложений искусственного интеллекта. Этот NPU совпадает с вариантом, который уже используется в процессорах Meteor Lake для мобильных устройств, и обеспечивает вычислительную мощность до 13 TOPS. Несмотря на схожую архитектуру, настольные модели достигают лучших результатов благодаря более высокому запасу производительности. С другой стороны, по сравнению с современными видеокартами NPU по-прежнему значительно уступают. Роль, которую они будут играть в повседневной жизни в будущем, станет ясна с ростом программной поддержки.

UL Procyon for Windows / Overall Score Integer NPU
Intel Core Ultra 5 235
Intel Core Ultra 5 235, NVIDIA GeForce RTX 4090
730 Points
Intel Core Ultra 5 225F
Intel Core Ultra 5 225F, NVIDIA GeForce RTX 4090
718 Points -2%
Intel Core Ultra 5 245K
Intel Core Ultra 5 245K, NVIDIA GeForce RTX 4090
672 Points -8%
Intel Core Ultra 9 285K
Intel Core Ultra 9 285K, NVIDIA GeForce RTX 4090
672 Points -8%
Intel Core Ultra 9 185H
Intel Core Ultra 9 185H, Arc 8-Core
529 Points -28%
Intel Core Ultra 5 125H
Intel Core Ultra 5 125H, Arc 7-Core
508 Points -30%
Intel Core Ultra 7 155H
Intel Core Ultra 7 155H, Arc 8-Core
504 Points -31%

Игры

К сожалению, производительность Intel Core Ultra 5 235 и Intel Core Ultra 5 225F, которую мы наблюдали в бенчмарках процессоров, не удалось полностью перенести в игровую сферу. На предельной частоте процессора в играх, которые мы тестировали, оба процессора показали такую же слабую производительность, как Intel Core Ultra 5 245K или Intel Core Ultra 9 285K. Во втором сценарии, при 2 160p с максимальной детализацией (то есть на пределе возможностей GPU), производительность процессоров приблизилась друг к другу. Заметной разницы в производительности при использовании Intel Core Ultra 5 235 или Intel Core Ultra 5 225F быть не должно.

Производительность ограничивается процессором

Performance Rating - Percent
AMD Ryzen 7 9800X3D
98.7 pt
AMD Ryzen 9 7950X3D
87.5 pt
Intel Core i9-14900K
86.8 pt
AMD Ryzen 5 9600X
83.5 pt
AMD Ryzen 9 7950X
81.9 pt
AMD Ryzen 5 7600X
80.4 pt
Intel Core i9-13900K
80.2 pt
Intel Core i5-14600K
76.1 pt
Intel Core i7-13700K
74.3 pt
Intel Core i7-13700
73.6 pt
Intel Core Ultra 9 285K
70.4 pt
Intel Core Ultra 5 235
63.9 pt
Intel Core Ultra 5 245K
63.6 pt
Intel Core i7-12700
63.2 pt
Intel Core Ultra 5 225F
61.3 pt
Intel Core i5-13400
55.3 pt
Intel Core i5-12400F
54.2 pt
F1 22 - 1920x1080 Low Preset AA:T AF:16x
AMD Ryzen 7 9800X3D
551 (407min, 317P1 - 630max) fps +68%
AMD Ryzen 9 7950X3D
475 (338min, 264P1 - 542max) fps +45%
Intel Core i9-14900K
462 (309min, 256P1 - 558max) fps +41%
AMD Ryzen 9 7950X
443 (278min, 245P1 - 521max) fps +35%
AMD Ryzen 5 9600X
439 (256min, 238P1 - 510max) fps +34%
AMD Ryzen 5 7600X
417 (281min, 236P1 - 488max) fps +27%
Intel Core i9-13900K
401 (265min, 222P1 - 463max) fps +22%
Intel Core i7-13700K
380 (280min, 217P1 - 437max) fps +16%
Intel Core i5-14600K
379 (280min, 225P1 - 455max) fps +16%
Intel Core i7-13700
378 (244min, 212P1 - 430max) fps +15%
Intel Core Ultra 9 285K
354 (237min, 199P1 - 414max) fps +8%
Intel Core Ultra 5 235
328 (239min, 192P1 - 377max) fps
Intel Core i7-12700
313 (235min, 185P1 - 364max) fps -5%
Intel Core Ultra 5 245K
311 (242min, 180P1 - 346max) fps -5%
Intel Core Ultra 5 225F
292 (223min, 179P1 - 340max) fps -11%
Intel Core i5-12400F
271 (200min, 165P1 - 305max) fps -17%
Intel Core i5-13400
249 (197min, 152P1 - 284max) fps -24%
Far Cry 5 - 1280x720 Low Preset AA:T
AMD Ryzen 7 9800X3D
375 (233min - 492max) fps +79%
AMD Ryzen 9 7950X3D
299 (201min - 390max) fps +43%
Intel Core i9-14900K
280 (214min - 355max) fps +34%
Intel Core i9-13900K
270 (203min - 349max) fps +29%
AMD Ryzen 5 9600X
263 (201min - 342max) fps +26%
Intel Core i5-14600K
255 (199min - 343max) fps +22%
Intel Core i7-13700K
242 (183min - 317max) fps +16%
AMD Ryzen 5 7600X
241 (180min - 334max) fps +15%
AMD Ryzen 9 7950X
238 (182min - 313max) fps +14%
Intel Core i7-13700
232 (161min - 306max) fps +11%
Intel Core Ultra 9 285K
213 (169min - 274max) fps +2%
Intel Core Ultra 5 235
209 (161min - 274max) fps
Intel Core i7-12700
204 (156min - 270max) fps -2%
Intel Core Ultra 5 245K
204 (149min - 271max) fps -2%
Intel Core Ultra 5 225F
198 (146min - 267max) fps -5%
Intel Core i5-13400
185 (144min - 241max) fps -11%
Intel Core i5-12400F
173 (124min - 232max) fps -17%
X-Plane 11.11 - 1280x720 low (fps_test=1)
Intel Core i9-13900K
245 fps +118%
AMD Ryzen 5 9600X
245 fps +118%
Intel Core i9-14900K
244 fps +117%
Intel Core i5-14600K
228 fps +103%
AMD Ryzen 9 7950X3D
225 fps +101%
Intel Core i7-13700K
224 fps +100%
AMD Ryzen 9 7950X
223 fps +99%
Intel Core i7-13700
218 fps +94%
AMD Ryzen 5 7600X
217 fps +93%
AMD Ryzen 7 9800X3D
199.4 fps +78%
Intel Core i7-12700
181.4 fps +62%
Intel Core i5-13400
155.7 fps +39%
Intel Core Ultra 9 285K
143.4 fps +28%
Intel Core Ultra 5 245K
129.1 fps +15%
Intel Core Ultra 5 225F
113.1 fps +1%
Intel Core i5-12400F
113 fps +1%
Intel Core Ultra 5 235
112.2 fps
Final Fantasy XV Benchmark - 1280x720 Lite Quality
AMD Ryzen 5 9600X
237 fps +1%
Intel Core i9-13900K
236 fps 0%
AMD Ryzen 9 7950X
236 fps 0%
AMD Ryzen 5 7600X
236 fps 0%
Intel Core i7-13700
236 fps 0%
Intel Core i7-13700K
236 fps 0%
Intel Core i5-14600K
236 fps 0%
Intel Core Ultra 9 285K
236 fps 0%
Intel Core i9-14900K
235 fps 0%
Intel Core Ultra 5 245K
235 fps 0%
AMD Ryzen 7 9800X3D
235 fps 0%
Intel Core Ultra 5 235
235 fps
AMD Ryzen 9 7950X3D
234 fps 0%
Intel Core i7-12700
232 fps -1%
Intel Core Ultra 5 225F
232 fps -1%
Intel Core i5-12400F
217 fps -8%
Intel Core i5-13400
217 fps -8%
Dota 2 Reborn - 1280x720 min (0/3) fastest
AMD Ryzen 7 9800X3D
368.7 (303min) fps +72%
AMD Ryzen 9 7950X3D
314.1 (261.7min) fps +47%
AMD Ryzen 9 7950X
310.6 (261.3min) fps +45%
Intel Core i9-14900K
299.9 (248.4min) fps +40%
Intel Core i9-13900K
294 (254.9min) fps +37%
AMD Ryzen 5 9600X
291 (244.2min) fps +36%
AMD Ryzen 5 7600X
278.1 (211.4min) fps +30%
Intel Core i5-14600K
261.5 (226.3min) fps +22%
Intel Core Ultra 9 285K
252.4 (219.5min) fps +18%
Intel Core i7-13700K
251.2 (215.9min) fps +17%
Intel Core i7-13700
245 (213.8min) fps +14%
Intel Core Ultra 5 235
214 (189.8min) fps
Intel Core Ultra 5 245K
213.7 (189.8min) fps 0%
Intel Core i7-12700
202.4 (178min) fps -5%
Intel Core Ultra 5 225F
201 (173.4min) fps -6%
Intel Core i5-12400F
182.1 (159.5min) fps -15%
Intel Core i5-13400
182.1 (160.5min) fps -15%
The Witcher 3 - 1024x768 Low Graphics & Postprocessing
AMD Ryzen 7 9800X3D
882 (30.2min, 308P0.1, 642P1 - 1554max) fps +67%
AMD Ryzen 9 7950X3D
864.7 fps +64%
Intel Core i9-14900K
829 (31.9min, 380P0.1, 595P1 - 1296max) fps +57%
AMD Ryzen 9 7950X
826 (23.6min, 360P0.1, 574P1 - 1357max) fps +56%
Intel Core i9-13900K
794 (25.1min, 361P0.1, 581P1 - 1267max) fps +50%
AMD Ryzen 5 9600X
762 (66min, 266P0.1, 520P1 - 1355max) fps +44%
AMD Ryzen 5 7600X
738 fps +40%
Intel Core i7-13700K
687.5 fps +30%
Intel Core i7-13700
670.4 fps +27%
Intel Core Ultra 9 285K
663 (87.9min, 319P0.1, 454P1 - 1115max) fps +26%
Intel Core i5-14600K
632 (29.4min, 209P0.1, 471P1 - 1028max) fps +20%
Intel Core Ultra 5 245K
536 (23.7min, 212P0.1, 371P1 - 944max) fps +2%
Intel Core Ultra 5 235
528 (61.6min, 157.1P0.1, 375P1 - 1614max) fps
Intel Core i7-12700
522 fps -1%
Intel Core Ultra 5 225F
481 (91.1min, 223P0.1, 323P1 - 944max) fps -9%
Intel Core i5-13400
451.7 fps -14%
Intel Core i5-12400F
414 fps -22%
GTA V - 1024x768 Lowest Settings possible
AMD Ryzen 9 7950X
188.2 (5.44min, 200P1 - 724max) fps 0%
AMD Ryzen 5 9600X
188.1 (3min, 200P1 - 713max) fps 0%
AMD Ryzen 9 7950X3D
188 (3.25min, 200P1 - 705max) fps 0%
AMD Ryzen 5 7600X
187.9 (7.22min, 200P1 - 815max) fps 0%
Intel Core i9-14900K
187.9 (3.8min, 200P1 - 705max) fps 0%
Intel Core i9-13900K
187.8 (2.26min, 200P1 - 688max) fps 0%
AMD Ryzen 7 9800X3D
187.8 (4.04min, 200P1 - 669max) fps 0%
Intel Core Ultra 5 235
187.8 (2.63min, 166.7P1 - 488max) fps
Intel Core i7-13700
187.7 (5.01min, 200P1 - 613max) fps 0%
Intel Core i5-14600K
187.7 (4.67min, 200P1 - 640max) fps 0%
Intel Core Ultra 5 245K
187.7 (4.11min, 200P1 - 547max) fps 0%
Intel Core Ultra 9 285K
187.7 (4.29min, 200P1 - 567max) fps 0%
Intel Core i7-13700K
187.6 (3.74min, 200P1 - 607max) fps 0%
Intel Core Ultra 5 225F
187.3 (1.439min, 166.7P1 - 479max) fps 0%
Intel Core i7-12700
187.1 (2.4min, 200P1 - 499max) fps 0%
Intel Core i5-13400
186.8 (1.87min, 166.7P1 - 445max) fps -1%
Intel Core i5-12400F
186.4 (2.09min, 166.7P1 - 413max) fps -1%
Borderlands 3 - 1280x720 Very Low Overall Quality (DX11)
AMD Ryzen 7 9800X3D
325 fps +79%
AMD Ryzen 9 7950X3D
308 fps +70%
Intel Core i9-14900K
263 fps +45%
Intel Core i9-13900K
243 fps +34%
AMD Ryzen 9 7950X
242 fps +33%
Intel Core i5-14600K
237 fps +30%
AMD Ryzen 5 7600X
228 fps +25%
AMD Ryzen 5 9600X
228 fps +25%
Intel Core i7-13700
222 fps +22%
Intel Core i7-13700K
222 fps +22%
Intel Core Ultra 9 285K
196.6 fps +8%
Intel Core i7-12700
185.6 fps +2%
Intel Core Ultra 5 235
181.7 fps
Intel Core Ultra 5 225F
173 fps -5%
Intel Core Ultra 5 245K
172.1 fps -5%
Intel Core i5-13400
169 fps -7%
Intel Core i5-12400F
155 fps -15%
Far Cry New Dawn - 1280x720 Low Preset
AMD Ryzen 7 9800X3D
332 (222min - 481max) fps +89%
AMD Ryzen 9 7950X3D
255 (145min - 381max) fps +45%
Intel Core i9-14900K
235 (156min - 353max) fps +34%
AMD Ryzen 5 9600X
226 (163min - 362max) fps +28%
Intel Core i9-13900K
222 (150min - 335max) fps +26%
Intel Core i5-14600K
216 (168min - 312max) fps +23%
Intel Core i7-13700
203 (144min - 297max) fps +15%
Intel Core i7-13700K
203 (157min - 304max) fps +15%
AMD Ryzen 9 7950X
200 (140min - 302max) fps +14%
AMD Ryzen 5 7600X
199 (140min - 316max) fps +13%
Intel Core Ultra 9 285K
184 (140min - 275max) fps +5%
Intel Core Ultra 5 235
176 (124min - 260max) fps
Intel Core i7-12700
174 (103min - 253max) fps -1%
Intel Core Ultra 5 225F
168 (123min - 244max) fps -5%
Intel Core Ultra 5 245K
163 (122min - 246max) fps -7%
Intel Core i5-13400
159 (110min - 233max) fps -10%
Intel Core i5-12400F
147 (102min - 216max) fps -16%
Shadow of the Tomb Raider - 1280x720 Lowest Preset
AMD Ryzen 7 9800X3D
409 fps +69%
AMD Ryzen 9 7950X3D
383 fps +58%
AMD Ryzen 9 7950X
332 fps +37%
Intel Core i9-14900K
332 fps +37%
AMD Ryzen 5 7600X
321 fps +33%
Intel Core i9-13900K
320 fps +32%
AMD Ryzen 5 9600X
319 fps +32%
Intel Core i5-14600K
281 fps +16%
Intel Core i7-13700
272 fps +12%
Intel Core i7-13700K
272 fps +12%
Intel Core Ultra 9 285K
263 fps +9%
Intel Core Ultra 5 245K
246 fps +2%
Intel Core Ultra 5 235
242 fps
Intel Core Ultra 5 225F
235 fps -3%
Intel Core i7-12700
231 fps -5%
Intel Core i5-13400
204 fps -16%
Intel Core i5-12400F
196.4 fps -19%
Tiny Tina's Wonderlands - 1920x1080 Low Preset (DX12)
AMD Ryzen 7 9800X3D
578 fps +64%
Intel Core i9-14900K
502 fps +43%
AMD Ryzen 9 7950X3D
477 fps +36%
Intel Core i5-14600K
429 fps +22%
AMD Ryzen 9 7950X
428 fps +22%
AMD Ryzen 5 7600X
415 fps +18%
AMD Ryzen 5 9600X
411 fps +17%
Intel Core Ultra 9 285K
403 fps +14%
Intel Core i9-13900K
398 fps +13%
Intel Core i7-13700
378 fps +7%
Intel Core i7-13700K
371 fps +5%
Intel Core Ultra 5 245K
363 fps +3%
Intel Core Ultra 5 235
352 fps
Intel Core Ultra 5 225F
342 fps -3%
Intel Core i7-12700
303 fps -14%
Intel Core i5-13400
275 fps -22%
Intel Core i5-12400F
258 fps -27%
Strange Brigade - 1280x720 lowest AF:1
AMD Ryzen 5 7600X
780 (275min, 597P1 - 1128max) fps +23%
AMD Ryzen 7 9800X3D
776 (169.6min, 623P1 - 1082max) fps +22%
Intel Core i9-14900K
762 (261min, 605P1 - 1027max) fps +20%
AMD Ryzen 5 9600X
735 (154.9min, 595P1 - 998max) fps +16%
Intel Core i5-14600K
717 (186min, 554P1 - 1036max) fps +13%
AMD Ryzen 9 7950X
698 (182.7min, 569P1 - 937max) fps +10%
Intel Core i9-13900K
691 (60.2min, 543P1 - 929max) fps +9%
Intel Core Ultra 9 285K
681 (43.7min, 531P1 - 898max) fps +7%
AMD Ryzen 9 7950X3D
672 (259min, 529P1 - 894max) fps +6%
Intel Core Ultra 5 245K
661 (248min, 487P1 - 949max) fps +4%
Intel Core i7-13700K
646 (277min, 510P1 - 858max) fps +2%
Intel Core Ultra 5 235
636 (242min, 474P1 - 912max) fps
Intel Core i7-13700
626 (284min, 497P1 - 830max) fps -2%
Intel Core Ultra 5 225F
594 (164.9min, 442P1 - 898max) fps -7%
Intel Core i7-12700
523 (243min, 410P1 - 698max) fps -18%
Intel Core i5-12400F
444 (33.1min, 345P1 - 648max) fps -30%
Intel Core i5-13400
408 (153.5min, 319P1 - 565max) fps -36%
Metro Exodus - 1280x720 Low Quality AF:4x
AMD Ryzen 7 9800X3D
433 (234.19min - 674.31max) fps +70%
AMD Ryzen 5 9600X
349 (182.25min - 551.57max) fps +37%
Intel Core i9-14900K
319 (166.53min - 527.7max) fps +26%
AMD Ryzen 5 7600X
309 (157.23min - 500.25max) fps +22%
AMD Ryzen 9 7950X
300 (162.95min - 476.42max) fps +18%
Intel Core i5-14600K
296 (170.68min - 455.17max) fps +17%
AMD Ryzen 9 7950X3D
293 (157.18min - 462.11max) fps +15%
Intel Core Ultra 9 285K
276 (133.01min - 479.85max) fps +9%
Intel Core i7-13700
268 (127.73min - 445.04max) fps +6%
Intel Core i9-13900K
261 (116.81min - 454.13max) fps +3%
Intel Core i7-13700K
261 (117.16min - 442.09max) fps +3%
Intel Core Ultra 5 225F
257 (140.75min - 409.33max) fps +1%
Intel Core Ultra 5 245K
256 (135.37min - 427.35max) fps +1%
Intel Core Ultra 5 235
254 (143.31min - 402.25max) fps
Intel Core i7-12700
233 (124.52min - 364.56max) fps -8%
Intel Core i5-12400F
203 (112.65min - 299.76max) fps -20%
Intel Core i5-13400
196.9 (110.05min - 286.04max) fps -22%
F1 2020 - 1280x720 Ultra Low Preset
AMD Ryzen 7 9800X3D
687 (546min - 750max) fps +86%
AMD Ryzen 5 9600X
630 (468min - 710max) fps +71%
Intel Core i9-14900K
598 (473min - 679max) fps +62%
AMD Ryzen 9 7950X3D
594 (461min - 653max) fps +61%
AMD Ryzen 9 7950X
563 (437min - 628max) fps +53%
AMD Ryzen 5 7600X
559 (420min - 634max) fps +51%
Intel Core i9-13900K
526 (418min - 596max) fps +43%
Intel Core i7-13700K
465 (325min - 539max) fps +26%
Intel Core i7-13700
461 (323min - 528max) fps +25%
Intel Core Ultra 9 285K
454 (355min - 499max) fps +23%
Intel Core i5-14600K
403 (333min - 436max) fps +9%
Intel Core i7-12700
388 (314min - 434max) fps +5%
Intel Core Ultra 5 245K
384 (313min - 422max) fps +4%
Intel Core Ultra 5 235
369 (306min - 402max) fps
Intel Core Ultra 5 225F
343 (287min - 374max) fps -7%
Intel Core i5-12400F
322 (266min - 345max) fps -13%
Intel Core i5-13400
292 (253min - 317max) fps -21%
F1 2021 - 1280x720 Ultra Low Preset
AMD Ryzen 7 9800X3D
797 (624min, 486P1 - 869max) fps +73%
Intel Core i9-14900K
733 (560min, 450P1 - 806max) fps +59%
AMD Ryzen 5 7600X
690 (453min, 397P1 - 783max) fps +50%
AMD Ryzen 9 7950X3D
682 (522min, 418P1 - 767max) fps +48%
AMD Ryzen 9 7950X
677 (504min, 418P1 - 754max) fps +47%
AMD Ryzen 5 9600X
669 (451min, 412P1 - 741max) fps +45%
Intel Core i9-13900K
599 (469min, 379P1 - 653max) fps +30%
Intel Core i7-13700K
588 (466min, 371P1 - 639max) fps +28%
Intel Core i7-13700
572 (447min, 359P1 - 620max) fps +24%
Intel Core i5-14600K
562 (468min, 364P1 - 618max) fps +22%
Intel Core Ultra 9 285K
527 (401min, 329P1 - 583max) fps +15%
Intel Core Ultra 5 235
460 (351min, 302P1 - 501max) fps
Intel Core i7-12700
448 (363min, 297P1 - 477max) fps -3%
Intel Core Ultra 5 225F
439 (343min, 294P1 - 476max) fps -5%
Intel Core i5-12400F
393 (309min, 274P1 - 416max) fps -15%
Intel Core Ultra 5 245K
386 (318min, 250P1 - 422max) fps -16%
Intel Core i5-13400
337 (277min, 237P1 - 358max) fps -27%

Производительность ограничивается видеокартой

Performance Rating - Percent
AMD Ryzen 7 9800X3D
98.3 pt
AMD Ryzen 9 7950X3D
95.6 pt
Intel Core i9-14900K
95.2 pt
Intel Core i5-14600K
93.3 pt
AMD Ryzen 9 7950X
92.6 pt
AMD Ryzen 5 9600X
92.5 pt
AMD Ryzen 5 7600X
92.3 pt
Intel Core i9-13900K
92 pt
Intel Core i7-13700K
91.4 pt
Intel Core i7-13700
90.6 pt
Intel Core Ultra 9 285K
89.2 pt
Intel Core Ultra 5 235
87.7 pt
Intel Core Ultra 5 245K
86.9 pt
Intel Core i7-12700
86.5 pt
Intel Core Ultra 5 225F
84.5 pt
Intel Core i5-13400
82.3 pt
Intel Core i5-12400F
79.6 pt
F1 22 - 3840x2160 Ultra High Preset AA:T AF:16x
AMD Ryzen 7 9800X3D
86.6 (74min, 73P1 - 101max) fps +3%
Intel Core Ultra 9 285K
86.2 (74min, 70P1 - 101max) fps +3%
Intel Core Ultra 5 245K
85.5 (74min, 69P1 - 98max) fps +2%
AMD Ryzen 5 9600X
85 (73min, 72P1 - 99max) fps +1%
Intel Core Ultra 5 235
84 (71min, 71P1 - 97max) fps
Intel Core Ultra 5 225F
83.9 (73min, 71P1 - 97max) fps 0%
Intel Core i5-14600K
83.5 (72min, 71P1 - 96max) fps -1%
Intel Core i9-14900K
83.4 (72min, 71P1 - 96max) fps -1%
AMD Ryzen 5 7600X
83 (72min, 71P1 - 95max) fps -1%
AMD Ryzen 9 7950X
82.5 (72min, 71P1 - 96max) fps -2%
Intel Core i7-13700K
82.4 (72min, 71P1 - 95max) fps -2%
AMD Ryzen 9 7950X3D
82.3 (71min, 70P1 - 94max) fps -2%
Intel Core i5-12400F
81.7 (71min, 70P1 - 95max) fps -3%
Intel Core i7-13700
81.6 (71min, 70P1 - 93max) fps -3%
Intel Core i7-12700
81.3 (71min, 68P1 - 93max) fps -3%
Intel Core i5-13400
81.2 (72min, 67P1 - 93max) fps -3%
Intel Core i9-13900K
81.1 (71min, 70P1 - 93max) fps -3%
Far Cry 5 - 3840x2160 Ultra Preset AA:T
Intel Core i9-14900K
187 (168min - 216max) fps +19%
AMD Ryzen 7 9800X3D
183 (165min - 209max) fps +17%
Intel Core i9-13900K
182 (148min - 212max) fps +16%
AMD Ryzen 9 7950X3D
182 (157min - 212max) fps +16%
Intel Core i5-14600K
181 (151min - 215max) fps +15%
AMD Ryzen 9 7950X
175 (140min - 212max) fps +11%
AMD Ryzen 5 7600X
173 (142min - 209max) fps +10%
Intel Core i7-13700K
172 (137min - 206max) fps +10%
Intel Core i7-13700
171 (140min - 207max) fps +9%
AMD Ryzen 5 9600X
170 (136min - 198max) fps +8%
Intel Core Ultra 9 285K
158 (125min - 209max) fps +1%
Intel Core Ultra 5 235
157 (122min - 211max) fps
Intel Core i7-12700
153 (117min - 203max) fps -3%
Intel Core Ultra 5 245K
153 (117min - 210max) fps -3%
Intel Core i5-13400
142 (108min - 190max) fps -10%
Intel Core i5-12400F
131 (97min - 177max) fps -17%
Intel Core Ultra 5 225F
123 (111min - 142max) fps -22%
X-Plane 11.11 - 3840x2160 high (fps_test=3)
AMD Ryzen 9 7950X3D
158.4 fps +72%
AMD Ryzen 7 9800X3D
152 fps +65%
AMD Ryzen 5 9600X
136.6 fps +48%
Intel Core i9-14900K
136.3 fps +48%
Intel Core i9-13900K
132.3 fps +43%
AMD Ryzen 5 7600X
125.8 fps +36%
Intel Core i5-14600K
124.6 fps +35%
AMD Ryzen 9 7950X
124.5 fps +35%
Intel Core i7-13700K
121.8 fps +32%
Intel Core i7-13700
119.3 fps +29%
Intel Core Ultra 9 285K
105.8 fps +15%
Intel Core i7-12700
105.4 fps +14%
Intel Core i5-13400
95 fps +3%
Intel Core Ultra 5 245K
93.4 fps +1%
Intel Core Ultra 5 235
92.3 fps
Intel Core Ultra 5 225F
84.4 fps -9%
Intel Core i5-12400F
77 fps -17%
Final Fantasy XV Benchmark - 3840x2160 High Quality
Intel Core Ultra 5 235
163 fps
Intel Core Ultra 5 245K
162.3 fps 0%
Intel Core i9-14900K
161.9 fps -1%
Intel Core Ultra 9 285K
161.7 fps -1%
Intel Core i5-14600K
161.5 fps -1%
Intel Core i9-13900K
161.3 fps -1%
AMD Ryzen 9 7950X
161.1 fps -1%
AMD Ryzen 7 9800X3D
161.1 fps -1%
Intel Core Ultra 5 225F
159.6 fps -2%
AMD Ryzen 5 7600X
159.2 fps -2%
Intel Core i7-13700
157.9 fps -3%
AMD Ryzen 9 7950X3D
157.6 fps -3%
Intel Core i7-13700K
155.9 fps -4%
Intel Core i7-12700
153.4 fps -6%
Intel Core i5-12400F
151.9 fps -7%
AMD Ryzen 5 9600X
150.9 fps -7%
Intel Core i5-13400
149.8 fps -8%
Dota 2 Reborn - 3840x2160 ultra (3/3) best looking
AMD Ryzen 7 9800X3D
298.4 (236.3min) fps +73%
AMD Ryzen 9 7950X3D
245.4 (195.9min) fps +42%
AMD Ryzen 9 7950X
234.4 (192.2min) fps +36%
Intel Core i9-13900K
230 (185.3min) fps +33%
Intel Core i9-14900K
227.8 (188.3min) fps +32%
AMD Ryzen 5 9600X
225 (189.1min) fps +30%
AMD Ryzen 5 7600X
223.4 (185.4min) fps +29%
Intel Core i5-14600K
211.5 (179.5min) fps +23%
Intel Core i7-13700K
200.2 (165.5min) fps +16%
Intel Core i7-13700
196.8 (166.7min) fps +14%
Intel Core Ultra 9 285K
193.6 (162.4min) fps +12%
Intel Core Ultra 5 235
172.6 (148.9min) fps
Intel Core Ultra 5 245K
168 (143.3min) fps -3%
Intel Core Ultra 5 225F
164.8 (142.3min) fps -5%
Intel Core i7-12700
163.7 (141.2min) fps -5%
Intel Core i5-12400F
150.3 (129.4min) fps -13%
Intel Core i5-13400
149.8 (129.3min) fps -13%
The Witcher 3 - 3840x2160 High Graphics & Postprocessing (Nvidia HairWorks Off)
AMD Ryzen 5 7600X
294 fps +2%
Intel Core i9-14900K
293 (121.6min, 193.2P0.1, 243P1 - 865max) fps +2%
Intel Core Ultra 5 225F
291 (32.3min, 251P0.1, 266P1 - 332max) fps +1%
Intel Core i5-14600K
288 (85.6min, 166.1P0.1, 233P1 - 721max) fps 0%
Intel Core Ultra 5 235
287 (228min, 251P0.1, 261P1 - 350max) fps
Intel Core Ultra 9 285K
286 (152.2min, 226P0.1, 257P1 - 596max) fps 0%
AMD Ryzen 9 7950X
284 (88.3min, 166.6P0.1, 240P1 - 831max) fps -1%
Intel Core Ultra 5 245K
284 (132.6min, 215P0.1, 256P1 - 516max) fps -1%
Intel Core i5-13400
282.2 fps -2%
Intel Core i7-13700
282.1 fps -2%
Intel Core i7-12700
282 fps -2%
AMD Ryzen 7 9800X3D
282 (147.6min, 226P0.1, 253P1 - 751max) fps -2%
Intel Core i7-13700K
278.9 fps -3%
AMD Ryzen 5 9600X
277 (20.2min, 154.7P0.1, 219P1 - 925max) fps -3%
AMD Ryzen 9 7950X3D
275.2 fps -4%
Intel Core i5-12400F
254 fps -11%
Intel Core i9-13900K
239 (103.3min, 154P0.1, 203P1 - 639max) fps -17%
GTA V - 3840x2160 High/On (Advanced Graphics Off) AA:FX AF:8x
AMD Ryzen 5 9600X
187.7 (4.85min, 200P1 - 597max) fps +1%
Intel Core i9-14900K
187.6 (4.19min, 200P1 - 613max) fps +1%
AMD Ryzen 7 9800X3D
187.6 (3.92min, 200P1 - 615max) fps +1%
Intel Core i9-13900K
187.5 (3.71min, 200P1 - 553max) fps +1%
AMD Ryzen 9 7950X
187.5 (2.97min, 200P1 - 593max) fps +1%
Intel Core i7-13700K
187.5 (6.22min, 200P1 - 502max) fps +1%
Intel Core i5-14600K
187.4 (5.2min, 200P1 - 502max) fps +1%
Intel Core i7-13700
187.2 (1.451min, 200P1 - 464max) fps +1%
AMD Ryzen 5 7600X
186.5 (2.19min, 166.7P1 - 524max) fps 0%
AMD Ryzen 9 7950X3D
186.5 (2.67min, 166.7P1 - 575max) fps 0%
Intel Core Ultra 9 285K
186 (2.01min, 166.7P1 - 464max) fps 0%
Intel Core Ultra 5 235
185.6 (2.67min, 142.9P1 - 404max) fps
Intel Core Ultra 5 245K
183.7 (2.01min, 125P1 - 443max) fps -1%
Intel Core i7-12700
182 (2.29min, 142.9P1 - 460max) fps -2%
Intel Core Ultra 5 225F
181.4 (3.5min, 142.9P1 - 390max) fps -2%
Intel Core i5-13400
178.2 (2.26min, 125P1 - 359max) fps -4%
Intel Core i5-12400F
175.6 (3.48min, 125P1 - 323max) fps -5%
Borderlands 3 - 3840x2160 Badass Overall Quality (DX11)
Intel Core i7-13700K
143.4 fps +15%
AMD Ryzen 7 9800X3D
138.5 fps +12%
Intel Core i9-14900K
137.9 fps +11%
AMD Ryzen 9 7950X3D
136.4 fps +10%
Intel Core i5-14600K
136.1 fps +10%
Intel Core i9-13900K
135.5 fps +9%
AMD Ryzen 9 7950X
135 fps +9%
AMD Ryzen 5 7600X
133.4 fps +7%
Intel Core i7-13700
132.4 fps +7%
AMD Ryzen 5 9600X
131.8 fps +6%
Intel Core Ultra 9 285K
128.6 fps +4%
Intel Core i7-12700
125.5 fps +1%
Intel Core Ultra 5 235
124.2 fps
Intel Core Ultra 5 245K
124 fps 0%
Intel Core Ultra 5 225F
122.7 fps -1%
Intel Core i5-13400
120.5 fps -3%
Intel Core i5-12400F
114.4 fps -8%
Far Cry New Dawn - 3840x2160 Ultra Preset
AMD Ryzen 7 9800X3D
183 (144min - 214max) fps +42%
AMD Ryzen 9 7950X3D
171 (130min - 219max) fps +33%
Intel Core i9-14900K
161 (122min - 221max) fps +25%
Intel Core i9-13900K
154 (113min - 219max) fps +19%
Intel Core i5-14600K
153 (115min - 219max) fps +19%
AMD Ryzen 5 9600X
148 (110min - 200max) fps +15%
AMD Ryzen 9 7950X
145 (104min - 215max) fps +12%
Intel Core i7-13700
145 (106min - 212max) fps +12%
Intel Core i7-13700K
145 (109min - 213max) fps +12%
AMD Ryzen 5 7600X
142 (99min - 212max) fps +10%
Intel Core Ultra 9 285K
130 (90min - 200max) fps +1%
Intel Core Ultra 5 235
129 (94min - 200max) fps
Intel Core i7-12700
127 (92min - 198max) fps -2%
Intel Core Ultra 5 245K
120 (85min - 198max) fps -7%
Intel Core i5-13400
119 (88min - 182max) fps -8%
Intel Core Ultra 5 225F
111 (88min - 146max) fps -14%
Intel Core i5-12400F
110 (79min - 170max) fps -15%
Tiny Tina's Wonderlands - 3840x2160 Badass Preset (DX12)
Intel Core Ultra 5 225F
133.4 fps +1%
Intel Core Ultra 5 245K
132.6 fps 0%
Intel Core Ultra 9 285K
132.6 fps 0%
Intel Core Ultra 5 235
132.2 fps
Intel Core i9-14900K
131.7 fps 0%
AMD Ryzen 9 7950X3D
131.3 fps -1%
AMD Ryzen 7 9800X3D
131.1 fps -1%
AMD Ryzen 5 7600X
130.6 fps -1%
Intel Core i5-14600K
130.4 fps -1%
AMD Ryzen 9 7950X
130.3 fps -1%
Intel Core i7-13700
130.2 fps -2%
AMD Ryzen 5 9600X
130 fps -2%
Intel Core i9-13900K
129.8 fps -2%
Intel Core i7-12700
129.7 fps -2%
Intel Core i5-13400
129.7 fps -2%
Intel Core i7-13700K
129.6 fps -2%
Intel Core i5-12400F
114.2 fps -14%
Strange Brigade - 3840x2160 ultra AA:ultra AF:16
Intel Core i9-14900K
291 (120min, 249P1 - 467max) fps +1%
Intel Core i5-14600K
289 (243min, 249P1 - 426max) fps 0%
AMD Ryzen 7 9800X3D
289 (238min, 246P1 - 408max) fps 0%
Intel Core Ultra 9 285K
288 (214min, 245P1 - 410max) fps 0%
Intel Core Ultra 5 235
288 (30.7min, 244P1 - 401max) fps
Intel Core Ultra 5 225F
288 (183.3min, 243P1 - 394max) fps 0%
AMD Ryzen 5 9600X
286 (37.1min, 244P1 - 520max) fps -1%
Intel Core i7-13700K
285 (59.9min, 241P1 - 552max) fps -1%
AMD Ryzen 9 7950X3D
285 (53.2min, 243P1 - 469max) fps -1%
Intel Core Ultra 5 245K
285 (195.3min, 242P1 - 410max) fps -1%
Intel Core i7-12700
284 (44.1min, 236P1 - 407max) fps -1%
AMD Ryzen 5 7600X
283 (39.7min, 242P1 - 668max) fps -2%
Intel Core i7-13700
282 (28.1min, 238P1 - 533max) fps -2%
AMD Ryzen 9 7950X
281 (31.7min, 239P1 - 482max) fps -2%
Intel Core i5-12400F
281 (59.7min, 240P1 - 421max) fps -2%
Intel Core i9-13900K
279 (59.9min, 239P1 - 532max) fps -3%
Intel Core i5-13400
278 (59.8min, 227P1 - 408max) fps -3%
Metro Exodus - 3840x2160 Ultra Quality AF:16x
Intel Core i9-14900K
143.4 (84.04min - 227.17max) fps +6%
Intel Core i5-14600K
142.1 (81.45min - 230.73max) fps +5%
AMD Ryzen 9 7950X
139.7 (76.95min - 229.15max) fps +4%
AMD Ryzen 9 7950X3D
139.4 (76.47min - 227.32max) fps +3%
Intel Core i9-13900K
138.6 (76.78min - 237.3max) fps +3%
AMD Ryzen 5 9600X
138 (71.03min - 235.4max) fps +2%
AMD Ryzen 5 7600X
137 (71.99min - 228.62max) fps +2%
Intel Core i7-13700
136.9 (71.43min - 234.36max) fps +2%
Intel Core i7-13700K
136.9 (72.87min - 233.59max) fps +2%
AMD Ryzen 7 9800X3D
135 (79.78min - 194.59max) fps 0%
Intel Core Ultra 5 235
134.8 (73.83min - 222.52max) fps
Intel Core Ultra 5 245K
134.7 (69.85min - 225.07max) fps 0%
Intel Core Ultra 9 285K
134 (68.14min - 237.76max) fps -1%
Intel Core Ultra 5 225F
133.9 (72.93min - 220.07max) fps -1%
Intel Core i7-12700
132.4 (68.05min - 211.86max) fps -2%
Intel Core i5-13400
126.7 (68.66min - 196.97max) fps -6%
Intel Core i5-12400F
124.1 (74min - 188.01max) fps -8%
F1 2020 - 3840x2160 Ultra High Preset AA:T AF:16x
AMD Ryzen 7 9800X3D
292 (243min - 326max) fps +8%
Intel Core i9-14900K
289 (237min - 340max) fps +7%
AMD Ryzen 9 7950X3D
288 (242min - 339max) fps +7%
Intel Core i5-14600K
288 (242min - 338max) fps +7%
AMD Ryzen 5 9600X
287 (243min - 337max) fps +6%
AMD Ryzen 9 7950X
286 (245min - 335max) fps +6%
Intel Core i9-13900K
285 (240min - 333max) fps +6%
AMD Ryzen 5 7600X
285 (241min - 333max) fps +6%
Intel Core i7-13700K
284 (242min - 329max) fps +5%
Intel Core i7-13700
283 (240min - 332max) fps +5%
Intel Core i7-12700
275 (197min - 319max) fps +2%
Intel Core Ultra 9 285K
273 (236min - 319max) fps +1%
Intel Core Ultra 5 245K
270 (233min - 318max) fps 0%
Intel Core Ultra 5 235
270 (221min - 319max) fps
Intel Core Ultra 5 225F
262 (219min - 302max) fps -3%
Intel Core i5-12400F
247 (202min - 285max) fps -9%
Intel Core i5-13400
229 (184min - 265max) fps -15%
F1 2021 - 3840x2160 Ultra High Preset + Raytracing AA:T AF:16x
AMD Ryzen 7 9800X3D
217 (184min, 175P1 - 242max) fps +9%
AMD Ryzen 5 9600X
205 (176min, 168P1 - 232max) fps +3%
AMD Ryzen 5 7600X
203 (173min, 170P1 - 228max) fps +2%
AMD Ryzen 9 7950X3D
203 (169min, 169P1 - 225max) fps +2%
Intel Core i9-14900K
203 (173min, 165P1 - 226max) fps +2%
Intel Core i5-14600K
201 (173min, 153P1 - 227max) fps +1%
Intel Core Ultra 9 285K
200 (168min, 137P1 - 218max) fps 0%
Intel Core Ultra 5 235
199.8 (168min, 149P1 - 216max) fps
AMD Ryzen 9 7950X
199.1 (168min, 166P1 - 223max) fps 0%
Intel Core i7-13700K
197.5 (169min, 158P1 - 222max) fps -1%
Intel Core Ultra 5 245K
196.9 (171min, 139P1 - 211max) fps -1%
Intel Core i7-13700
196.8 (166min, 156P1 - 217max) fps -2%
Intel Core Ultra 5 225F
196.7 (166min, 147P1 - 215max) fps -2%
Intel Core i9-13900K
196.5 (166min, 152P1 - 220max) fps -2%
Intel Core i7-12700
193.1 (162min, 137P1 - 211max) fps -3%
Intel Core i5-12400F
185 (153min, 132P1 - 197max) fps -7%
Intel Core i5-13400
176.2 (144min, 127P1 - 189max) fps -12%

Intel Core Ultra 5 235 + Nvidia GeForce RTX 4090

all | 2015 | 2018 | 2019 | 2020 | 2021 | 2022 | 2023 | 2024 | 2025
мин.сред.выс.макс.QHD4K
Kingdom Come Deliverance 2 (2025) 243 206 184.7 162.6 139.3 82.7
show all (27 hidden)

Intel Core Ultra 5 225F + Nvidia GeForce RTX 4090

all | 2015 | 2018 | 2019 | 2020 | 2021 | 2022 | 2023 | 2024 | 2025
мин.сред.выс.макс.QHD4K
Kingdom Come Deliverance 2 (2025) 227 190.6 169.2 150.7 139 83.1
show all (27 hidden)

Энергопотребление

Когда дело доходит до энергопотребления, Intel Core Ultra 5 235 и Core Ultra 5 225F демонстрируют явное улучшение по сравнению с предыдущими поколениями. Несмотря на достойную производительность процессоров, их энергопотребление остается умеренным. Оба процессора работают на уровне 65 Вт при постоянной нагрузке, хотя в режиме Turbo достигается 121 Вт. И наоборот, это также означает лучшую энергоэффективность Intel Core Ultra 5 235 по сравнению с Intel Core Ultra 5 225F, как Вы можете видеть из наших результатов. Охлаждение этих двух процессоров не представляет собой серьезной проблемы.

Intel Core Ultra 5 235

Система тестирования энергопотребления - холостой ход
Система тестирования энергопотребления - Cinebench R15 nT
Система тестирования энергопотребления - Cinebench R23 1T
Система тестирования энергопотребления - Cinebench R23 nT
Тестовая система энергопотребления - игры (Cyberpunk 2077 1,920 x 1,080 Ultra Preset)
Система тестирования энергопотребления - Стресс-тест Prime95
Стресс-тест - Prime95
 

Эффективность

Performance Rating
AMD Ryzen 7 9700X
93.5 pt
AMD Ryzen 9 9950X
93.4 pt
Intel Core Ultra 5 235
92 pt
Intel Core Ultra 9 285K
92 pt
Intel Core Ultra 5 245K
85.8 pt
AMD Ryzen 9 7950X
78.3 pt
Intel Core Ultra 5 225F
75.5 pt
AMD Ryzen 5 9600X
67.5 pt
Intel Core i9-14900K
65.2 pt
AMD Ryzen 7 7800X3D
62.8 pt
Intel Core i5-14600K
60.7 pt
Power Consumption / Cinebench R23 Single Power Efficiency - external Monitor
AMD Ryzen 7 9700X
19.7 Points per Watt +1%
Intel Core Ultra 5 235
19.6 Points per Watt
Intel Core Ultra 9 285K
19.5 Points per Watt -1%
Intel Core Ultra 5 245K
18.6 Points per Watt -5%
Intel Core Ultra 5 225F
16.5 Points per Watt -16%
AMD Ryzen 9 9950X
15.8 Points per Watt -19%
Intel Core i9-14900K
15.51 Points per Watt -21%
AMD Ryzen 5 9600X
15.2 Points per Watt -22%
Intel Core i5-14600K
13.8 Points per Watt -30%
AMD Ryzen 9 7950X
13.1 Points per Watt -33%
AMD Ryzen 7 7800X3D
9.54 Points per Watt -51%
Power Consumption / Cinebench R23 Multi Power Efficiency - external Monitor
AMD Ryzen 9 9950X
129.5 Points per Watt +4%
Intel Core Ultra 5 235
124.8 Points per Watt
Intel Core Ultra 9 285K
119.8 Points per Watt -4%
AMD Ryzen 7 9700X
116.9 Points per Watt -6%
Intel Core Ultra 5 245K
109.9 Points per Watt -12%
AMD Ryzen 9 7950X
108.4 Points per Watt -13%
Intel Core Ultra 5 225F
96.9 Points per Watt -22%
AMD Ryzen 7 7800X3D
89.1 Points per Watt -29%
AMD Ryzen 5 9600X
82.2 Points per Watt -34%
Intel Core i9-14900K
77.57 Points per Watt -38%
Intel Core i5-14600K
73.8 Points per Watt -41%
Power Consumption / Cinebench R15 Multi Efficiency (external Monitor)
AMD Ryzen 9 9950X
20.2 Points per Watt +25%
AMD Ryzen 7 9700X
18.2 Points per Watt +12%
AMD Ryzen 9 7950X
17.1 Points per Watt +6%
Intel Core Ultra 9 285K
17.1 Points per Watt +6%
Intel Core Ultra 5 235
16.2 Points per Watt
Intel Core Ultra 5 245K
15.8 Points per Watt -2%
AMD Ryzen 7 7800X3D
14.4 Points per Watt -11%
Intel Core Ultra 5 225F
13.7 Points per Watt -15%
AMD Ryzen 5 9600X
12.5 Points per Watt -23%
Intel Core i9-14900K
11.5 Points per Watt -29%
Intel Core i5-14600K
11.1 Points per Watt -31%
Power Consumption / Cinebench R15 Multi (external Monitor)
Intel Core i9-14900K
548 (545min, 545P1 - 551max) Watt * -144%
Intel Core Ultra 9 285K
373 (360min, 360P1 - 402max) Watt * -66%
Intel Core i7-13700
365 (363min, 363P1 - 367max) Watt * -62%
Intel Core i7-13700K
357 (356min, 356P1 - 362max) Watt * -59%
Intel Core i5-14600K
329 (323min, 324P1 - 331max) Watt * -46%
Intel Core i7-12700
284 (282min, 282P1 - 287max) Watt * -26%
AMD Ryzen 9 7950X3D
273 (264min, 264P1 - 304max) Watt * -21%
Intel Core Ultra 5 245K
244 (242min, 242P1 - 246max) Watt * -8%
Intel Core Ultra 5 235
225 (206min, 206P1 - 250max) Watt *
AMD Ryzen 5 7600X
215 (134.8min, 135.6P1 - 259max) Watt * +4%
AMD Ryzen 5 9600X
210 (209min, 209P1 - 210max) Watt * +7%
AMD Ryzen 7 7800X3D
207 (203min, 203P1 - 216max) Watt * +8%
Intel Core i5-13400
196.6 (194.6min, 194.6P1 - 207max) Watt * +13%
Intel Core i5-12400F
194.4 (192.3min, 192.3P1 - 200max) Watt * +14%
Intel Core Ultra 5 225F
193.8 (183.5min, 184.9P1 - 195.9max) Watt * +14%
Power Consumption / Prime95 V2810 Stress (external Monitor)
Intel Core i9-14900K
537 (508min, 510P1 - 606max) Watt * -229%
Intel Core i7-13700
386 (363min, 364P1 - 487max) Watt * -137%
Intel Core Ultra 9 285K
382 (374min, 376P1 - 392max) Watt * -134%
Intel Core i5-14600K
370 (349min, 349P1 - 422max) Watt * -127%
Intel Core i7-13700K
357 (341min, 342P1 - 458max) Watt * -119%
Intel Core i7-12700
327 (304min, 305P1 - 394max) Watt * -101%
AMD Ryzen 9 7950X3D
276 (267min, 267P1 - 329max) Watt * -69%
Intel Core Ultra 5 245K
263 (256min, 256P1 - 271max) Watt * -61%
Intel Core i5-12400F
239 (225min, 226P1 - 252max) Watt * -47%
Intel Core i5-13400
229 (224min, 224P1 - 247max) Watt * -40%
AMD Ryzen 5 7600X
227 (218min, 219P1 - 245max) Watt * -39%
AMD Ryzen 7 7800X3D
218 (214min, 215P1 - 223max) Watt * -34%
AMD Ryzen 5 9600X
213 (207min, 208P1 - 220max) Watt * -31%
Intel Core Ultra 5 225F
163.7 (156.1min, 156.6P1 - 226max) Watt * -0%
Intel Core Ultra 5 235
163 (152.8min, 153.4P1 - 227max) Watt *

* ... меньше = лучше
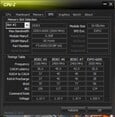
Энергопотребление
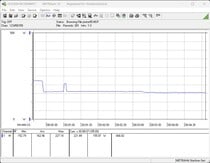
0306090120150180210240270300330360390420450480510540570Tooltip
Intel Core Ultra 5 235 Ultra 5 235, NVIDIA GeForce RTX 4090; Prime95 V2810 Stress (external Monitor): Ø163 (152.8-227)
Intel Core Ultra 5 225F Ultra 5 225F, NVIDIA GeForce RTX 4090; Prime95 V2810 Stress (external Monitor): Ø163.7 (156.1-226)
Intel Core Ultra 9 285K Ultra 9 285K, NVIDIA GeForce RTX 4090; Prime95 V2810 Stress (external Monitor): Ø382 (374-392)
Intel Core Ultra 5 245K Ultra 5 245K, NVIDIA GeForce RTX 4090; Prime95 V2810 Stress (external Monitor): Ø263 (256-271)
Intel Core Ultra 5 235 Ultra 5 235, NVIDIA GeForce RTX 4090; Cinebench R15 Multi (external Monitor): Ø225 (206-250)
Intel Core Ultra 5 225F Ultra 5 225F, NVIDIA GeForce RTX 4090; Cinebench R15 Multi (external Monitor): Ø193.8 (183.5-195.9)
Intel Core Ultra 9 285K Ultra 9 285K, NVIDIA GeForce RTX 4090; Cinebench R15 Multi (external Monitor): Ø373 (360-402)
Intel Core Ultra 5 245K Ultra 5 245K, NVIDIA GeForce RTX 4090; Cinebench R15 Multi (external Monitor): Ø244 (242-246)
Intel Core Ultra 5 235 Ultra 5 235, NVIDIA GeForce RTX 4090; Cinebench R23 Single (external Monitor): Ø105 (101.7-177)
Intel Core Ultra 5 225F Ultra 5 225F, NVIDIA GeForce RTX 4090; Cinebench R23 Single (external Monitor): Ø114.9 (111.3-172.4)
Intel Core Ultra 9 285K Ultra 9 285K, NVIDIA GeForce RTX 4090; Cinebench R23 Single (external Monitor): Ø120 (114.3-180.3)
Intel Core Ultra 5 245K Ultra 5 245K, NVIDIA GeForce RTX 4090; Cinebench R23 Single (external Monitor): Ø114.4 (109.6-170.5)
Intel Core Ultra 5 235 Ultra 5 235, NVIDIA GeForce RTX 4090; Cinebench R23 Multi (external Monitor): Ø173.7 (146.4-200)
Intel Core Ultra 5 225F Ultra 5 225F, NVIDIA GeForce RTX 4090; Cinebench R23 Multi (external Monitor): Ø170 (150.6-193.8)
Intel Core Ultra 9 285K Ultra 9 285K, NVIDIA GeForce RTX 4090; Cinebench R23 Multi (external Monitor): Ø355 (352-359)
Intel Core Ultra 5 245K Ultra 5 245K, NVIDIA GeForce RTX 4090; Cinebench R23 Multi (external Monitor): Ø228 (225-232)
Intel Core Ultra 5 235 Ultra 5 235, NVIDIA GeForce RTX 4090; 1280x720 FurMark 1.19 GPU Stress Test (external Monitor): Ø544 (519-568)
Intel Core Ultra 5 225F Ultra 5 225F, NVIDIA GeForce RTX 4090; 1280x720 FurMark 1.19 GPU Stress Test (external Monitor): Ø554 (542-585)
Intel Core Ultra 9 285K Ultra 9 285K, NVIDIA GeForce RTX 4090; 1280x720 FurMark 1.19 GPU Stress Test (external Monitor): Ø557 (538-585)
Intel Core Ultra 5 245K Ultra 5 245K, NVIDIA GeForce RTX 4090; 1280x720 FurMark 1.19 GPU Stress Test (external Monitor): Ø552 (534-578)

Энергопотребление

0306090120150180210240270300330360390420450480510Tooltip
Intel Core Ultra 5 235 Ultra 5 235, NVIDIA GeForce RTX 4090; Idle 1min (external Monitor): Ø92.3 (89.4-107.7)
Intel Core Ultra 5 225F Ultra 5 225F, NVIDIA GeForce RTX 4090; Idle 1min (external Monitor): Ø94 (93.1-95.4)
Intel Core Ultra 9 285K Ultra 9 285K, NVIDIA GeForce RTX 4090; Idle 1min (external Monitor): Ø95.7 (91.8-102.2)
Intel Core Ultra 5 245K Ultra 5 245K, NVIDIA GeForce RTX 4090; Idle 1min (external Monitor): Ø93.8 (91.9-96.8)
Intel Core Ultra 5 235 Ultra 5 235, NVIDIA GeForce RTX 4090; Cyberpunk 2077 FHD ultra no FSR (external Monitor): Ø434 (406-445)
Intel Core Ultra 5 225F Ultra 5 225F, NVIDIA GeForce RTX 4090; Cyberpunk 2077 FHD ultra no FSR (external Monitor): Ø414 (397-448)
Intel Core Ultra 9 285K Ultra 9 285K, NVIDIA GeForce RTX 4090; Cyberpunk 2077 FHD ultra no FSR (external Monitor): Ø439 (432-447)
Intel Core Ultra 5 245K Ultra 5 245K, NVIDIA GeForce RTX 4090; Cyberpunk 2077 FHD ultra no FSR (external Monitor): Ø425 (411-433)
Intel Core Ultra 5 235 Ultra 5 235, NVIDIA GeForce RTX 4090; 1920x1080 The Witcher 3 ultra (external Monitor): Ø491 (473-527)
Intel Core Ultra 5 225F Ultra 5 225F, NVIDIA GeForce RTX 4090; 1920x1080 The Witcher 3 ultra (external Monitor): Ø473 (443-489)
Intel Core Ultra 9 285K Ultra 9 285K, NVIDIA GeForce RTX 4090; 1920x1080 The Witcher 3 ultra (external Monitor): Ø515 (499-537)
Intel Core Ultra 5 245K Ultra 5 245K, NVIDIA GeForce RTX 4090; 1920x1080 The Witcher 3 ultra (external Monitor): Ø492 (455-506)

Общая оценка Notebookcheck

Процессоры Intel Core Ultra 5 235 и Core Ultra 5 225F впечатляют своей современной архитектурой, хорошей эффективностью и солидной повседневной производительностью. Их встроенный NPU открывает потенциал для приложений искусственного интеллекта, но на практике он все еще ограничен. Благодаря низкому энергопотреблению и простому охлаждению оба процессора особенно эффективны - идеальное решение для очень компактных, но мощных систем.

Декларация о непредвзятости

Отбор устройств для обзора осуществляется нашей редакцией. Тестовый образец был предоставлен автору производителем или продавцом для целей настоящего обзора. Кредитор не имел никакого влияния на этот обзор, и производитель не получил копию этого обзора до публикации. Обязанности публиковать этот обзор не было. Мы никогда не принимаем компенсацию или оплату в обмен на наши отзывы. Являясь независимой медиа-компанией, Notebookcheck не подчиняется власти производителей, розничных продавцов или издателей.

Вот как проводит тестирование Notebookcheck

Каждый год Notebookcheck независимо проверяет сотни ноутбуков и смартфонов, используя стандартизированные процедуры, чтобы гарантировать сопоставимость всех результатов. В течение примерно 20 лет мы постоянно совершенствовали наши методы испытаний и при этом установили отраслевые стандарты. В наших испытательных лабораториях опытные специалисты и редакторы используют высококачественное измерительное оборудование. Эти тесты включают в себя многоэтапный процесс проверки. Наша сложная рейтинговая система основана на сотнях обоснованных измерений и критериев, что обеспечивает объективность.

Этот важный материал точно понравится твоим друзьям в социальных сетях!
Mail Logo
'
> Обзоры Ноутбуков, Смартфонов, Планшетов. Тесты и Новости > Обзоры > Intel Core Ultra 5 235 и 225F против AMD Ryzen - Какой процессор выгоднее?
Sebastian Bade, 2025-05-19 (Update: 2025-05-19)